Abstract
We describe a method to detect molecular complexes and measure their stoichiometry in living cells from simultaneous fluctuations of the fluorescence intensity in two image channels, each detecting a different kind of protein. The number and brightness (N&B) analysis, namely, the use of the ratio between the variance and the average intensity to obtain the brightness of molecules, is extended to the cross-variance of the intensity fluctuations in two channels. We apply the cross-variance method to determine the stoichiometry of complexes containing paxillin and vinculin or focal adhesion kinase (FAK) in disassembling adhesions in mouse embryo fibroblasts expressing FAK, vinculin, and paxillin-tagged with EGFP and mCherry. We found no complexes of these proteins in the cytoplasm away from the adhesions. However, at the adhesions, large aggregates leave, forming a hole, during their disassembly. This hole shows cross-correlation between FAK and paxillin and vinculin and paxillin. From the amplitude of the correlated fluctuations we determine the composition of the aggregates leaving the adhesions. These aggregates disassemble rapidly in the cytoplasm because large complexes are found only in very close proximity to the adhesions or at their borders.
Keywords: brightness analysis, confocal microscopy, cross-correlation
Cell migration, like many cellular phenomena, is characterized by localized, transient processes mediated by specialized molecular complexes (1). A goal of cell biology is to detect these complexes and determine when and where they form as cellular processes unfold. The highly localized and transient nature of some cellular phenomena makes this particularly challenging. To date, FRET has emerged as the dominant method for detecting protein complexes in living cells. However, it often requires careful placement of fluorescent probes to ensure that FRET will occur, and it is relatively insensitive. Recently, we introduced another approach, ccRICS (cross-correlation RICS), based on cross-correlating simultaneous dynamic fluctuations in two channels that are intrinsic to raster scanned images generated by laser scanning confocal microscopes (2). This method works on any pair of labeled proteins, is highly sensitive, and produces maps of complexes in living cells. However, neither FRET nor ccRICS provides the pixel resolution needed to localize many processes. More importantly, neither reveals the stoichiometry of the complex, which can provide significant mechanistic insight.
In this article, we report a method for determining both the presence and the stoichiometry of protein complexes at pixel resolution and apply it to disassembling adhesions. It is derived from fluorescence fluctuation methods that have single-molecule sensitivity and is based on our described N&B method that measures the number and brightness (aggregation state for this application) of fluorescent molecules in every pixel of a confocal microscope image (3). The new method exploits the correlation of fluorescence amplitude fluctuations for two colors and detects the presence of molecular complexes and their stoichiometry. Although the original N&B method was developed for one color, i.e., a single-molecular species, the new method, ccN&B, extends the analysis to two colors and introduces the concept of cross-variance. This method is similar in concept to the two-color photon counting histogram (PCH) analysis (4). However, the covariance-based ccN&B method also generates pixel resolution maps of protein complexes and can be used on commercial confocal microscopes. The method is highly sensitive and has relatively high temporal resolution.
We have applied this method to adhesion complexes in cells. In addition of their structural role, to link the extracellular substratum to actin filaments, they also serve as signaling centers that regulate many cellular processes, including their own assembly and turnover, migration, gene expression, apoptosis, and proliferation (1, 5, 6). Adhesions comprise >100 different molecules, some associated stably and others transiently (5). Morphologically, there is much variation among adhesions, and it is thought that specific adhesions and perhaps even parts of adhesions mediate different functions (5). Adhesions form and disassemble, through an orchestrated sequence of events, in anywhere from less than a minute to many minutes depending on the particular type of adhesion (7). The exact sequence of events that mediate the turnover of adhesions and the stoichiometry of protein complexes in and around adhesions are unknown because methods to detect and quantify them have not been available.
For these studies, we have used focal adhesion kinase (FAK), paxillin (Pax) and vinculin (Vn) labeled with EGFP and mCherry. In vitro, both FAK and Vn bind to Pax at a similar locus; however, these molecules show no FRET in cells (2). By using the ccN&B analysis, we have followed many adhesions in cells for several minutes and determined the stoichiometry of the protein complexes within them. We show that complexes are present only at or very near adhesions and they change with time. We also determined the distribution of relative amounts of two proteins in the complexes, all at pixel resolution. The data reveal an underappreciated fine structure within adhesions and show that the adhesion functions as a scaffold for the formation of protein complexes and that formed complexes do not reside in the cytoplasm.
Two-Color N&B Analysis.
For one-channel data the number N and brightness B at each pixel are defined as (3, 8)
where 〈k〉 and σ2 are the average and the variance of the intensity at 1 pixel in a time series of K. For two channels [green (G) and red (R)], we define the cross-variance as
where Gi is the intensity of a pixel in the green channel at frame i, and 〈G〉 is the average intensity over the K frames. The same definitions hold for the red channel.
The cross-brightness histogram plot, called Bcc in this article, is the plot of the normalized cross-variance vs. the brightness of either channel. The normalization is with respect to the average intensity of both channels as shown in Eq. 4.
 |
Thus, there are two Bcc plots, one for each channel indicated by Bcc1 and Bcc2. The cross-number is defined as
Following the above definitions, the cross-variance is centered on zero if the fluctuations in the two channels are independent. It could be positive if the two channels are correlated and negative if the two channels are anticorrelated. In the following section, we show how to obtain the stoichiometry of protein complexes by using the brightness expression for each channel and the cross-variance. This method is general and can be applied to any pair of labeled proteins in which the fluorophores do not have substantial FRET.
B1–B2 Plot and the Symmetry of the Bcc Plot.
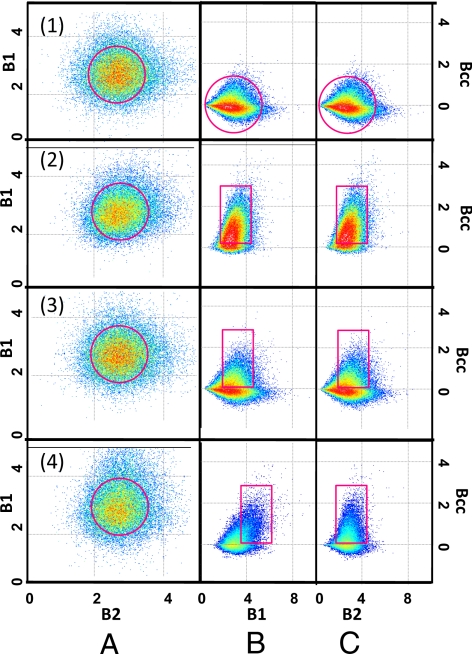
Here, we simulate 100 particles (50 for each color) diffusing in a plane to illustrate the steps necessary for determining the stoichiometry of a complex. In the simulation, the diffusion constant is 10 μm2/s, and the image is scanned in a region of 256 × 256 pixels with a pixel dwell time of 15.62 μs, and the brightness is set at 10,000 counts per second per molecule. The size of each pixel is 50 nm, and the waist of the Gaussian illumination volume is 0.5 μm. First, we simulate a system in which the fluctuations in the two channels are independent. The simulation was done for 25 frames. For each pixel and channel, we calculate the brightness according to Eq. 2. We then plot the histogram of the values of the brightness of the two channels one vs. the other in the B1–B2 plot (Fig. 1A1). This plot is needed to determine the brightness of the “monomer” and to determine whether particles of different brightness exist in the system. Monomer here is defined as the element of minimum brightness and in principle can be composed of several proteins, if they exist only as an aggregate. For this simulation, the B1–B2 map is symmetric relative to the 45° angle because the brightness of the particles in both channels is the same (Fig. 1A1). This plot shows a large population (inside the red circle) that we identify as the monomers. The center of the distribution in Fig. 1A1 gives the value of the monomer brightness for the two channels, respectively. The B1–B2 plot does not reveal whether the particles reside in a complex. To determine this, we calculate the histogram of σcc2 (defined in Eq. 3) vs. B1 and B2 values, respectively, providing two plots (called the Bcc plots) as shown in Fig. 1 row 1, columns 2 and 3. These plots are relatively symmetric around the zero horizontal line, indicating that, on average, there are the same numbers of positive and negative contributions to the cross-variance. The symmetry of this plot is the signature of absence of interactions between the two proteins. Sometimes these plots appear nonsymmetric, although centered on the zero line. This is caused by the Poisson statistics when there are few counts in a pixel. When a pixel has more counts, the distribution in each pixel tends to be Gaussian, and the plot is more symmetric. We then simulated a situation in which we have the same particle brightness as before, but 25% of these particles are part of a molecular complex, i.e., 37.5% are only emitting in channel 1, 37.5% only in channel 2, and 25% in both channels. Fig. 1 row 2 shows the Bcc plots, which are now mostly positive. The B1–B2 plot (Fig. 1 row 2, column 1) for the case with correlation is identical to that of Fig. 1 row 1, column 1 for the simulation without correlation. This simulation shows that the B1–B2 plot is insufficient to reveal the existence of a complex. We repeated the simulation for a system with only 5% of the particles carrying both colors, the rest being independent. Fig. 1 row 3, columns 2 and 3 shows that the Bcc plots are still partially positive even for this low fraction of complexes.
Fig. 1.
Simulations: 100 particles move on a plane with a diffusion constant D = 10 μm2/s. The fraction of molecules correlated changes from Top to Bottom. Row 1, particles are uncorrelated; row 2, 25% of particles are correlated; row 3, 5% of the particles are correlated; and row 4, 5% of the particles are correlated with a brightness ratio 2:1. When the particles are correlated, the Bcc plot has a strong positive component. In row 1, the circle indicates that the distribution is symmetric about the horizontal axis. In rows 2 and 3, the rectangular selector in the Bcc plots indicates that the correlation is nonsymmetric (positive) with respect to the horizontal axis, and the horizontal position corresponds to the average brightness in each channel as determined from the B1–B2 plot. The deviation from symmetry is larger for row 2. In row 4, the rectangular selector is in a horizontal position that corresponds to the ratio 2:1 (green to red) of the simulated data.
Complexes with Different Stoichiometry.
Next. we examine the case in which we have positive correlations with different ratios of the intensity in the two channels. Fig. 1 row 4 illustrates the case in which we have 5% molecular complexes with a 2:1 relative intensity ratio in the two channels. This situation simulates a ternary complex with two green proteins and one red protein in a sea of green and red monomers. We expect to see different regions of correlation in the Bcc plots for the two channels as shown in Fig. 1 row 4, columns 2 and 3. In every case, from the observation of the symmetry (along the zero covariance line) of the Bcc plot we were able to show the existence of a complex.
Note that in the above simulations all pixels of the image were equivalent, and within the same pixel, we have contributions from complexes with different stoichiometry. In this situation, we determine the average brightness and covariance (Bcc plots) in each pixel (B1 and B2 plots). If we have regions in which complexes of different stoichiometry appear in one image, then we should be able to separate these regions and quantify the stoichiometry of the complex in each region. It is a crucial feature of this analysis method that we can localize the regions of the cell where the complexes form and map the stoichiometry.
Complexes of Different Stoichiometry in Different Parts of an Image.
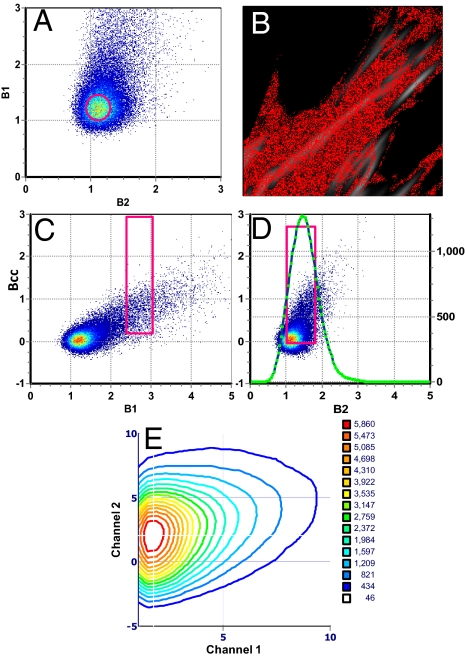
In the following example, we illustrate our method by determining the composition of complexes in different parts of an image. We analyze a cell coexpressing Vn-EGFP and Pax-mCherry (Fig. 2). For this sample, we produce the B1–B2 plot (Fig. 2A). In this plot, we select the region of maximal population (circle of Fig. 2A). This region maps to pixels in the cytoplasm rather than at the adhesions (Fig. 2B). We identify the brightness of this region with the brightness of the monomers separately in both channels. This information is crucial for the correct calibration of the brightness scale. In this case, earlier measurements based on the ccRICS method showed that the two proteins are not correlated in the cytoplasm, but rather they freely diffuse as monomeric species.
Fig. 2.
Cell expressing Vn-EGFP and Pax-mCherry. (A) B1–B2 plot showing the cluster of brightness corresponding to monomers, selected in B by the red circle. (C and D) Bcc plots showing a region of brightness with positive cross-variance selected by the rectangular cursor. The coordinates of the cursor are x = 2.71 and y = 1.56. The Bcc1 plot is explored for positive correlations. The green line in D shows the number of pixels with a given value of brightness as selected for B1 and for all positive values of B2. The operation is repeated for all locations in the Bcc1 plot. The green lines are then transferred to a contour plot that shows the number of pixels with a given composition. In the horizontal and vertical axis of the contour plot, we plot brightness of channel 1 and channel 2, respectively, in unit of monomer brightness. In the z axis, each contour corresponds to the number of pixels that have a give pair of values of B1 and B2. (E) The most populated region is centered at 1.77 Vin and 2.22 Pax. All cell images have a size of 20.5 μm2 (20.5 μm × 20.5 μm).
The B1–B2 plot gives all of the possible brightness found in the image. However, this plot does not distinguish whether the two brightnesses were there at the same time. To establish the correlation between the fluctuations, we need the cross-variance plot. In this plot, pixels with uncorrelated fluctuations are close to the horizontal axis, whereas the correlated particles give pixels with positive cross-variance. By systematically exploring the positive part of the covariance plot, for every pixel value of B1 (and positive cross-variance), we find the corresponding value of B2. This is done by using a coincidence analysis algorithm. The density of pixels with a given value of correlated B1 and B2 could be plotted in a contour plot (or any other kind of 3D plot) to identify population of pixels with a given stoichiometry. However, instead of finding the coincidence for each individual pixel, we analyze a region of pixels selected by the square selector in the Bcc–B1 plot (Fig. 2C). This process “smoothes” the contour plot because a region of values is analyzed at a time. The width (in the x axis) of the selector determines how many pixels are analyzed simultaneously. In the vertical direction, we always use the entire positive cross-variance values. The height of a point in the vertical axis is proportional to the square of the product of the fluctuations that occur simultaneously in both channels. In principle, we could select values of the cross-variance above a given limit, which will correspond to large coincident fluctuations in the two channels. However, in this work, we only selected positive values of the cross-variance. The contour plot lines indicate the number of pixels that are correlated. Because we use a relatively large region of the Bcc plot, this number is on the order of 1,000 or more. The green line in Fig. 2D shows one particular coincidence analysis for the region selected in the Bcc–B1 plot and for all possible regions in the Bcc–B2. For this example, the green line in Fig. 2D has a peak value of ≈1,000. Then another region of the Bcc–B1 plot is chosen, and another green line is obtained.
We use a contour plot (Fig. 2E) to display the number of pixels (in the image) that have a given combination of brightness for the two channels, namely this contour plot is the combination of all of the green lines. The procedure is fully automatic and requires no fitting or a priori assumptions about the composition of the complex. The analysis is based on a systematic mapping of regions of the image that show different combinations of brightness for the two channels.
We must remember that to obtain the true molecular brightness in units of counts per second per molecule, we must subtract 1 for the value of B and then divide this difference by the pixel dwell time (3). For example a value of brightness B1 = 1.125 with a pixel dwell time of 12.5 μs corresponds to a molecular brightness ε = (1.125 − 1)/12.5 μs = 10,000 counts per second per molecule. This operation is done automatically during the construction of the contour plot because we know the value of the brightness of the monomers. The contour plot units are expressed in multiples of the monomer values for the two channels.
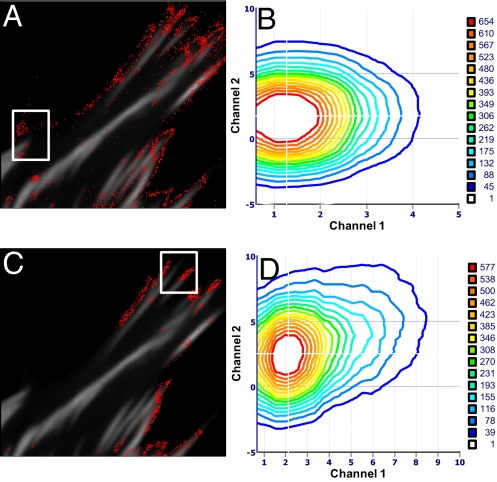
The contour plot in Fig. 2E represents the average stoichiometry. If we want to determine the stoichiometry in only one part of the cell, we can choose a region of interest in the image as shown in Fig. 3 A and B. Then we can repeat the analysis only in that region. For example Fig. 3 B and D shows regions of the cell where the stoichiometry of the complexes is different.
Fig. 3.
Cell expressing Vn-EGFP and Pax-mCherry. (A and C) For a chosen region of interest, the pixels that have a given value of the brightness in each channel are counted. (B and D) Contour plots (in monomer brightness units) show the combinations of brightness that give more pixels in the region of interest, which is at 2.05 Vn and 2.68 Pax (B) and 2.5 Vn and 3.3 Pax (C).
The B1–B2 plot, the Bcc plots, and the contour plots are based on counting pixels with a given brightness and cross-variance. In each pixel we could have a different number of molecules. To convert the pixel count into a molecule count, we need to use the number of molecules of the two colors in each pixel, which is obtained by using the number map as described in ref. 3 or Eq. 5 (data not shown).
Results
Cell Expressing FAK-EGFP and Pax-mCherry.
B1–B2 histogram plot.
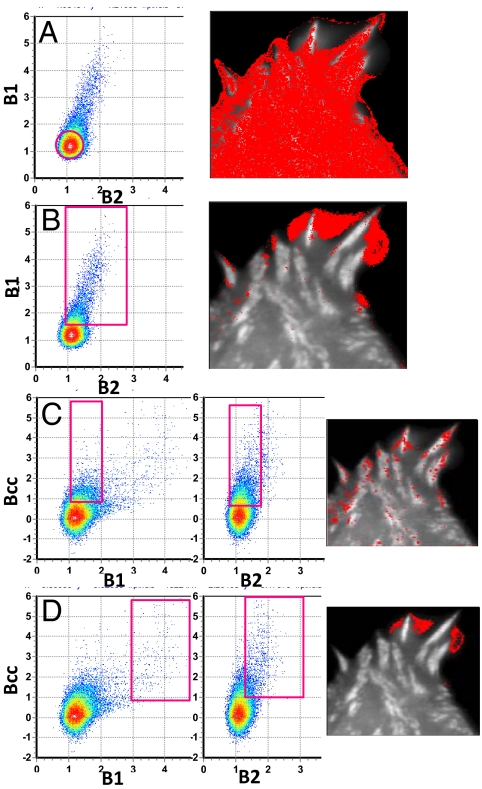
The B1-B2 plot for a cell expressing FAK-EGFP and Pax-mCherry is shown in Fig. 4A and B. This plot gives a region of points centered at position B1 (1.210) and B2 (1.084) and encompasses the majority of the pixels in the cytoplasm (colored red in Fig. 4A). We interpret this region of the B1–B2 histogram as representing monomers in both channels. By using a 12.5-μs pixel dwell time we calculated the molecular brightness ε of the monomers to be 17,200 counts per second per molecule for the green channel and 6,740 counts per second per molecule for the red channel, respectively. The brightness value depends on the laser power and the combination of filters used. For this measurement, the nominal laser power was 1% (according to the Olympus slider) for both channels. For each sample, we measured the position of this relatively symmetric region of the B1–B2 plot to calibrate the monomer brightness, and we will refer to multiples of these brightness values to indicate how many (on the average) molecules of each color are in the complexes. By using this procedure, each sample has its own internal brightness standard. The region of pixels selected by the rectangle and highlighted in red in the image shown in Fig. 4B corresponds to an area in which there is a large retraction event. This event lasted ≈20 s. The apparent brightness in this region was very high. The selection of the pixel histogram in this region of high brightness shows where the brightest pixels in the image are located (colored red in Fig. 4B). The B1–B2 plot does not provide information about the interaction of the two proteins. To detect complexes with a given stoichiometry, we must use the Bcc plot.
Fig. 4.
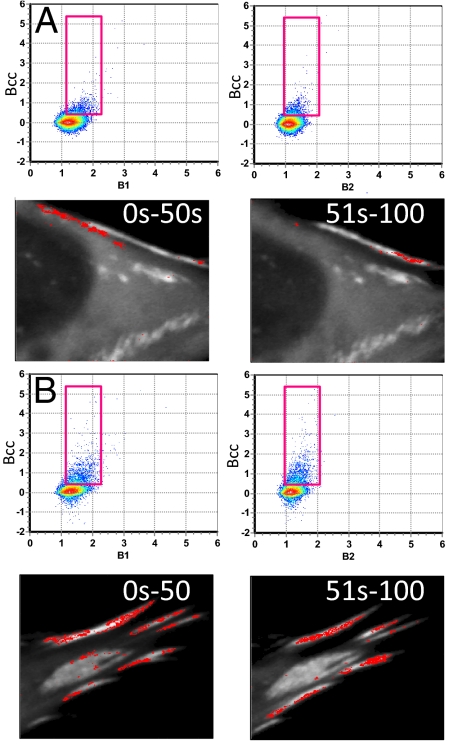
Cell tagged with FAK-EGFP and Pax-mCherry. (A and B) B1–B2 plots. Selecting points in the red circle (Left) highlight pixels in the image at the Right. (A) Selection corresponds to monomers. (B) Selection corresponds to large aggregates. (C and D) Simultaneous selection in the Bcc plots in the regions indicated by the rectangles. (C) Brightness of 2.5 FAK and 3.6 Pax. (D) Brightness is in the range of 15–20 for FAK and 10–15 for Pax.
Bcc histogram plot.
Fig. 4 C and D shows the Bcc1 and Bcc2 plots. The simultaneous selection of different pixel clusters from these plots (rectangular regions of Fig. 4 C and D) shows that there are two families of complexes that have a large positive cross-variance. One region, with brightness of ≈2.5 FAK monomers and 3.5 Pax monomers corresponds to specific spots (pixels) on the adhesions (Fig. 4C). The second region, with much larger brightness (as shown by the position of the rectangular regions in Fig. 4D, which is approximately at 15–20 FAK and 10–15 Pax), corresponds to regions in the cell between the adhesions where the cell was retracting (Fig. 4D). We believe that the large variance (large brightness) in this region is caused by collective macroscopic motion rather than single complex fluctuations. As a matter of fact, the analysis shown in Fig. 4 was obtained by using the first 50 frames of the 100 frames record, when this event occurred. If we use the second 50 frames or filter the low frequencies from the images by using the moving average method, this macroscopic event disappears, whereas the events related to molecular complex fluctuations at the adhesions remain. Fig. 5 shows the same kind of analysis for another cell. For this cell, there is only one stoichiometry with ≈3.4 FAK and 6.4 Pax. The fluctuations occur at very well-defined spots on the adhesions. This region was not retracting.
Fig. 5.
Cell tagged with FAK-EGFP and Pax-mCherry. (A and B) Two different parts of the same cell. The selection in the Bcc plots is for 3.4 FAK and 6.2 Pax. The images correspond to the brightness calculated for 0–50 s and 51–100 s.
Cell Expressing Vn-EGFP and Pax-mCherry.
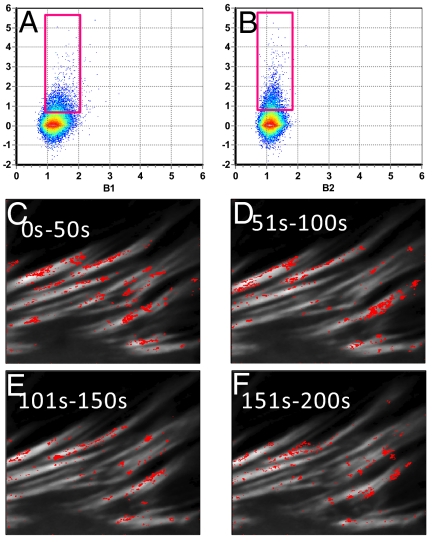
Fig. 6 shows the Bcc plots for two cells expressing Vn-EGFP and Pax-mCherry. The selection (position of the rectangular cursor) corresponds to an average stoichiometry of ≈2.45 Vn and 2.25 Pax. Complexes with this stoichiometry appear in particular regions on the adhesions. In Fig. 7 we show that selecting a region of the Bcc plot corresponding to greater brightness for both colors selects pixels either at the adhesion borders or outside the adhesions. Analysis of other cells (data not shown) reveals essentially the same pattern, with regions on the adhesions selected by stoichiometry in the range 2–3 Vn and 2–3 Pax, whereas brighter aggregates are at the adhesion borders or in the cytoplasm close to the adhesions. We have not observed any large aggregates in the general cytoplasm far from the adhesions.
Fig. 6.
Cell tagged with Vn-EGFP and Pax-mCherry. (A and B) Brightness in the range 2.45:2.25 for Vn and Pax respectively, selects pixels on the adhesions. (C–F) Time evolution of the complexes leaving the adhesions. Each panel corresponds to the average of 50 s.
Fig. 7.
Cell tagged with Vn-EGFP and Pax-mCherry. (A) Large brightness (15 Vn and 15 Pax) selects aggregates close to but not on the adhesions. (B) Brightness in the range 2.45 Vn and 2.25 Pax selects pixels on the adhesions. Images for A and B correspond to a time average of 0–50 s and 51–100 s, respectively.
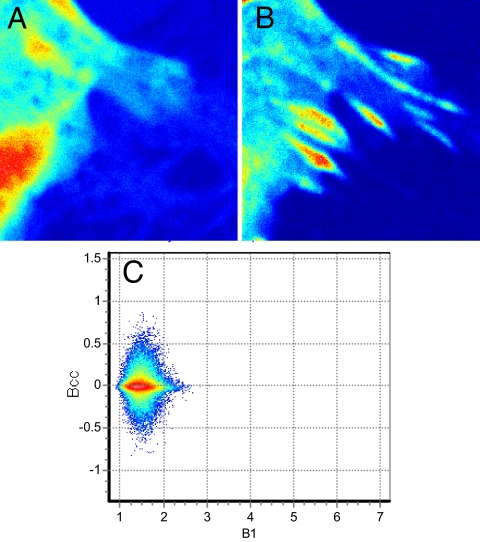
As a control, we present (Fig. 8) the analysis of a cell expressing a FAK mutant, I937E/I999E, that neither binds to paxillin through its FAT domain (9) nor localizes in adhesions. Accordingly, the FAK mutant labeled with EGFP does not concentrate in adhesions, whereas Pax-mCherry does in expressing cells. As shown in Fig. 8, the cross-variance analysis of a cell expressing a mutant of FAK-EGFP and Pax-mCherry has a symmetric Bcc plot.
Fig. 8.
Cell expressing (A) Mutant FAK-EGFP I937E/I999E and (B) Pax-mCherry shows a symmetric Bcc plot (C), although the cell forms adhesion.
Discussion
The most striking result from the two-color N&B analysis is the precise location of pixels with positive covariance. Our previous measurements with cross-correlation RICS showed that the fast-diffusing molecular species in the cytoplasm were uncorrelated (2). However, in these experiments we were able to detect slower events that we attribute to unbinding of preformed complexes from the adhesions. The ccRICS method has limited spatial resolution, and we were only able to conclude that the cross-correlation signal was larger in the regions where adhesions were disassembling without resolving the exact location of the cross-correlation. With the two-color N&B approach, we can exactly pinpoint where the correlated fluctuations occur. Also with the two-color N&B covariance analysis, we have not observed correlation in the general cytoplasm, in accord with our previous observations with the ccRICS technique. Instead, we can show that the cross-correlated fluctuations arise at specific locations and times in adhesions. When we analyzed the average intensity changes at the locations where we observed cross-variance (data not shown), we found that they corresponded to points of decreasing fluorescence intensity on the adhesion. This indicates that the adhesions are disassembling at these locations by releasing relative large complexes. Because there is endogenous protein, we can only determine the relative, rather than the absolute, stoichiometry. However, the tagged proteins are expressed at levels of ≈1–3× over that of the endogenous, suggesting that our values are not far from those of the endogenous (10). The absence of cross-correlation in the cytoplasm and cross-variance at the adhesions indicates that proteins bind as individual units at the adhesions and that the assembling adhesion itself is the scaffold for the assembly of the incoming proteins.
These measurements are sensitive to light and microscope settings, FRET, photobleaching, and cell movement. Although for each cell the brightness of the monomers could slightly change because of some necessary adjustments of the laser power to bring the signal to a level that it could be observed, for each experiment we measure a large number of pixels (outside the adhesions) that correspond to molecular species that we interpret as being monomers. Therefore, every experiment has its own internal calibration, and all brightness values are quantified relative to this monomeric baseline. FRET will also affect the brightness because intensity will be lost from the donor and appear in the acceptor. We performed experiments by using the FLIM technique (data not shown) to determine whether there was any FRET at the adhesions. For all sample examined, we never observed FRET, indicating that in the complex, the proteins must be at a distance larger than the Forster radius.
Although some photobleaching is present in our measurements, it is quite difficult to filter the slow variation caused by photobleaching to separate it from any slow binding–unbinding processes. We performed a series of tests by filtering the data at each pixel with a moving average filter of different lengths. If we select only the fast fluctuations, the cross-correlated signal tends to decrease, in accordance with our previous observation by using ccRICS that the only cross-correlated events are the slow events. However, even with a moving average where all of the slow fluctuations are filtered out, we still see the same pattern in which specific points at the adhesions show sudden changes in intensity.
Another possible source of artifact is cell movement. The moving average algorithm described for the RICS method was also applied to this dataset. The cell in Fig. 4, for example, had a rapidly retracting region. The apparent brightness associated with this region of the cell is very large. The filtering procedure, by using a moving average of 10 frames, removed this event (data not shown).
Conclusions
The cross-variance N&B analysis shows that complexes containing FAK, Vn, and Pax are only observed at or very near the adhesions. There are no preassembled complexes in the cytoplasm. During adhesion disassembly, we can observe the hole left by the departing complex and determine the stoichiometry of what was at the adhesions. The multimeric pieces that are coming off the adhesions are relatively large, containing at least 10–15 fluorescent proteins (in addition to other nonfluorescent protein molecules). We were able to observe relatively large particles only close to the adhesions. This could be caused by the very short lifetime of the complexes that may disassemble (2) shortly after leaving the adhesion. Perhaps, only the very large protein assemblies survive long enough to be observed at some small distance from the adhesions. The method we describe in this work is of general applicability to complexes of molecules carrying two (or more) colors. It reveals the presence and the stoichiometry of complexes of small and large size at pixel resolution and fulfills a major need in cell biology.
Materials and Methods
Cell Culture and Protein Transfection.
Mouse embryonic fibroblasts were cultured at 37 °C in a 5% CO2 humidified incubator. After trypsinization, cells were subcultured and transferred from a 35-mm tissue culture flask to a 25-mm, 6-well Falcon tissue culture (Becton-Dickinson). Cells were then grown to 50–80% confluence, transfected with 1 μg of DNA (0.5 μg of DNA per protein for cotransfections) and 5 μg of Lipofectamine 2000 (Invitrogen). Vn, FAK, the FAK mutant I937E/I999E, and Pax cDNA were ligated to EGFP or mCherry at the C terminus (7) as described. After 24 h of transfection, cells were plated by using high-glucose DMEM supplemented with 10% FBS and penicillin/streptomycin (Hyclone) on MatTek imaging dishes coated with 3 μg of fibronectin from Sigma–Aldrich 1 h before imaging.
Microscopy.
We used an Olympus FV1000 microscope with a 60 × 1.2 NA water objective (Olympus). The scan speed was set at 12.5 μs per pixel. The scan area was 256 × 256 pixels, and ≈100–200 frames were collected for each sample. The corresponding line time was 4.325 ms, and the frame time was 1.15 s. The electronic zoom of the microscope was set to 16.3, which corresponds to a region of 12.8 μm2. For the EGFP excitation, we used the 488-nm line of the argon ion laser, and for the mCherry excitation we used the 559-nm laser excitation. The power of the 488-nm laser was set between 0.5 and 1% according to the power slider in the FV1000 microscope. The power of the red laser was then changed to match the average intensity in the two channels. Generally, the power in the red channel was <1.5%. Data were collected in the pseudo-photon counting mode of the Olympus FV1000 microscope. The filters for the green and red emission channels have a nominal bandwidth of 505–540 nm and 575–675 nm, respectively. The overlap of the volume of observation and excitation at the two colors of our experiments was tested by imaging single 100-nm fluorescent beads carrying two colors simultaneously (yellow-green fluorospheres; Invitrogen). We imaged single immobilized beads by using a z-stack with images acquired every 500 nm in the z direction. We found that in the FV1000 microscope the center of mass of the excitation volumes was coincident within 20 nm in the x and y directions and within ≈40 nm in the z direction in both channels.
Cross-NB Analysis.
We used the SimFCS program (Laboratory for Fluorescence Dynamics) for the cross-variance analysis. For the N&B analysis, data were collected in the 256- × 256-frame format. The slowly varying signals were removed from the calculation by using a high-pass filter operation as described in ref. 11. The factor S (digital levels per photon) was calibrated according to the procedures described in ref. 8 and it was found to be 2.75.
Acknowledgments.
We thank Jenny Sasaki for cultivating and for transfection of the mouse embryonic fibroblasts. This work was supported in part by Cell Migration Consortium Grant U54 GM064346 (to M.A.D., C.C., A.R.H. and E.G.), National Institutes of Health Grants P41 P41-RR03155 (to E.G.) and P50-GM076516 (to E.G.), and by the Natural Sciences and Engineering Research Council of Canada and the Canadian Institutes of Health Research (P.W.W.).
Footnotes
The authors declare no conflict of interest.
This article is a PNAS Direct Submission.
References
- 1.Ridley AJ, et al. Cell migration: Integrating signals from front to back. Science. 2003;302:1704–1709. doi: 10.1126/science.1092053. [DOI] [PubMed] [Google Scholar]
- 2.Digman MA, Wiseman P, Hortwitz AR, Gratton E. Detecting protein complexes in living cells from laser scanning confocal image sequences by the ccRICS method. Biophys J. 2009;96:1–10. doi: 10.1016/j.bpj.2008.09.051. [DOI] [PMC free article] [PubMed] [Google Scholar]
- 3.Digman MA, Dalal R, Horwitz AF, Gratton E. Mapping the number of molecules and brightness in the laser scanning microscope. Biophys J. 2008;94:2320–2332. doi: 10.1529/biophysj.107.114645. [DOI] [PMC free article] [PubMed] [Google Scholar]
- 4.Chen Y, Muller JD, So PT, Gratton E. The photon counting histogram in fluorescence fluctuation spectroscopy. Biophys J. 1999;77:553–567. doi: 10.1016/S0006-3495(99)76912-2. [DOI] [PMC free article] [PubMed] [Google Scholar]
- 5.Zaidel-Bar R, Itzkovitz S, Ma'ayan A, Iyengar R, Geiger B. Functional atlas of the integrin adhesome. Nat Cell Biol. 2007;9:858–867. doi: 10.1038/ncb0807-858. [DOI] [PMC free article] [PubMed] [Google Scholar]
- 6.Schwartz MA, Ginsberg MH. Networks and cross-talk: Integrin signalling spreads. Nat Cell Biol. 2002;4:E65–E68. doi: 10.1038/ncb0402-e65. [DOI] [PubMed] [Google Scholar]
- 7.Choi CK, et al. Actin and α-actinin orchestrate the assembly and maturation of nascent adhesions in a myosin II motor-independent manner. Nat Cell Biol. 2008;10:1039–1050. doi: 10.1038/ncb1763. [DOI] [PMC free article] [PubMed] [Google Scholar]
- 8.Dalal RB, Digman MA, Horwitz AF, Vetri V, Gratton E. Determination of particle number and brightness using a laser scanning confocal microscope operating in the analog mode. Microsc Res Tech. 2008;71:69–81. doi: 10.1002/jemt.20526. [DOI] [PubMed] [Google Scholar]
- 9.Hayashi I, Vuori K, Liddington RC. The focal adhesion targeting (FAT) region of focal adhesion kinase is a four-helix bundle that binds paxillin. Nat Struct Biol. 2002;9:101–106. doi: 10.1038/nsb755. [DOI] [PubMed] [Google Scholar]
- 10.Webb DJ, et al. FAK-Src signalling through paxillin, ERK and MLCK regulates adhesion disassembly. Nat Cell Biol. 2004;6:154–161. doi: 10.1038/ncb1094. [DOI] [PubMed] [Google Scholar]
- 11.Digman MA, et al. Measuring fast dynamics in solutions and cells with a laser scanning microscope. Biophys J. 2005;89:1317–1327. doi: 10.1529/biophysj.105.062836. [DOI] [PMC free article] [PubMed] [Google Scholar]


