Abstract
In this review, we summarize original methods for the extraction of quantitative information from confocal images of gene-expression patterns. These methods include image segmentation, the extraction of quantitative numerical data on gene expression, and the removal of background signal and spatial registration. Finally, it is possible to construct a spatiotemporal atlas of gene expression from individual images recorded at each developmental stage. Initially all methods were developed to extract quantitative numerical information from confocal images of segmentation gene expression in Drosophila melanogaster. The application of these methods to Drosophila images makes it possible to reveal new mechanisms in the formation of segmentation gene expression domains, as well as to construct a quantitative atlas of segmentation gene expression. Most image processing procedures can be easily adapted to process a wide range of biological images.
Keywords: methods of image processing, confocal microscopy, quantitative gene expression, image segmentation, spatial registration, background removal
Progress in the molecular genetics of eukaryotes has advanced the sequencing of gene coding regions and the recognition of their regulatory regions with promoters, enhancers, and sites for the binding of transcription factors, as well as the identification of the transcription factors that bind to these regions. These genetic elements, together with mRNA and protein products, produce the gene regulatory networks. The networks coordinate the gene expression that is responsible for cell specificity, tissue differentiation, and, finally, for ontogenesis.
To gain greater insight into the principles of the organization, functioning, and evolution of regulatory networks, it is necessary to provide a detailed quantitative description for the dynamics of each component. Thus, the functional genomics technique is widely used for the quantitative evaluation of gene expression (Banerjee et al., 2002). The method of fluorescence restoration after photobleaching (FRAP) is applied for the estimation of the rate of molecule diffusion or transport inside the cells (Shav-Tal, 2006).
It should be noted that DNA microarrays, as well as other methods for the quantitative evaluation of gene expression (quantitative PCR, CAT assays) with high resolution, are of limited applicability for the study of the development process. These techniques are performed on cell homogenates; therefore, the information on spatial gene expression is lost.
Cell determination and pattern formation during early embryogenesis take place in relatively small morphogenetic fields in which slight differences in the spatial expression of a few genes precedes the cell’s diversity (Gilbert, 2003). In Drosophila, segment determination takes place in morphogenetic fields with lengths of less than 0.3 mm along the anteroposterior embryo axis; at the syncytial balstoderm stage, it corresponds to a region of the presumptive germ band. It follows from this that the study of the determination mechanisms requires detailed information on spatiotemporal gene expression in situ.
Various methods are currently available for the identification of gene expression in both mRNA and protein levels in living and fixed biological objects. The general technique used to detect biological macromolecules is immunofluorescent labeling. This method is highly specific, as it is based on the interactions of antibodies labeled with fluorescent dyes with the appropriate antigens. It is widely used to detect and localize antigens in fixed cells and tissues. Cell and tissue signals are registered by fluorescent microscopy with laser and confocal scanning microscopes. The advantages of a confocal microscope lie in the detection of signals from the focal plane only; fluorescence from nearby layers of the object examined is not recorded. As a result, images are of a higher contrast and are less blurred. In addition, confocal microscopy provides high-quality digital images ready for further computer processing.
Confocal microscopy has wide applications; profit and nonprofit approaches to processing of confocal images has come to be in great demand. Here, we present a survey of techniques we have developed to process confocal images of expression pattern of segmentation genes in the fruit fly Drosophila (Kozlov et al., 2000, 2002; Myasnikova et al., 2001a, 2001b, 2005; Janssens et al., 2005). These methods are aimed at acquiring quantitative data on the expression of these genes and constructing a general atlas of gene expression. Finally, it will be possible to reconstruct the total spatiotemporal gene expression of a particular gene network with an accuracy of a single cell. Most procedures are universal and can be applied with slight modifications for acquiring quantitative data from image patterns of gene expression in other organisms. These methods are described in sufficient detail for the reader to consider their applicability to the other objects. The reader may also become acquainted with detailed information on processing algorithms in the original publications.
Methods for the Acquisition of Confocal Images
Experimental data
An indirect immunofluorescence technique was used to acquire information on gene expression (Dequin et al., 1984; Frasch et al., 1987). About 1600 embryos of Drosophila melanogaster Oregon-R were fixed and incubated with primary antibodies to proteins encoded by the following genes that control segmentation in Drosophila: bicoid (bcd) and caudal (cad) maternal genes; Kruppel (Kr), knirps (kni), giant (gt), hunchback (hb), and tailless (tll) gap genes; and even-skipped (eve), fushi tarazu (ftz), hairy (h), runt (run), odd-skipped (odd), paired (prd), and sloppy-paired (slp) pair-rule genes. All antibodies were obtained in our experiments (Kosman et al., 1998) except for antibodies to the Eve protein (Azpiazu and Frasch, 1993). Secondary antibodies were conjugated with FITC; Texas Red; Cy5 (Jackson Labs, USA); or Alexa Fluor 488, 555, 647, or 700 (Molecular Probes, USA) (Janssens et al., 2005).
Each embryo was labeled for the expression of eve and two other segmentation genes. About half of the embryos were labeled with histone-specific antibodies (Janssens et al., 2005). The age of embryos ranged from cleavage stage 10 to the beginning of gastrulation. Only embryos with lateral orientations were used for scanning.
Confocal microscopy was performed as previously described (Kosman et al., 1997; Janssens et al., 2005;Myasnikova et al., 2005). Embryos were scanned using a Leica TCS4D confocal microscope with an immersion objective of 16×/0.50 (Kosman et al., 1997) or 20×/0.70 Plan Apo Leica TCS SP2 system (Janssens et al., 2005). For every four microscope channels, two optical sections at distances of 1 μm were scanned for each embryo. To reduce the level of noise in the recorded signals, every two optical sections were scanned 16 times and the resulting images were averaged. Thus, each pixel of a particular image recorded in one channel is an averaged value from 32 measurements. In total, 3 resultant images (one per channel) were obtained for each embryo. The size of the images was 1024 × 1024 pixels; a signal was recorded in 8-bit format. Confocal microscope options “gain” and “offset” were adjusted to have pixel values of 0 outside of the embryos and 255 as the most bright. Pixels with maximal brightness were selected as specific patterns of gene expression related to the stage of development with the maximal intensity of that particular segmentation gene. Thus, an experienced researcher is able to find in a slide an embryo for each gene with the expression pattern of maximal intensity and to operate the brightest pixels of the pattern to adjust the photomultiplier settings. It is obvious that adjustment makes it possible to estimate quite precisely the quantitative (in relative units) expression of a specific gene, though not to compare the expression of different genes.
Temporal classification of embryos
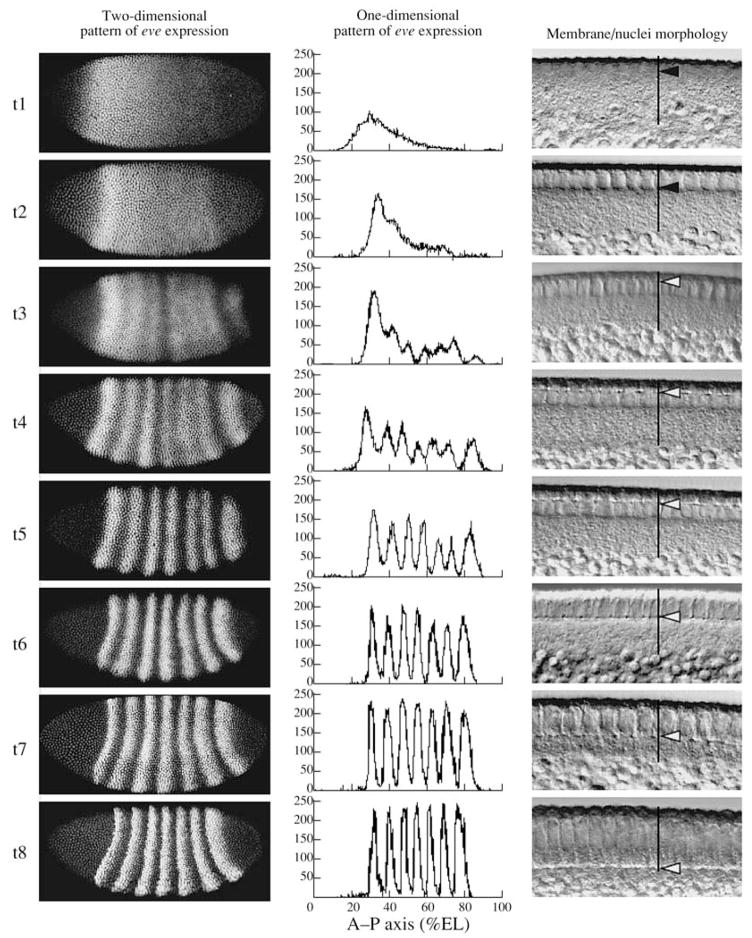
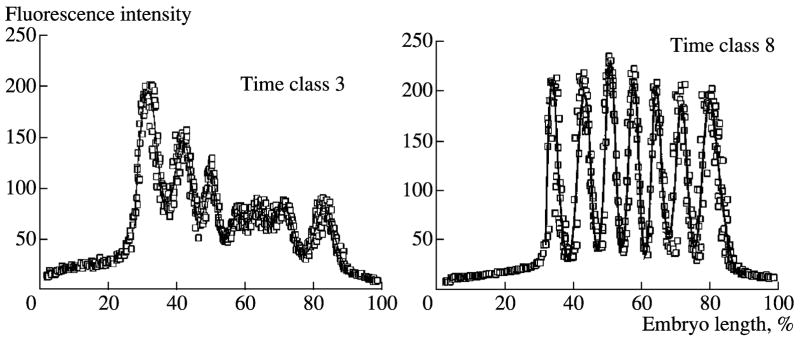
To reconstruct the temporal dynamics of gene expression based on individual fixed embryos, it was necessary to rank the embryos by age. Cleavage cycles 10–13 were identified by counting nuclei in text files containing quantitative data on expression obtained by image segmentation (see next section). As the interphases in these cycles last only 6–14 min, it is sufficient to make a temporal scale for this period. Cycle 14A is much longer at 50 min; therefore, the embryos inside the cycle are divided in 8 temporal classes equivalent in age based on the dynamics of eve gene expression (Fig. 1).
Fig. 1.
8 temporal equivalence classes of cycle 14A. A typical embryo of each class is shown in each row. Left panel shows an image of eve expression in that embryo; middle panel shows segmented expression pattern from the central 10% strip; right panel shows a high-magnification differential interference contrast (DIC) image of blastoderm morphology. In DIC images, vertical black lines indicate the cortical cytoplasm; black arrows in time classes 1 and 2 indicate nuclei elongation; white arrows in time classes 3–8 show position of membrane front. All images have the same anterior–posterior (A–P) orientation.
A practical criterion for the adequacy in age of the temporal class is the inability of an experienced observer to distinguish expression patterns of embryos that belong to a particular class. Because embryos were scanned without taking into consideration their age and all 8 temporal classes have approximately an equal number of embryos, it is reasonable to assume uniform age distribution in samples of the 14A cycle and to consider the duration of each temporal class to be 6.5 min of the development (Myasnikova et al., 2001, Surkova et al., 2008).
Figure 1 shows that embryo ranking based on the analysis of the eve gene expression pattern is in a good agreement with a morphological marker, i.e., the degree of membrane invagination, used for the determination of embryo age. In temporal class 1, embryo nuclei are round; in class 2, nuclei are elongated; membrane invagination begins in temporal class 3 and is completed at the end of the 14A cycle. Data on blastoderm morphology were obtained for 120 embryos by differential–interferential contrast (DIC) with a Leica TCS4D and for all embryos with a Leica TCS SP2 (Fig. 1).
Orientation of embryos, one-dimensional expression patterns
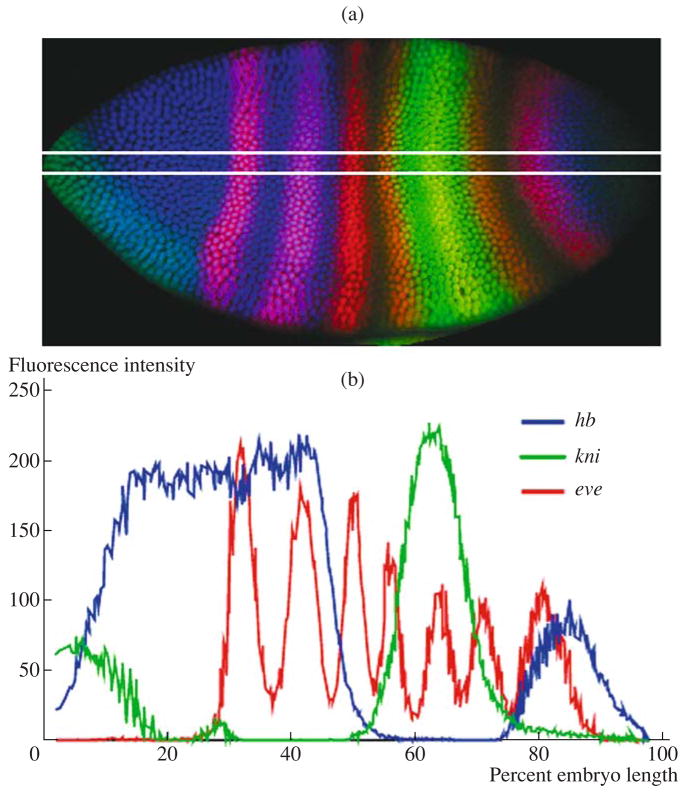
Images of eve gene expression patterns (Fig. 1, left row) were oriented relative to the anterior–posterior (A–P) and dorsal–ventral (D–V) axes so that anterior embryo part was on the left and dorsal part was at the top. For the acquisition of one-dimensional data on gene expression (Fig. 1, central row; Fig. 2), only the nucleus coordinates from the central 10% strip (45–55%) along the D–V axis (y axis) cut in the A–P direction (x axis) (Fig. 2b) were considered. Thus, each nucleus only had an x coordinate; the y coordinate was thrown away. Patterns are presented as graphs showing changes in gene expression along the x axis.
Fig. 2.
Extraction of one-dimensional quantitative data from images of segmentation gene expression patterns in Drosophila. (a) Drosophila embryo from cleavage cycle 14A stained for expression of hb, kni, and eve. White lines demarcate the central 10% strip; (b) one-dimensional expression patterns of genes shown in (a).
Access to data
All images and quantitative data are stored in a FlyEx database (http://urchin.spbcas.ru/flyex/; http://flyex.ams.sunysb.edu/FlyEx/) available on the Internet (Poustelnikova et al., 2004).
Methods of Image Processing
1. Image segmentation
To study the dynamics of pattern formation, detailed information is required on the temporal and spatial expression of all regulators of the morphogenetic field where the processes take place. Available commercial software (e.g. VisiQuest, Accusoft Corp., USA and MatLab, MathWorks, USA) and their free analogues (SCIRun, USA and TiViPe, Japan) are not always sufficient for the quantitative evaluation of spatial gene expression. The method of segmentation is based on confocal images of gene expression patterns in Drosophila embryos (Janssens et al., 2005). The method makes it possible not only to separate the analyzed objects (nuclei) simultaneously in several images recorded in distinct microscope channels, but also to acquire quantitative information on gene expression in the form of text tables. For the acquisition of quantitative data on gene expression in every nucleus of Drosophila embryo, it is necessary to do the following: (1) to put experimental images into the standard orientation (see previous section); (2) to mark the zone occupied by the object and to cut off blank regions along the edges; (3) to construct a “nuclear mask,” i.e., binary image, where only pixels related to the embryo nuclei are “switched on”; (4) to calculate nuclear centroid coordinates and the average fluorescence intensity in individual nuclei for each microscope channel, i.e., for every scanning protein (Janssens et al., 2005; Kosman et al., 1997). Most of the techniques described above are standard and can be applied to treat images from other objects.
Image adjustment to the standard orientation
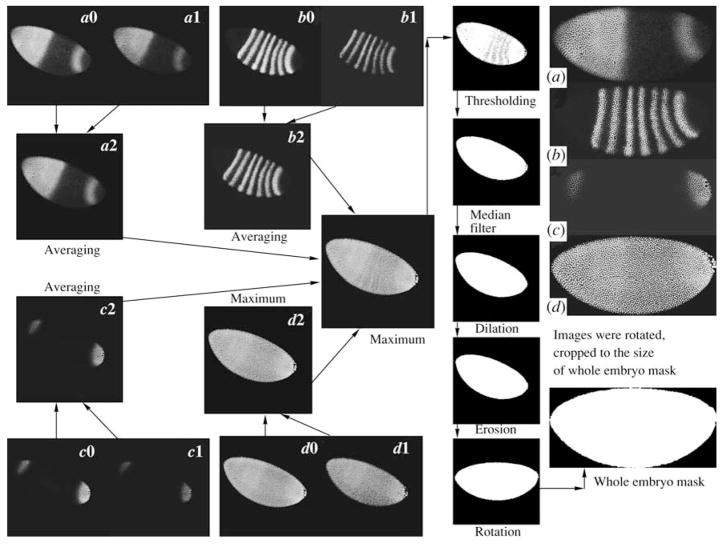
First, one image for each of the three gene products registered in one embryo is constructed by averaging two optical sections (Fig. 3). It is necessary to provide a high level of signals in a maximal number of nuclei, including nuclei located on the edges of the embryo. The pixel’s maximum is generated for images of histone proteins used as a nuclear marker (Fig. 3). The enhancement of the signal facilitates the quality of the nuclear mask, which is constructed during the subsequent stages of the procedure (Figs. 5, 6).
Fig. 3.
Preprocessing of the confocal images of Drosophila embryos. (a0, a1, b0, b1, c0, c1) individual z sections of gene expression patterns a, b, c; (a2, b2, c2) images obtained by averaging of two x sections for each gene; (d0, d1) individual z sections for the expression patterns of the nuclear marker; (d2) pixel maximum image for these sections.
Fig. 5.
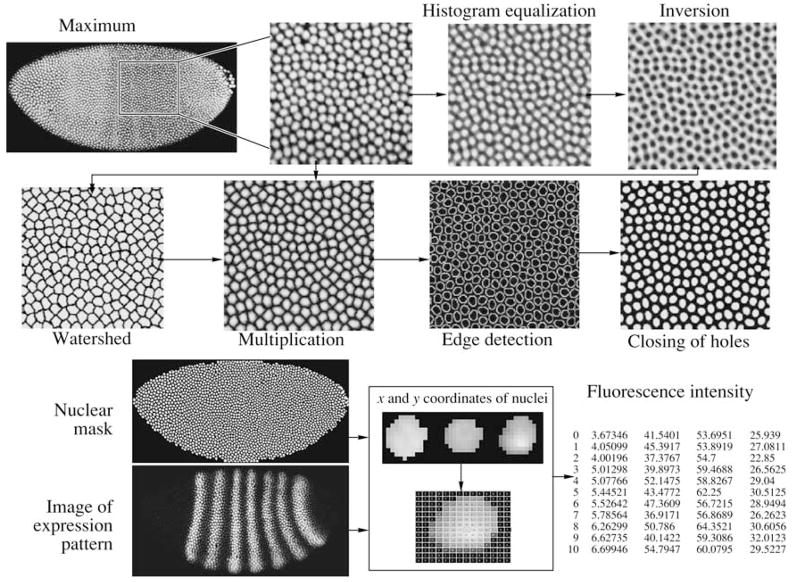
Acquisition of quantitative data on gene expression.
Fig. 6.
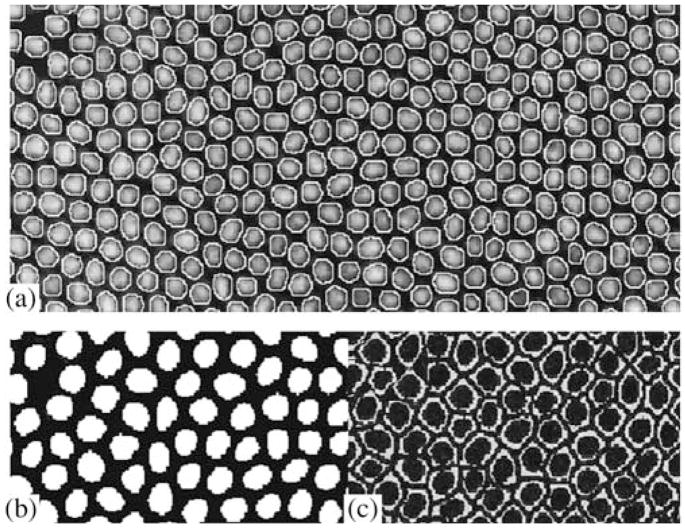
Quality control for quantitative data extraction. (a) Fragment of the nuclear mask image superimposed on the image obtained in the histone channel; (b, c) two classes of pixels: (b) inside nuclei, (c) inside watershed regions but outside nuclei.
To calculate the angle of embryo rotation into the standard orientation (see Section 1), as well as for the removal of nonzero pixels outside embryos, it is necessary to plot the primary (rough) mask of the total embryo. For this purpose, a pixel maximum from 4 images registered in distinct microscope channels is created. Then, the threshold and median filters, as well as several cycles of erosion and dilation follow (Gonzales and Woods, 2002 Gonzales and Woods, 2005) (Fig. 3). The entire embryo mask is a binary image with pixels related only to the area occupied by an embryo with a value of 1. The angle of rotation is calculated by mask moment invaants (Hu, 1962). The mask of the whole embryo and protein expression patterns in 4 channels are rotated at an angle and noninformative edge zones are discarded (Fig. 3). Resulting images of expression are cut according to the mask size (Kosman et al., 1997; Janssens et al., 2005).
Smooth mask construction
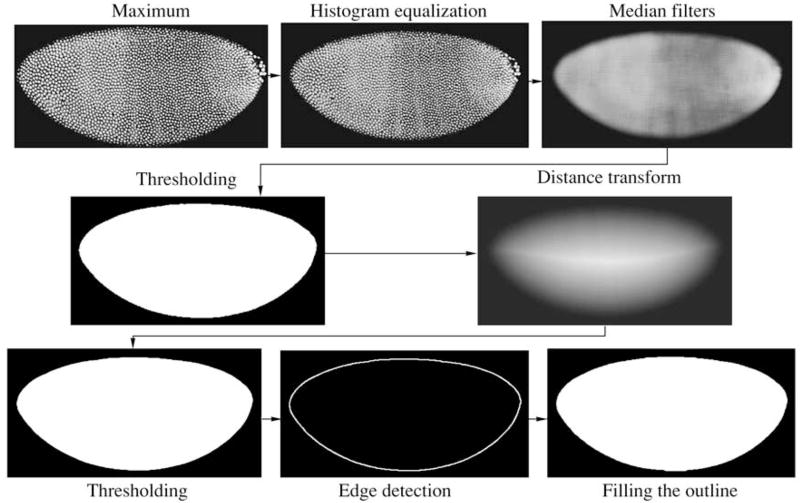
The final phase before image segmentation is the construction of a smooth mask that corresponds precisely to the embryo shape (Fig. 4). The procedure is performed after the rotation and cropping of the image because the structural elements employed are sensitive to the image’s orientation (Gonzales and Woods, 2002). First, a new image of the pixel maximum is constructed based on preliminarily rotated and cut images. Then, the equalization of the histogram for the enhancement of the maximal contrast and median filter for smoothing and noise reduction are applied to the resultant image. Finally, a binary image is obtained with a threshold filter. The application of Euclidean distance transformation to the binary image yields an image in grey scale where the value of every mask corresponds to its Euclidean distance from the border. Subsequent application of median and threshold filters generate a mask with contours resembling the natural embryo outlines. With the Shen–Castan (Shen and Castan, 1986) algorithm, the edge of the mask is delineated and, after its filling and erosion, the novel smooth mask of the entire embryo is generated (Fig. 4). Ultimately, images recorded in all microscope channels are cut according to the size of the novel smooth mask (Janssens et al., 2005).
Fig. 4.
Construction of smooth whole embryo mask.
Segmentation of images and acquisition of quantitative data
To acquire information on gene expression in every embryo nucleus, a so called “nuclear mask” is constructed based on histone protein-expression images (if available, see above) or the pixel maximum of the gene expression of the other three (Fig. 5). Local histogram equalization is applied to enhance the contrast and to define the borders of the nucleus (Gonzalez and Woods, 2002). Speckle noise is removed with Crimmins’ algorithm (Crimmins, 1985); several cycles of median filtrations facilitate the noise elimination. Then, a watershed transformation is applied to the image to invert the values of all pixels (Gonzalez and Woods, 2005). The watershed region is determined as the area occupied by a single nucleus and defined by a line of single-pixel width. Each watershed region is characterized by a particular value of the grey scale (Janssens et al., 2005). Application of the erosion and threshold filter transforms the image into a binary one with 0 values for the watershed borders (Fig. 5).
Binary image multiplied by the image of the pixel’s maximum or the histone protein image leads to each nucleus being separated from the neighboring nuclei by a border of zero pixels. The procedure allows us to separate the fused nuclei on images. Erosion with the following distance transformation (Vincent, 1993) and threshold filter remove unwanted non-nuclear stains from the mask. After edge detection and filling, the resulting mask is a binary image with the regions corresponding to nuclei given the value of 1. The quantity of the nuclear mask construction is usually controlled visually by its superimposing on the image from histone scanning or the pixel maximal image obtained in other microscope channels (Fig. 6a). In addition, we developed a numerical method of nuclear-mask control based on the assumption that the pixel intensity spread inside the nucleus is less than that between pixels inside and outside of the nucleus. The quantity of pixels inside and outside nuclei are considered as two classes (Figs. 6b and 6c, correspondingly).
The binary mask is used for the acquisition of quantitative data on gene expression. Centroid coordinates of every nucleus are calculated with moment invariants (Hu, 1962). Superimposing of a mask on images registered in each microscope channel allows us to calculate the average concentration of products of all scanned genes in every nucleus (Janssens et al., 2005). The ultimate result is the table with x and y coordinates of every nucleus in percentages of the embryo’s length and width, correspondingly, as well as the average fluorescence intensity (relative level of expression) for each scanned gene of a particular embryo (Fig. 5). The procedure developed for acquiring quantitative information from biological images is realized in ProStack (Processing of Stacks) software, which enables the visual construction of complex procedures for data and image processing (Matveeva et al., 2006).
2. Removal of background signal
It is well known that along with specific staining immunofluorescence technique produce nonspecific signals named background. Unspecific staining is caused by various factors but mostly by binding of primary and secondary antibodies (Fig. 7). Rough background removal can be performed for the particular image manually by setting the “offset” option on the confocal microscope. However, it is not easy in practice because (1) it is necessary to adjust the scanning mode for each particular image and (2) the intensity of a background signal may be spread unevenly within a biological object.
Fig. 7.
Example of two expression patterns of eve gene (a, b) stained with the same primary rabbit anti-Eve serum and two different goat anti-rabbit secondary antibodies, one conjugated with Cy5 (white) and the other to Texas Red (black). (a) Patterns are presented in one dimension for the data extracted from a 10% strip along the midline of an embryo in x direction. (b) The same two expression patterns after background removal.
We developed a method for unspecific signal removal (Myasnikova et al., 2005) that is applicable for images of various objects with fixed settings of the confocal microscope (see above). It is clear that even slight background distorts the numerical value of gene expression. In addition, the background level is varied between embryos and experiments and, therefore, impedes the comparison of data from various experiments. Unspecific staining is also varied in experiments on the expression of a particular gene using secondary antibodies labeled with distinct fluorochromes (Fig. 7).
The method of background removal that we suggested is based on observations that the fluorescence level in null-mutants stained on the product of the mutant gene is well approximated with two paraboloids or, in the common case, with a convex surface of the second order (Fig. 8). The paraboloid is very similar to the symmetric one by X (A–P) and Y (D–V) axes. The parabolic distribution of background signals is probably determined by the properties of the confocal microscope, which follows from experiments on microscope settings. It was found that an increase in “offset” values reduced the background of the image, whereas its decrease resulted in a parabolic background with increasing curvature. The basic idea for background removal is to determine nonexpressing embryo regions. These regions are used for approximation of nonspecific signals to remove the background by scaling the expression pattern; the procedure is performed in several steps.
Fig. 8.
Expression pattern of eve gene in an embryo homozygous for Df(2R)eve1.27 which expresses no Eve protein. (a) Two-dimensional pattern in which individual nuclei are shown as gray circles with black drop lines parallel to the vertical axis indicating the fluorescence intensity in the nuclei; (b, c). Projections of 10% strip cuts taken along the midline in the A–P and D–V directions. The 10% strips are indicated on the 2D image by dashed lines. The 1D patterns are presented together with the 1D projections of the paraboloid.
Determination of nonexpressing regions
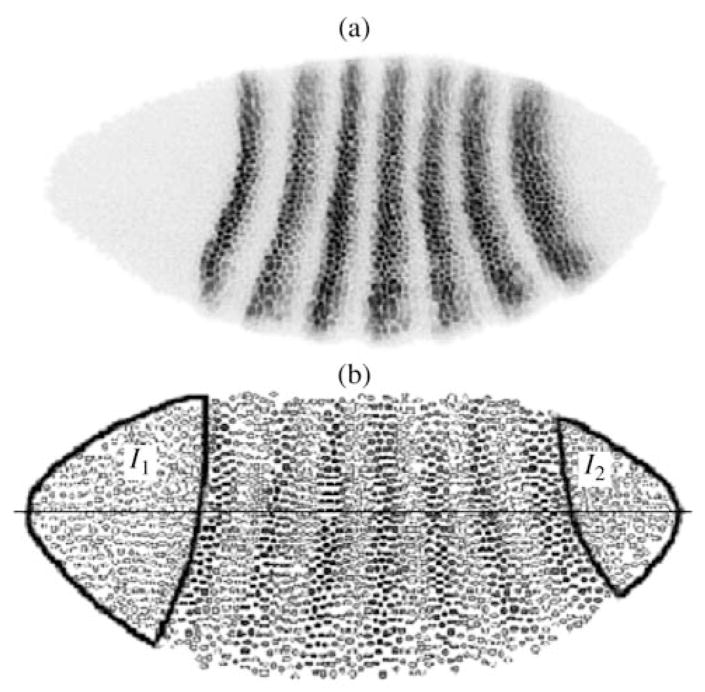
Nonexpressing regions are defined as areas with a particular gene being unexpressed in most nuclei. For each gene, these areas are shaped by careful visual examinations of expression patterns in all embryos. Identified nonexpressing areas, then, are precisely defined on the two-dimensional pattern of gene expression in every embryo (Fig. 9).
Fig. 9.
Extraction of the nonexpression areas. (a) Confocal image of a late blastoderm embryo stained for Eve protein (inverted); (b) reconstruction of the same expression pattern from quantitative segmented data. Individual nuclei are shown as circles with the color intensity inversely proportional to nuclear expression levels. Nonexpressing areas are outlined on the reconstructed image and labeled I1 and I2.
As segmentation gene expression is basically the function of the position relative to the A–P embryo axis (see above), it may be adequately represented as a one-dimensional signal. Therefore, in most cases, it is sufficient to set the borders of nonexpressing areas along the x axis. For example, the gene eve areas are located within 0–25 and 90–100% of the embryo’s length (Fig. 9). Nevertheless, in a two-dimensional presentation there is a slight curvature in the expression bands along the y axis. In embryos from our dataset, the curvature is enhanced by mechanical deformation caused by coverslip pressure. Thus, to determine two-dimensional nonexpressing areas, it is necessary to straighten the initially curved stripes of expression (Myasnikova et al., 2005).
Approximation and background removal
The background signal is approximated with a quadratic paraboloid fit to the points of support from nonexpressing areas of an embryo (Fig. 9). An approximated paraboloid is created by an iterative optimization procedure. The background is removed completely from an embryo through the linear mapping of the intensity that transforms the value of fluorescence equal to or less than the background to zero, while the maximum possible fluorescence (255 units) is transformed to its own value (Myasnikova et al., 2005). Examples of the normalization of various gene patterns are presented in Fig. 10.
Fig. 10.
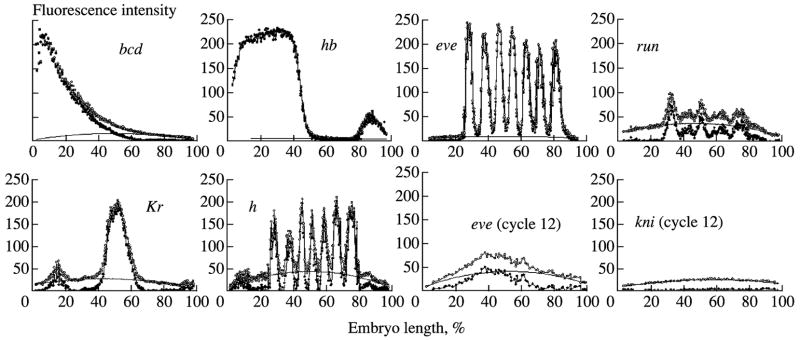
Results of background removal from representatives of expression patterns of several genes. All the patterns were obtained from embryos belonging to cleavage cycle 14A except for those with cycle specified in the figure. Proteins and fluorophores are as follows: Bcd, Hb are rat (FITC); Kr, Kni, Run are guinea pig (Cy5); Eve is rabbit (Cy5). white circles are non-normalized patterns; black circles are background free patterns; solid lines are background parabola.
Evaluation of the accuracy of background removal
The method of background removal was carefully verified on embryos homozygous for null-mutations of bcd, eve, gt, kni, and Kr genes and stained to visualize the product of a mutant gene. After background removal, the expression patterns in these mutants are transformed into the null level of expression in the entire embryo (Fig. 8). A visual evaluation of expression patterns shows that the method of background removal displays good results for 14A cycle embryos. Representative data on background removal from bcd, hb, Kr, eve, and run expression patterns at this stage are shown in Fig. 10. The method is less satisfactory for gap and pair-rule expression patterns at earlier stages of development (cycles 10–12) because of low signal intensity and a lack of clear borders between expression areas (Myasnikova et al., 2005).
3. Registration of gene expression patterns
A confocal microscope permitted us to simultaneously record expression patterns for only a limited number of genes. However, our aim was to reconstruct the spatiotemporal dynamics of all genes in the gene network examined. Because the sizes of individual embryos are variable, it is impossible to gain information on relative spatial expression of different genes by overlapping of expression patterns in individual embryos stained with antibodies to distinct proteins. To overcome the obstacles, the data on individual embryos should be adjusted to the common coordinate system with the registration procedure.
In previous reports (Myasnikova et al., 2001a, 2001b; Kozlov et al., 2002), we used a registration technique based on the allocation of control points in the image (Brown, 1992) and the transformation of coordinates for the maximally complete matching of these points in different images. Typical image features are usually used as control points. In the examined dataset, all embryos were stained for the expression of the eve gene. The expression pattern of this gene was highly temporally dynamic; therefore, as control points (peculiar pattern features), we used the extremes of the one-dimensional expression pattern obtained by data extraction from the central 10% embryo strip (Fig. 2). With control points for every image being determined, coordinates were transformed in a way that minimized the distance between corresponding points in different images. Then all registered images were subjected to coordinate transformation.
Choice of Control Points for Registration
1. Spline approximation
Stripes and interstripes in the one-dimensional expression diagram (Fig. 1, central row) represent peaks and minimums, correspondingly. It seems highly reasonable to use the x coordinates of curve extremes as control points for the following registration. However, it is very difficult to localize extremes directly from the original data because of the essential noise. To overcome the obstacle and to localize extremes, we applied the method of expression-pattern approximation with quadratic splines (Myasnikova et al., 2001a, 2001, b). The approach provides continuous approximation of the original curve and characterizes every pattern by a certain set of parameters. A simple approximation is achieved by a quadratic spline with unfixed nodes, which satisfies the requirement of the continuity of the first derivative in node points. A node system is chosen as multiple different points on the x axis limited the region of every peak. A node position is determined as a transition point between peak and neighbor minimum. As a result of approximation each curve is characterized with multiple nodes and spline parameters. The parameters are utilized to calculate the x coordinate of every extremum. Figure 11 presents an example by demonstrating that the position of the peak on the curve is accurately determined after approximation (Myasnikova et al., 2001b).
Fig. 11.
Spline approximation. Experimental curve of Eve concentrations (points) and approximating function (solid line). x coordinates of spline extrema are taken as coordinates of signal extrema.
2. Fast Redundant Dyadic Wavelet Transform (FRDWT)
The second method of setting control points is based on the iterative application of a wavelet transform (Kozlov et al., 2000, 2002). A wavelet transform (Unser, 1996; Malozemov et al., 1998) allows one to gain local high-frequency and large-scale information on an object. Its application makes it possible to simultaneously examine the data in physical (time, coordinate) and frequency spaces. It is necessary to choose the transformation type and basis in such a way as to separate the information from the signal on the first derivative of the original signal. FRDWT application makes this possible (Unser et al., 1994).
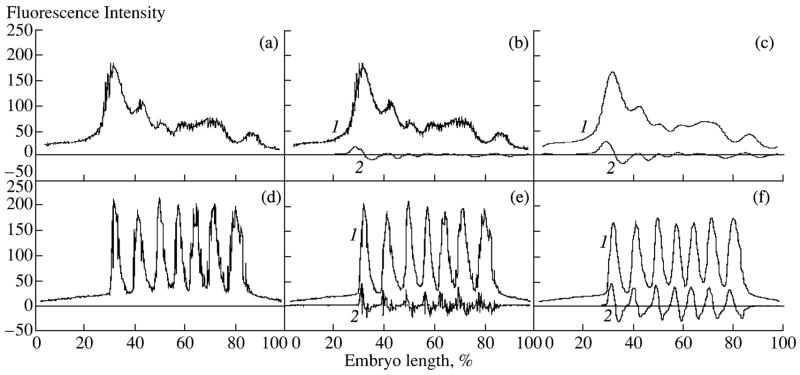
The common properties of FRDWT are strong noise inhibition and precise determination of spatially localized features. The signal is factorized in two sequences, i.e., approximating (low pass) and detailing (high pass) (Fig. 12, curves 1 and 2, respectively). Because of transformation redundancy, the number of elements in each sequence coincides with the number of observations in the initial sampling, which allows for complete information on extreme localization from the initial signal to be retained. The original signal is smoothing at each level by noise removal to the extent of a particular frequency and is represented as an approximating sequence. The detailing constituent contains information on initial signal properties that are determined by the option of the corresponding wavelet basis (Unser, 1996). To define extreme positions, i.e., nulls of the first derivative, basis functions are applied to include the first derivative characteristics into the detailing sequence. Decomposition is repeated iteratively, using the current low pass at each step instead of the initial signal (Fig. 12).
Fig. 12.
Example of wavelet decomposition. eve expression patterns in embryos from class 3 (a, b, c) and 8 (d, e, f). (a, d) The original signal; (b, e) low (1) and high (2) pass for first (b) and second (e) decomposition levels; (c, f) third level of signal decomposition used for GCP extraction.
3. Image registration
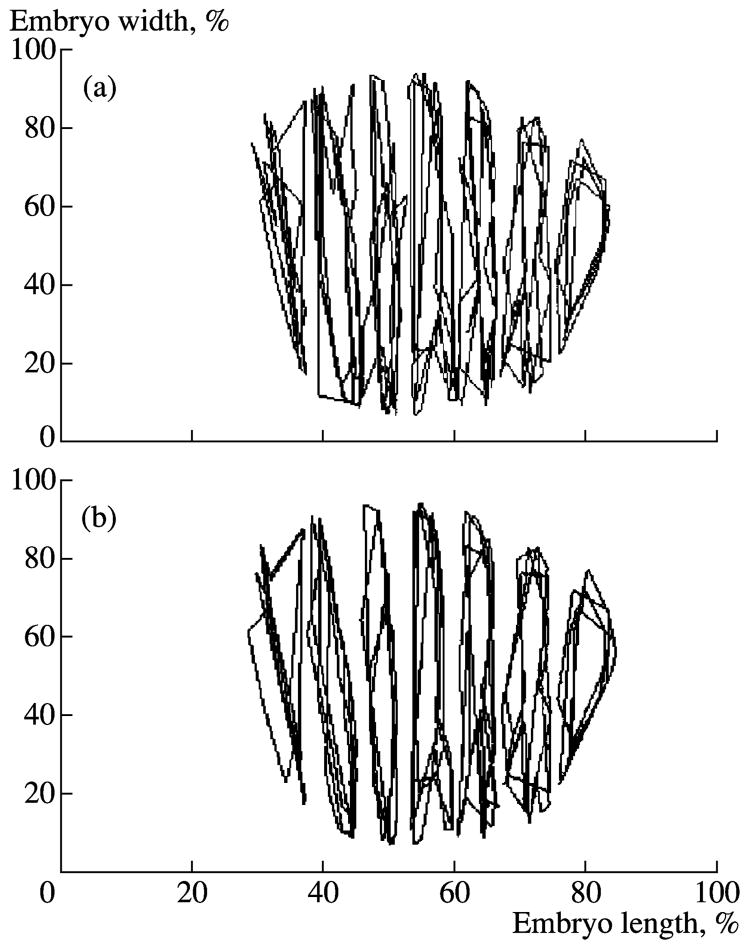
Image registration is performed with the scaling of two-dimensional expression patterns along the x axis by means of an affinity transformation minimizing the summary distance between the x coordinates of the total control points in different patterns and the average position of corresponding control points in overall registered images (Kozlov et al., 2002) (Fig. 13). The method developed was used to register the segmentation gene expression in embryos of a single temporal class. The example of registration of the gene eve expression patterns for embryos of temporal class 8 is shown in Fig. 13. It is obvious that registration reduces the pattern location of spatial variability. An evaluation of the accuracy of the image registration technique was performed using the values of standard deviations in extreme x coordinates of the eve pattern for each temporal class. In temporal class 3 with the expression pattern not yet formed and only several control points available, these values are approximately 3.5% of the embryo length. The accuracy of extreme sets and, therefore, and of registration is higher in later temporal classes. In this period, the values of standard deviations in extreme positions becomes less than 1% of the embryo length; rather, it corresponds approximately to the diameter of a single nucleus in the 14A cycle and indicates the acceptable registration quality (Kozlov et al., 2002).
Fig. 13.
Spatial registration. (a, b) Two-dimensional eve expression patterns in four embryos from temporal class 8 before and after registration, respectively; lines correspond to the 50% of maximal level of expression.
4. Construction of integrated data
The main purpose of the spatial registration and background removal was to create a map of mutual positions of expressing domains for all genes of the examined gene network for every period of time. Thus, on the map, the expression regions of every gene are presented with “reference” and “integrated” patterns characterized by average values of fluorescence intensity for that particular period of time. For the gene network controlling the segmentation in Drosophila, our goal was to construct integrated patterns for all of the embryos related to each temporal class (Fig. 1). A perfectly integrated pattern for a gene could be created in a hypothetical situation where all embryos have equal nuclear structures, i.e., composed of multiple nuclei with equal coordinates for all embryos. In this case, the average values of fluorescence intensity should be calculated independently for every nucleus independently; however, the quantity and position of nuclei in various embryos, as well as the density of nucleus distribution inside individual embryos, are variable. Taking this into consideration, we calculated the nuclear structure of the average pattern by defining the spatial density of nuclear distribution and estimation of the average nucleus diameter in every point of average embryo (Kozlov et al., 2002).
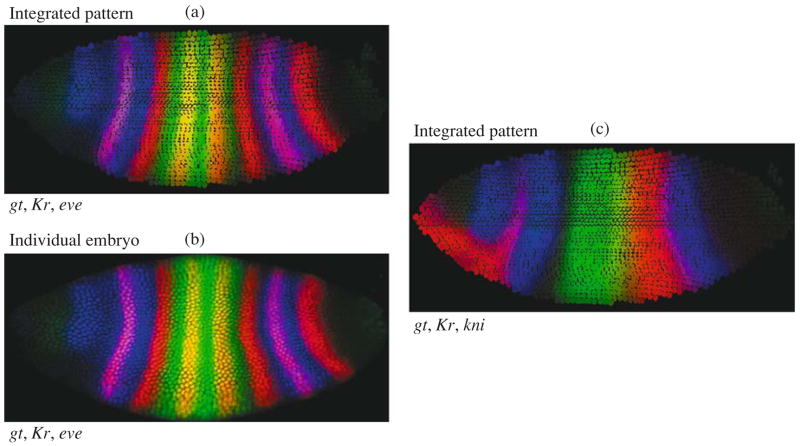
Two-dimensional integrated expression patters were constructed on the registered data for embryos of every temporal class. For this purpose, a nucleus of an average pattern of a nuclear structure with the most similar coordinates was found for each nucleus of an individual embryo. Then, the average fluorescence intensity of total individual nuclei referring to the average nucleus has been calculated. The example of the integrated two-dimensional pattern of gt, Kr, and eve gene expression in embryos of temporal class 8 is presented in Fig. 14a. A comparison of the pattern with this but in an individual embryo (Fig. 14b) shows that the integrated pattern as a whole reflects the expression pattern of individual genes, including the shape and size of their domain. Fig. 14c demonstrates the expression patterns of Kr, kni, and gt genes. In these experiments, there were no embryos stained for simultaneous identification of the gene expression. Overlapping the integrated expression pattern onto the nuclear structure of the average pattern, it is possible to create so called “virtual embryos” with novel gene combination for the visualization of mutual arrangement of domain expression (Kozlov et al., 2002).
Fig. 14.
Two-dimensional atlas of segmentation genes in time class 8. (a) Integrated patterns of gt, Kr and eve; (b) expression patterns of the same genes in the individual embryo from the same time class; (c) “virtual” embryo showing integrated patterns of Kr, kni and gt.
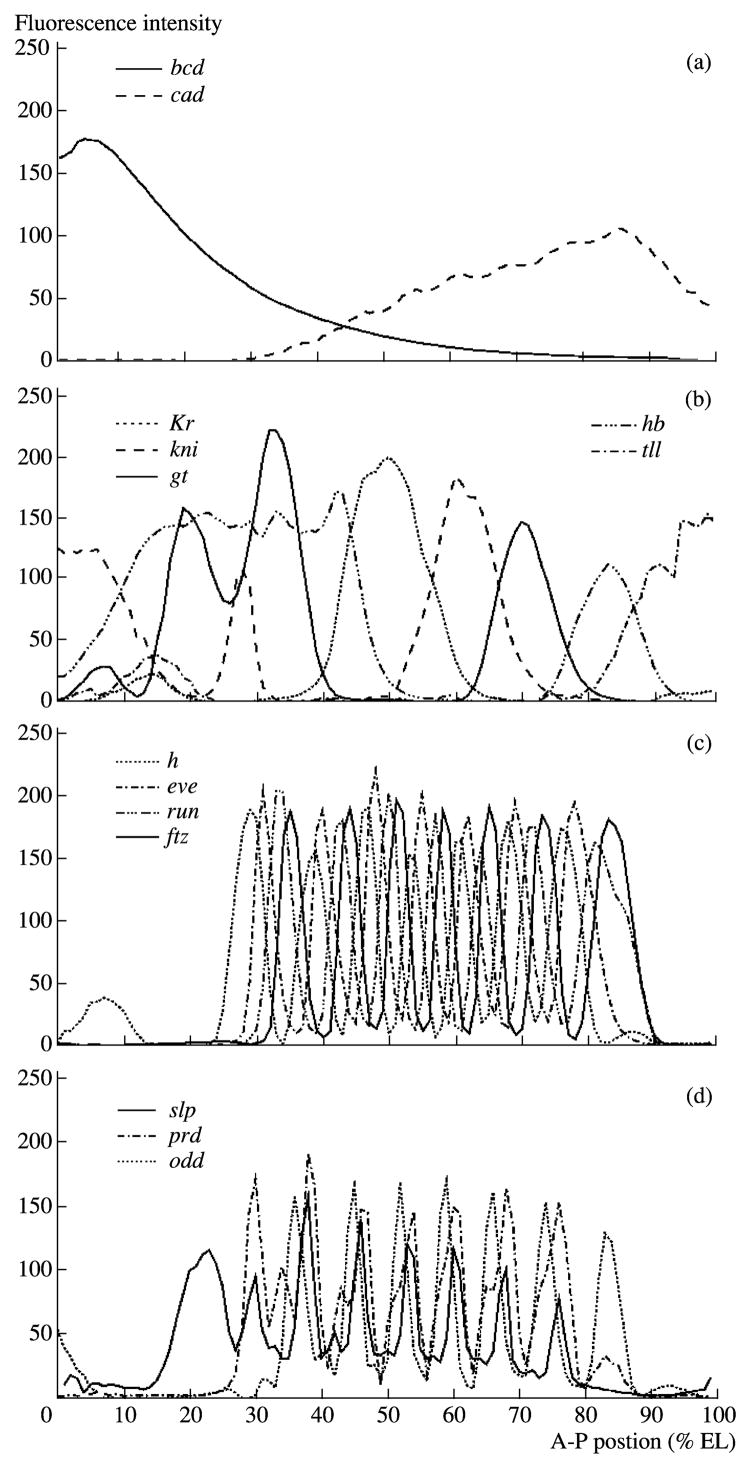
To create one-dimensional integrated patterns of segmentation, the gene-expression nucleus coordinates of every one-dimensional registered pattern are grouped along the x axis by R intervals (Myasnikova et al., 2001b). Then, inside each interval, the average value of the fluorescence intensity is calculated for all embryos of a particular temporal class. R is found as follows. For example, in the 14A cycle, the diameter of a single nucleus in the central part of the embryo is 1% of its length; in this case, to correctly design the nuclear structure of the pattern, R should be 100. One-dimensional integrated patterns of the expression of maternal, gap, and pair-rule genes are shown in Fig. 15.
Fig. 15.
One-dimensional atlas of segmentation gene expression. (a) Maternal gradients in time class 6; (b) gap genes in time class 8; (c, d) pair-rule genes in time class 8.
CONCLUSIONS
The paper surveys the methods we developed for the acquisition of quantitative data on gene expression based on confocal images. The processing methods described include image segmentation, background removal, spatial registration of expression patterns, and data integration (Kozlov et al., 2000, 2002; Myasnikova et al., 2001a, 2001b, 2005; Janssens et al., 2005). The procedures are basic for the acquisition and processing of quantitative data on gene expression and can be used both in order and in various combinations. The general advantages of techniques presented are the wide spectrum of treatment procedures and easiness of adaptation to other biological objects.
Most of the methods for image processing are suggested mainly for limited purposes (e.g. image registration) and, therefore, consist of one or two procedures. The most widespread and relevant method is that of cell and tissue image segmentation (Ortiz de Solorzano et al., 1999, 2001;Umesh Adiga and Chaudhuri, 1999; Chawla et al., 2004). An essential drawback of most segmentation algorithms and basing software is the requirement for the user to take part in setting the processing parameters. The segmentation method we developed is completely automatic. The single step needed the visual control is the definition of embryo orientation (Fig. 3). Other research teams have performed the segmentation of confocal images of a Drosophila blastoderm using their own techniques. Thus, by moving a square window with a size similar to the average nucleus size along the dorsal side of a confocal image of the embryo, quantitative data on bcd and hb gene expression have been obtained (Houchmandzadeh et al., 2002). In each square the authors calculated the average fluorescence values. Later, the same technique was applied by other investigators (Gregor et al., 2005). In both cases, the method was realized with Mat-Lab, Mathworks (USA) commercial software. The method has disadvantages—it operates with the notion of average nuclear size, does not distinguish real nuclei on images, and, therefore, it is complicated to apply the technique for image segmentation in other biological objects.
A recent development is the method of three-dimensional stack segmentation of confocal images of Drosophila blastoderm (Luegno et al., 2006). The method is based on the estimation of local maximums of nuclear fluorescence the and extraction of so called “seeds” for every nucleus to identify positions of nuclei stained with Sytox Green Dye for DNA detection. Next, seeds are intensified in the image obtained from the initial one with the application of a threshold filter. This method, as well as those described above, is realized with Mat-Lab software. Its advantage is that it was initially developed for three-dimensional data processing, while its drawback is a difficulty in seed estimation, as most of the nuclei have several local maximums and a complicated correction procedure is required. In addition, seed intensification is performed with masks obtained using threshold filters, which does not always reproduce nuclear shapes and sizes.
Currently, a few techniques are available to remove unspecific signals from confocal images. Many researchers remove unspecific backgrounds only by subtracting a particular intensity value from the total signal. It has been shown (Gregor et al., 2007) that images of Drosophila living embryos with endogenous bcd gene substituted with expressing eGFP registered by two-photon confocal microscope have approximately uniform unspecific fluorescence within an embryo. However, these observations are exceptional and, undoubtedly, there should be algorithms that allow differences in the background signal in various parts of confocal images to be taken into consideration.
A procedure has recently been published for image registration that differs from what we developed (Sorzano et al., 2006). This method, called “elastic registration,” elastically deforms images to overlap expression patterns in different embryos. After transformation, all registered images are reduced to the same size in x and y axes. The method is highly effective; however, it is unsuitable for evaluating expression domain positions, as it transforms the coordinates of initial images.
The general advantage of the method described in this paper for treating confocal images of Drosophila blastoderms is the wide spectrum of procedures and progressive data treatment, as well as the possibility of adaptation to other biological objects. We have applied the technique to the processing of about 5000 images of segmentation gene expression at the protein level in Drosophila. Quantitative data obtained have been successfully used for the elucidation of the regulatory mechanisms underlying the border shift in gap domain expression in early embryogenesis (Jaeger et al., 2004b), as well as for the identification of regulatory mechanisms controlling gap gene expression (Jaeger et al., 2004a). The technique has also been employed to characterize the processes of dynamic filtration of the temporal variability of the expression pattern of zygotic segmentation genes (Surkova et al., 2008).
The general drawback of most task-oriented software for data and image processing is the difficulty of adapting them to resolve similar problems in other objects. The procedures of segmentation, background removal, and the creation of integrated patterns described in the paper presented have been successfully adapted for processing data on segmentation gene expression at the mRNA level. In Drosophila, the main difference in the expression of genes encoding transcription factors at the mRNA and protein level is that RNA is localized in both the nucleus and cytoplasm. For the segmentation of such images, a modified watershed procedure that generates a mask for nuclei and the surrounding cytoplasm has been applied (Fig. 5). In addition, slight changes in the procedure including a search for the points of support to remove an unspecific background have been made. As a result, average expression patterns for the eve gene reporter constructs at the mRNA level have been produced. Based on these findings, a novel model of transcriptional regulation has been suggested (Janssens et al., 2006). The method was also partially adapted for processing three-dimensional data obtained with a confocal microscope. Several image stacks of embryos stained for the identification of rhomboid gene activity in nuclei have been treated. The procedure of nuclear-mask production during segmentation is successfully modified for masking expressing regions and the acquisition of quantitative data on gene expression in the early development of coral Acropora millepora and sea anemone Nematostella vectensis (Kozlov et al., 2007).
Acknowledgments
This work was supported by the NIH grant RR07801, by CRDF GAP Award RUB1-1578, by contract 02.467.11.1005 from the FASI of the RF, and by grant 047.011.2004.013 from the NWO-RFBR.
The authors are grateful to Dr. D. Kosman and Dr. C. Alonso for help in acquisition of experimental data.
References
- Azpiazu N, Frasch M. tinman and bagpipe: Two Homeobox Genes that Determine Cell Fates in the Dorsal Mesoderm of Drosophila. Genes Dev. 1993;7:1325–1340. doi: 10.1101/gad.7.7b.1325. [DOI] [PubMed] [Google Scholar]
- Banerjee N, Zhang MQ. Functional Genomics as Applied to Mapping Transcription Regulatory Networks. Current Opinion Microbiol. 2002;5:313–317. doi: 10.1016/s1369-5274(02)00322-3. [DOI] [PubMed] [Google Scholar]
- Brown LG. A Survey of Image Registration Techniques. ACM Computing Surveys. 1992;24:325–376. [Google Scholar]
- Chawla MK, Lin G, Olson K, Vazdarjanova A, Burke SN, McNaughton BL, Worley PF, Guzowski JF, Roysam B, Barnes CA. 3D-catFISH: a System for Automated Quantitative Three-dimensional Compartmental Analysis of Temporal Gene Transcription Activity Imaged by Fluorescence in situ Hybridization. J Neurosci Methods. 2004;139:13–24. doi: 10.1016/j.jneumeth.2004.04.017. [DOI] [PubMed] [Google Scholar]
- Crimmins TR. Geometric Filter for Speckle Reduction. Appl Opt. 1985;24:1438–1443. doi: 10.1364/ao.24.001438. [DOI] [PubMed] [Google Scholar]
- Dequin R, Saumweber H, Sedat J. Proteins Shifting from the Cytoplasm into the Nuclei During Early Embryogenesis of Drosophila melanogaster. Devel Biol. 1984;104:37–48. doi: 10.1016/0012-1606(84)90034-4. [DOI] [PubMed] [Google Scholar]
- Frasch M, Hoey T, Rushlow C. Characterization and Localization of the Even-skipped protein of Drosophila. EMBO J. 1987;6:749–759. doi: 10.1002/j.1460-2075.1987.tb04817.x. [DOI] [PMC free article] [PubMed] [Google Scholar]
- Gilbert SF. Developmental Biology. Sunderland, Massachusetts: Sinauer Associates; 2003. [Google Scholar]
- Gonzalez RC, Woods RE. Digital image processing. Upper Saddle River, N.Y: Prentice Hall; 2002. [Google Scholar]
- Gonazalz P, Woods R. Numerical Treatment of Images. Moscow: Technoshera; 2005. [Google Scholar]
- Gregor T, Tank DW, Wieschaus EF, Bialek W. Probing Limits of Positional Information. Cell. 2007;130:153–164. doi: 10.1016/j.cell.2007.05.025. [DOI] [PMC free article] [PubMed] [Google Scholar]
- Gregor T, Bialek W, de Ruyter van Steveninck RR, Tank DW, Wieschaus EF. Diffusion and Scaling during Early Embryonic Pattern Formation. Proc Natl Acad Sci USA. 2005;102:18403–18407. doi: 10.1073/pnas.0509483102. [DOI] [PMC free article] [PubMed] [Google Scholar]
- Houchmandzadeh B, Wieschaus E, Leibler S. Establishment of Developmental Precision and Proportions in the Early Drosophila Embryo. Nature. 2002;415:748–749. doi: 10.1038/415798a. [DOI] [PubMed] [Google Scholar]
- Hu MK. Visual Pattern Recognition by Moment Invariants. IRE Transactions Information Theory. 1962;8:179–187. [Google Scholar]
- Jaeger J, Blagov M, Kosman D, Kozlov KN, Manu Myasnikova E, Surkova S, Vanario-Alonso CE, Samsonova M, Sharp DH, Reinitz J. Dynamical Analysis of Regulatory Interactions in the Gap Gene System of Drosophila melanogaster. Genetics. 2004a;67:1721–1737. doi: 10.1534/genetics.104.027334. [DOI] [PMC free article] [PubMed] [Google Scholar]
- Jaeger J, Surkova S, Blagov M, Janssens H, Kosman D, Kozlov K, Manu Myasnikova E, Vanario-Alonso C-E, Samsonova M, Sharp D, Reinitz J. Dynamic Control of Positional Information in the Early Drosophila Embryo. Nature. 2004b;430:368–371. doi: 10.1038/nature02678. [DOI] [PubMed] [Google Scholar]
- Janssens H, Hou S, Jaeger J, Kim AR, Myasnikova E, Sharp D, Reinitz J. Quantitative and Predictive Model of Transcriptional Control of the Drosophila melanogaster Even-skipped Gene. Nature Genetics. 2006;38:1159–1165. doi: 10.1038/ng1886. [DOI] [PubMed] [Google Scholar]
- Janssens H, Kosman D, Vanario-Alonso CE, Jaeger J, Samsonova M, Reinitz J. A High-throughput Method for Quantifying Gene Expression Data from Early Drosophila Embryos. Devel Gen Evol. 2005;215:374–381. doi: 10.1007/s00427-005-0484-y. [DOI] [PubMed] [Google Scholar]
- Kosman D, Reinitz J, Sharp DH. Proceedings of the 1998 Pacific Symposium on Biocomputing. Singapore: World Scientifc Press; 1997. Automated Assay of Gene Expression at Cellular Resolution; pp. 6–17. [PubMed] [Google Scholar]
- Kosman D, Small S, Reinitz J. Rapid Preparation of a Panel of Polyclonal Antibodies to Drosophila Segmentation Proteins. Devel Gen Evol. 1998;208:290–294. doi: 10.1007/s004270050184. [DOI] [PubMed] [Google Scholar]
- Kozlov K, Myasnikova E, Pisarev A, Samsonova M, Reinitz J. A Method for Two-dimensional Registration and Construction of the Two-dimensional Atlas of Gene Expression Patterns in situ. In Silico Biol. 2002;2:125–141. [PubMed] [Google Scholar]
- Kozlov K, Myasnikova E, Samsonova M, Reinitz J, Kosman D. Method for Spatial Registration of the Expression Patterns of Drosophila Segmentation Genes Using Wavelets. Comput Technol. 2000;5:112–119. [Google Scholar]
- Kozlov K, Pisarev A, Matveeva A, Kaandorp J, Samsonova M. Image Processing Package ProStack for Quantification of Biological Images. Proceedings of the 4th International Symposium on Networks in Bioinformatics (ISNB); Amsterdam, Netherlands. 2007. p. 204. [Google Scholar]
- Luengo-Hendriks CL, Keränen SV, Fowlkes CC, Simirenko L, Weber GH, Henriquez C, Kaszuba D, Hamann B, Eisen M, Malik J, Sudar D, Biggin MD, Knowles DW. 3D of Morphology and Gene Expression in the Drosophila Blastoderm at Cellular Resolution. Genome Biol. 2006;7:R123. doi: 10.1186/gb-2006-7-12-r123. [DOI] [PMC free article] [PubMed] [Google Scholar]
- Malozemov VN, Pevniy AB, Tretjakov AA. Fast Wavelet Transform of Discrete Periodic Signals and Images. Problems Information Transmission. 1998;34:77–85. [Google Scholar]
- Matveeva A, Kozlov K, Samsonova M. Extraction of Quantitative Gene Expression Data from the Images of Gene Expression Patterns with ProStack and iSIMBioS. Proc. of the 4rd TICSP Workshop on Computational Systems Biology (WCSB 2006); Tampere, Finland. 2006. pp. 65–68. [Google Scholar]
- Myasnikova E, Samsonov AM, Samsonova MG, Reinitz D. Three-dimensional Registration of Data on Gene Expression in situ. Mol Boil (Russian) 2001a;35:1110–1115. [PubMed] [Google Scholar]
- Myasnikova E, Samsonova A, Kozlov K, Samsonova M, Reinit J. Registration of the Expression Patterns of Drosophila Segmentation Genes by Two Independent methods. Bioinformatics. 2001b;17:3–12. doi: 10.1093/bioinformatics/17.1.3. [DOI] [PubMed] [Google Scholar]
- Myasnikova E, Samsonova A, Samsonova M, Reinitz J. Support Vector Regression Applied to the Determination of the Developmental Age of a Drosophila Embryo from Its Segmentation Gene Expression Patterns. Bioinformatics. 2002;18:S87–S95. doi: 10.1093/bioinformatics/18.suppl_1.s87. [DOI] [PubMed] [Google Scholar]
- Myasnikova E, Samsonova M, Kosman D, Reinitz J. Removal of Background Signal from in situ Data on the Expression of Segmentation Genes in Drosophila. Devel Gen Evol. 2005;215:320–326. doi: 10.1007/s00427-005-0472-2. [DOI] [PubMed] [Google Scholar]
- Ortiz de Solórzano C, Garcia Rodriguez E, Jones A, Pinkel D, Gray JW, Sudar D, Lockett SJ. Segmentation of Confocal Microscope Images of Cell Nuclei in Thick Tissue Sections. J Microsc. 1999;193:212–226. doi: 10.1046/j.1365-2818.1999.00463.x. [DOI] [PubMed] [Google Scholar]
- Poustelnikova E, Pisarev A, Blagov M, Samsonova M, Reinitz J. A Database for Management of Gene Expression Data in situ. Bioinformatics. 2004;20:2212–2221. doi: 10.1093/bioinformatics/bth222. [DOI] [PubMed] [Google Scholar]
- Press WH, Flannery BP, Teukolsky SA, Vetterling WV. Numerical Recipes in The art of scientific computing. Cambridge: Cambridge University Press; 1988. p. 208. [Google Scholar]
- Sachs L. Statistische Auswertungsmethoden. Berlin, Heidelberg, New York: Springer; 1972. p. 548. [Google Scholar]
- Samsonova MG, Gursky VV, Kozlov KN, Samsonov AM. Systems Approach for the Study of Organism Development. Sci Techn Bull SPbSU. 2006;2:222–234. [Google Scholar]
- Shav-Tal Y. The Living Test-tube: Imaging of Real-time Gene Expression. Soft Matter. 2006;2:361–370. doi: 10.1039/b600234j. [DOI] [PubMed] [Google Scholar]
- Shen J, Castan S. An Optimal Linear Operator for Edge Detection. Proceedings of the IEEE Conference on Computer Vision and Pattern Recognition; Miami, FL. 1986. pp. 109–114. [Google Scholar]
- Sorzano COS, Blagov M, Thevenaz P, Myasnikova E, Samsonova M, Unser M. Algorithm for Spine-Based Elastic Registration in Application to Confocal Images of Gene Expression. Pattern Recognition and Image Analysis. 2006;16:93–96. [Google Scholar]
- Surkova S, Kosman D, Kozlov K, Myasnikova E, Samsonova AA, Spirov A, Vanario-Alonso CE, Samsonova M, Reinitz J. Characterization of Drosophila Segment Determination Morphome. Dev Biol. 2008;313:844–862. doi: 10.1016/j.ydbio.2007.10.037. [DOI] [PMC free article] [PubMed] [Google Scholar]
- Umesh Adiga PS, Chaudhuri BB. Efficient Cell Segmentation Tool for Confocal Microscopy Tissue Images and Quantitative Evaluation of FISH Signal. Microsc Res Tech. 1999;44:49–68. doi: 10.1002/(SICI)1097-0029(19990101)44:1<49::AID-JEMT6>3.0.CO;2-6. [DOI] [PubMed] [Google Scholar]
- Unser M. Wavelets in Medicine and Biology. Boca Raton FL, USA: CRC Press; 1996. A Practical Guide to the Implementation of the Wavelet Transform; pp. 37–73. [Google Scholar]
- Unser M, Aldroubi A, Schiff S. Fast Implementation of the Continuous Wavelet Transform with Integral Scales. IEEE Trans Signal Process. 1994;42:3519–3523. [Google Scholar]
- Vincent L. Morphological Grayscale Reconstruction in Image Analysis: Applications and Efficient Algorithms. IEEE Trans-actions Image on Processing. 1993;2:176–201. doi: 10.1109/83.217222. [DOI] [PubMed] [Google Scholar]


