

Abstract
Purpose
To evaluate the expression of cathepsin K (CTSK) and CXCL14 in stromal and epithelial cells in human breast tumor progression.
Experimental Design
We did immunohistochemical analyses of CTSK and CXCL14 expression in normal breast tissue, biopsy sites, benign lesions, ductal carcinoma in situ, and invasive breast tumors of different stages. Expression patterns were related to histopathologic characteristics of the tumors and clinical outcome. The effect of CTSK+ breast stromal fibroblasts on CTSK-breast cancer cells was assessed in coculture.
Results
Epithelial expression of CTSK was rarely detectedin any of the tissue samples analyzed, whereas CXCL14-positive epithelial cells were found in all tissue types. The expression of CXCL14 was not associated with any tumor or patient characteristics analyzed. Stromal CTSK expression was significantly higher in invasive compared with in situ carcinomas, and in one of the two data sets analyzed, it correlated with higher tumor stage. Among all samples examined, the highest stromal CTSK levels were detected in biopsy sites. Neither epithelial nor stromal expression of CTSK was significantly associated with recurrence-free or overall survival. Coculture of CTSK+ fibroblastsenhanced the invasion of CTSK-breast tumor epithelial cells and this was blocked by CTSK inhibitors.
Conclusions
CTSK may function as a paracrine factor in breast tumorigenesis. CTSK+ fibroblasts may play a role in tumor progression by promoting the invasiveness of tumor epithelial cells. The possibility that CTSK inhibitors may have a clinical role in decreasing the risk of tumor progression merits further investigation.
The importance of epithelial-stromal cell interactions in breast tumorigenesis has increasingly been recognized (1–3). Cells composing the microenvironment have been shown to promote tumor growth, invasion, angiogenesis, and metastatic capacity in various model systems (1–3). To investigate molecular alterations that occur in cells composing the microenvironment during tumor progression, we previously characterized the gene expression, DNA methylation, and genetic profiles of various cell types isolated from normal breast tissue and from ductal carcinoma in situ (DCIS) and invasive tumors (4, 5). Based on these analyses, we found dramatic gene expression and DNA methylation changes in all cell types during breast tumor progression, whereas clonally selected genetic alterations were restricted to tumor epithelial cells. Many of the genes differentially expressed between normal and DCIS-associated myoepithelial cells and highly expressed in stromal myofibroblasts encoded proteases, protease inhibitors, extracellular matrix proteins, and chemokines. The up-regulation of these genes in tumor-associated myoepithelial and stromal cells suggested the activation of aberrant paracrine interactions and perturbed balance in extracellular matrix degrading protease activity resembling a wound-healing response (6). Cathepsins and their inhibitors (cystatins) and the CXCL14 chemokine were among the most highly overexpressed genes in DCIS-associated myoepithelial cells and in myofibroblasts. Cathepsins and chemokines have been implicated in tumor progression and the feasibility of their therapeutic targeting is currently being explored for cancer treatment.
Cathepsins are lysosomal cysteine proteases that have been implicated in tissue remodeling and angiogenesis and in the processing of certain hormones, transcription factors, and immunogens (7, 8). The human cathepsin gene family is composed of 11 members [cathepsins B (CTSB), C, H, F (CTSF), K (CTSK), L (CTSL), O, S, V, W, and X/Z] each with their unique as well as overlapping function as revealed by the phenotype of mutant mice deficient for individual genes or their combination. The activity of cathepsins is regulated at multiple levels including control of gene expression, protein activation, and association with cystatins that are potent protease inhibitors (9). Recent studies implicated several cathepsins in tumor progression using an animal model of multistage carcinogenesis (8, 10). Inhibition of cathepsin activity appears to be a promising therapeutic approach for the treatment of metastatic disease and inhibition of tumor progression (11).
CTSK is highly expressed in osteoclasts and plays an essential role in bone remodeling as shown by the osteopetrotic phenotype of the CTSK−/− mouse (12). Related to this, CTSK inhibitors have successfully been used in the clinic for the treatment of osteopetrosis-associated bone loss and preclinical studies have shown their effectiveness in reducing bone metastases of breast carcinomas (13). Besides osteoclasts, CTSK is also highly expressed in a subset of leukocytes and in synovial fibroblasts in rheumatoid and osteoarthritis (14, 15). Previous studies analyzing the expression of CTSK in human breast tumors described expression only in bone metastases (16). However, in our previous studies, we found high expression of CTSK in breast tumor-associated myoepithelial cells and myofibroblasts, suggesting that CTSK may play a paracrine role in tumorigenesis (4).
The CXCL14 (BRAK) is a chemokine with unknown function that was initially identified as a chemokine highly expressed in the kidney and breast (17). Its receptor is still unknown, but CXCL14 has been shown to be a chemoattractant for monocytes, B cells, and dendritic cells and has also been implicated to play a role in the regulation of tumor cell growth, angiogenesis, and activation of NK cells (18–22). The phenotype of the CXCL14-deficient mice revealed no immunologic or other gross anatomic abnormalities, although homozygous-null mice were born at lower than expected frequency from heterozygous crosses (23). However, CXCL14−/− mice were resistant to high fat diet-induced obesity and diabetes (24). Associated with its potential role in obesity, CXCL14 was also shown to be induced by growth hormone, insulin-like growth factor, and insulin in hepatocytes and to enhance insulin-dependent glucose uptake in adipocytes (25). Whether CXCL14 is induced by the same growth factors in other cell types, such as breast tumor epithelial cells, has not been investigated. In our previous study, we found high expression of CXCL14 in DCIS-associated myoepithelial cells as well as in the epithelial cells of a subset of breast carcinomas (4). Thus, CXCL14 may contribute to breast tumorigenesis via multiple different mechanisms including both autocrine and paracrine effects.
To investigate the potential roles of CTSK and CXCL14 in breast tumor progression, we analyzed their expression in stromal and epithelial cells in a variety of normal and diseased human breast tissue samples including benign disorders and biopsy sites and in in situ, invasive, and metastatic breast carcinomas. The relationship between the expression of CTSK and normal and diseased human breast tissue specimens was examined in two data sets, one of which also had data on CXCL14 expression. The association of recurrence-free survival (RFS) and CTSK expression and other tumor and patients covariates was examined in another data set.
Translational Relevance
The regulation of in situ to invasive carcinoma transition is a poorly understood yet clinical important step of breast tumorigenesis. Increasing evidence suggests that during tumorigenesis abnormalities occur not only in breast cancer cells but also in the surrounding stromal cells. A tumor is an abnormal organ with its own blood vessels, inflammatory, and supportive cells, and effective interaction among these cells is essential for the growth and maintenance of the tumor. Unlike cancer cells, stromal cells are thought to be genetically stable and therefore are less likely to develop resistance to cancer therapy. Thus, therapeutic targeting of stromal cells may be beneficial for cancer treatment. In this article, we provide evidence that stromal expression of CTSK may play a role in breast tumor progression. Specifically, CTSK may act as a paracrine factor to promote the progression of DCIS to invasive tumors. Thus, inhibition of CTSK activity may decrease the risk of breast tumor progression and should be explored further in clinical trials.
Materials and Methods
Tissue specimens and cell cultures
Human tissue specimens made into tissue microarrays were provided by Petagen, purchased from Imgenex, or constructed at the University of Michigan Cancer Center (UMCC) and at the Beth-Israel Deaconess Medical Center (BIDMC) as described previously (26). Each of the four sources of tissue microarrays was associated with different data items. The BIDMC provided normal breast tissue of two types, benign breast tissue of three types, and biopsy site tissue; all these tissue types had CTSK expression measured in the stroma. The BIDMC also provided specimens with atypical ductal hyperplasia (ADH), low- to intermediate-grade DCIS, high-grade DCIS, infiltrating ductal carcinoma, and radial scar/complex sclerosing lesions; all these tissue types had CTSK expression and CXCL14 expression measured in both stromal and epithelial cells. All of the tissue microarrays from BIDMC are referred to as the BIDMC data set. Tissue microarrays provided by Petagon and purchased from Imgenex were made from tissue from Korean patients with invasive breast cancer (some ductal and some lobular). This data set (referred to as the Korean data set) included data on some patient and tumor characteristics, data on CTSK expression in stroma from all patients used in the analysis, and data on CXCL14 for about half of the patients (with 97% of the CXCL14 expression data being from stroma and 3% of the CXCL14 expression data being from epithelium). The UMCC provided tissue microarrays were made from tissue from stage I, II, or III invasive breast cancer; all the specimens used in analysis had CTSK expression measured in both stroma and epithelium. This data set (referred to as the UMCC data set) included data on some patient and tumor characteristics (many in common with the Korean data set) as well as data on relapse-free survival and overall survival. Expression of CTSK and CXCL14 was scored on a scale of +, ++, and +++. The highest score (of the three or four replicates) was used for statistical analysis and staining was considered to be positive if the highest score was ++ or +++ and considered to be negative if the highest score was − or +. The only exception was CXCL14 expression in the Korean data set, whereas any level of positivity (+, ++, and +++) was considered positive due to the low number (four cases) of samples with ++ and +++ scores.
Breast cancer cell lines were obtained from the American Type Culture Collection; SUM series of breast cancer cell lines and the MCF10ADCIS.com cells (referred to as MCFDCIS) were generous gifts of Dr. Steve Ether (University of Michigan) and Dr. Fred Miller (Karmanos Cancer Institute), respectively. All cell lines were grown in medium recommended by the provider. Fresh, frozen, or formalin-fixed, paraffin-embedded tumor specimens were obtained from multiple sources: the Brigham and Women’s Hospital, BIDMC, and UMCC. Primary stromal fibroblast cultures were established and maintained as described (5). All human tissue was collected using protocols approved by the institutional review boards. Samples with clinical follow up data (UMCC cohort) were collected with informed consent.
RNA isolation and Northern blots
Total RNA was prepared using a guanidium cesium chloride method (4). Northern blot analysis was done as described (27).
Immunohistochemical and immunoblot analysis
Immunohisto-tochemical analyses of CTSK expression was done essentially as described (28) using monoclonal anti-CTSK antibody clone CK4 (Vision Biosystems), whereas staining for CXCL14 was done following a protocol provided by Dr. Galina Shurin (University of Pittsburgh; ref. 20). Western blots were done using cell lysates and antibodies to CSTK (clone CK4), CTSL (clone 13C2), CTSB (clone CB121), and CTSF (clone CTF12) all from Vision Biosystems. The expression levels were analyzed blindly and independently by breast pathologists and classified into −, +, ++, and +++ following a previously validated scoring schema (26).
Cell proliferation, migration, and invasion assays
To determine the effect of cathepsin inhibitors on two-dimensional cell growth, we plated 2,000 cells per well in a 48-well plate and grew them in their regular growth medium (control) or with different concentrations of the inhibitors. Cells were counted (two wells per time point) on days 1, 3, and 6 after plating. Proliferation assays in three-dimensional culture were done essentially the same way. To determine whether inhibition of cathepsin activity influences cell migration and invasion, we tested cells using Biocoat Matrigel invasion chambers (BD Biosciences) essentially as described (29). For invasion assays, we plated 2.5 × 10⁴ cells per well and assayed 36 h later, whereas, for migration assays, we used 2.5 × 10⁴ cells per well in Biocoat plates without Matrigel and determined cell numbers 12 h later. The inhibitors were added at different concentrations (0.33–20 μmol/L) in both top and bottom wells of the assay at the time the cells were added. All of the above-described experiments were repeated at least three times. CTSB inhibitor IV, CTSL inhibitor, CTSK inhibitor I were purchased from Calbiochem, whereas other CTSK inhibitors were provided by Dr. Johann Zimmermann (Novartis Pharma).
Statistical analyses
The BIDMC tissue samples were collected from breast cancer patients and patients who underwent breast reduction surgery. Some cancer patients had multiple lesions and also multiple blocks of the same lesion. Tissue samples of different lesions from the same patient were treated as independent samples in the analysis. For patients with more than one tissue sample of the same histology, one of the samples was randomly selected for analysis. Each of the patients with a normal interlobular tissue specimen also had a normal intralobular tissue specimen; thus, the comparison of CTSK expression levels in these two tissue types used a paired test (McNemar) to assess whether one of the two types of discrepancy was significantly more common than the other. McNemar’s test was also used to compare CTSK expression levels in the stroma and epithelium (when available in the same patient) and to compare CXCL14 expression levels in the stroma and epithelium (when available in the same patient). Few patients in the BIDMC data set had specimens from two or more of the other tissue types (legend of Table 1 show the numbers of patients who had each relevant combination), so the comparison of expression levels in these tissue types was unpaired, used Fisher exact tests, and was based on treating results from different tissue types in a single patient as independent. The distribution of the expression levels and the available data on CTSK and CXCL14 expression levels in stroma and epithelium for each tissue type are summarized in Table 1A and Supplementary Table S2. Except for CTSK expression in stroma, there were very few tumor samples with expression levels classified as ++ or +++ (as shown in Table 1A) and only these two categories were defined as positive. Therefore, no comparisons between tissue types were done for CTSK expression levels in epithelium, CXCL14 expression levels in stroma, or CXCL14 expression in epithelium. The Holmes correction was used to adjust for multiple comparisons of CTSK expression in stroma for various tissue types in the BIDMC data set.
Table 1.
Summary of CTSK and CXCL14 expression in all tissue types
| (A) Overall distribution of CTSK and CXCL14 in stroma and in epithelium by tissue types
| ||||||||||||||||
|---|---|---|---|---|---|---|---|---|---|---|---|---|---|---|---|---|
| Tissue types | CTSK in stroma
|
CTSK in epithelium
|
CXCL14 in stroma
|
CXCL14 in epithelium
|
||||||||||||
| − | + | ++ | +++ | − | + | ++ | +++ | − | + | ++ | +++ | − | + | ++ | +++ | |
| Benign (NP) | 5 | 8 | 4 | 3 | - | - | - | - | - | - | - | - | - | - | - | - |
| Benign (SA) | 5 | 7 | 5 | 3 | - | - | - | - | - | - | - | - | - | - | - | - |
| Benign (UDH) | 3 | 6 | 8 | 3 | - | - | - | - | - | - | - | - | - | - | - | - |
| Biopsy site | 0 | 0 | 4 | 16 | - | - | - | - | - | - | - | - | - | - | - | - |
| Normal (inter) | 4 | 9 | 7 | 0 | - | - | - | - | - | - | - | - | - | - | - | - |
| Normal (intra) | 1 | 8 | 11 | 0 | - | - | - | - | - | - | - | - | - | - | - | - |
| ADH | 8 | 5 | 4 | 0 | 15 | 0 | 1 | 0 | 2 | 12 | 3 | 0 | 10 | 4 | 2 | 0 |
| DCIS (low-intermediate) | 5 | 11 | 4 | 0 | 18 | 0 | 0 | 0 | 3 | 15 | 2 | 0 | 5 | 9 | 2 | 0 |
| DCIS (high) | 4 | 11 | 5 | 0 | 19 | 1 | 0 | 0 | 7 | 12 | 1 | 0 | 11 | 7 | 1 | 0 |
| Infiltrating ductal | 1 | 8 | 6 | 5 | 17 | 3 | 0 | 0 | 12 | 8 | 0 | 0 | 17 | 3 | 0 | 0 |
| Radial scar/CSL | 5 | 6 | 1 | 0 | 11 | 0 | 0 | 0 | 3 | 6 | 3 | 0 | 8 | 3 | 0 | 0 |
| Total | 41 | 79 | 59 | 30 | 80 | 4 | 1 | 0 | 27 | 53 | 9 | 0 | 51 | 26 | 5 | 0 |
| Total for common tissue types | 23 | 41 | 50 | 5 | 80 | 4 | 1 | 0 | 27 | 53 | 9 | 0 | 51 | 26 | 5 | 0 |
| (B) Associations between CTSK and CXCL14 expression levels in stroma or epithelium in various tissue types
| ||||||||||
|---|---|---|---|---|---|---|---|---|---|---|
| Comparisons | CTSK in stroma* |
CTSK in epithelium* |
CXCL14 in stroma* |
CXCL14 in epithelium* |
||||||
| Negative | Positive | P | Negative | Positive | Negative | Positive | Negative | Positive | ||
| Overall | 120 (58) | 89 (42) | — | 84 (99) | 1(1) | 80 (90) | 9 (10) | 77 (94) | 5 (6) | |
| 1 | DCIS (low-intermediate) | 16 (80) | 4 (20) | 1.00 | 18 (100) | 0 (0) | 18 (90) | 2 (10) | 14 (88) | 2 (13) |
| DCIS (high) | 15 (75) | 5 (25) | 20 (100) | 0 (0) | 19 (95) | 1 (5) | 18 (95) | 1 (5) | ||
| 2 | DCIS (low-intermediate and high) | 31 (78) | 9 (23) | 0.02 | 38 (100) | 0 (0) | 37 (93) | 3 (8) | 32 (91) | 3 (9) |
| Infiltrating ductal | 9 (45) | 11 (55) | 20 (100) | 0 (0) | 20 (100) | 0 (0) | 20 (100) | 0 (0) | ||
| 3 | DCIS (low-intermediate and high) | 31 (78) | 9 (23) | 1.00 | 38 (100) | 0 (0) | 37 (93) | 3 (8) | 32 (91) | 3 (9) |
| ADH | 13 (76) | 4 (24) | 15 (94) | 1 (6) | 14 (82) | 3 (18) | 14 (88) | 2 (13) | ||
| 4 | Benign (NP) | 13 (65) | 7 (35) | 0.07 | ||||||
| Benign (SA) | 12 (60) | 8 (40) | ||||||||
| Benign (UDH) | 9 (45) | 11 (55) | ||||||||
| Radial scar/CSL | 11 (92) | 1 (8) | ||||||||
| 5 | Benign, radial scar/CSL | 45 (63) | 27 (38) | 0.55 | ||||||
| Normal (inter and intra) | 22 (55) | 18 (45) | ||||||||
| 6 | Biopsy site | 0 (0) | 20 (100) | <0.0001 | ||||||
| Normal (inter and intra) | 22 (55) | 18 (45) | ||||||||
| 7 | Biopsy site | 0 (0) | 20 (100) | <0.0001 | ||||||
| DCIS, infiltrating ductal | 40 (17) | 20 (50) | ||||||||
| (C) CTSK expression levels in stroma between intralobular and interlobular tissue samples
| ||||
|---|---|---|---|---|
| Gene | Comparison | Intralobular > interlobular | Intralobular < interlobular | P |
| CTSK in stroma | Intralobular vs interlobular | 7 (78) | 2 (22) | 0.18 |
| (D) CTSK or CXCL14 expression levels in stroma and in epithelium
| ||||
|---|---|---|---|---|
| Gene | Comparison | Stroma > epithelium | Stroma < epithelium | P |
| CTSK | Stroma vs epithelium | 62 (98) | 1 (2) | <0.0001 |
| CXCL14 | Stroma vs epithelium | 28 (90) | 3 (10) | <0.0001 |
NOTE: (A) Tissue types with all the four expression levels analyzed, including ADH, DCIS (low-intermediate), DCIS (high), infiltrating ductal, and radial scar/CSL. (B) P values in bold were significant after correction for multiple comparisons. Tissue specimens with different histology but obtained from the same patient were considered independent results for statistical purposes. Three patients each contributed both DCIS (low-intermediate) and infiltrating ductal carcinoma, DCIS (low-intermediate) and ADH, and benign (SA) and benign (UDH), DCIS (low-intermediate), and biopsy site tissue samples. Six patients contributed both benign (NP) and benign (UDH) tissue samples; two patients contributed all three types of benign tissue samples, including NP, SA, and UDH; one patient contributed both benign (SA) and benign (NP), benign (NP), benign (UDH), and radial scar/CSL tissue samples. (C) All the percents in the table are calculated based on discrepancy pairs. (D) All the percentages in the table are calculated based on discrepant pairs. Only tissue samples with expression levels both in stroma and in epithelium available for a given gene were included.
Abbreviation: CSL, complex sclerosing lesions.
Values expressed as n (%).
The Korean data set (merged from two separate commercial sources) consisted of 217 patients, of which 146 were included in the analysis. Reasons for exclusion included male patients (4), T4 stage (7), lymph node metastasis (10), normal tissues (23), papillary carcinoma (10), DCIS (8), phyllodes tumors (6), postexcisional biopsy (1), and lack of gene expression levels (2). Not all patients had both CTSK and CXCL14 measured, and not all patients had the same prognostic factors recorded, so the sample sizes for the comparisons varied. Some patients had two replicate scores for a given gene expression level, and the higher score was used for analysis. Fisher’s exact test and a step-up logistic regression (using the likelihood ratio test) were used to assess the relationships between CTSK or CXCL14 expression levels and tumor and patient characteristics. As with the BIDMC data, CTSK expression levels were dichotomized for analysis as negative (including − and +) and positive (including ++ and +++). There were no tumor samples with +++ CXCL14 and very few tumor samples with CXCL14 in the ++ category; therefore, CXCL14 expression levels were dichotomized as positive (including +, ++, and +++) or negative for analysis. There were no corrections for multiple comparisons in the analysis of the Korean data set.
In the UMCC data set, a total of 141 patients had both CTSK expression levels and clinical data available. Among the 141 patients, 11 patients were excluded from the main analysis due to the following reasons: date of diagnosis was >1 month after date of surgery (4), inflammatory cancer (1), M1 stage (3), and T4 stage (3). Table 2 shows the overall distribution of CTSK expression levels in stroma and epithelium. As with the BIDMC data, the CTSK expression levels were dichotomized as negative (including − and +) or positive (including ++ and +++). To assess the association of tumor and patient characteristics on CTSK expression levels, Fisher’s exact test and a step-up logistic regression were used. For the analyses of RFS, the Kaplan-Meier curve estimate and a step-up Cox proportional hazards regression model were used. For both models, variable selection was based on the likelihood ratio test. There were no corrections for multiple comparisons in the analysis of the UMCC data set.
Table 2.
CTSK expression in invasive breast carcinomas
| − | + | ++ | +++ | Total | |
|---|---|---|---|---|---|
| CTSK in stroma | 31 (24) | 49 (38) | 41 (32) | 9 (7) | 130 (100) |
| CTSK in epithelium | 25 (19) | 45 (35) | 46 (35) | 14 (11) | 130 (100) |
NOTE: Overall distribution of CTSK expression levels in stroma and in epithelium. Values in table expressed as n (%).
Results and Discussion
Expression of cathepsins, cystatins, and CXCL14 in normal and neoplastic human breast tissue
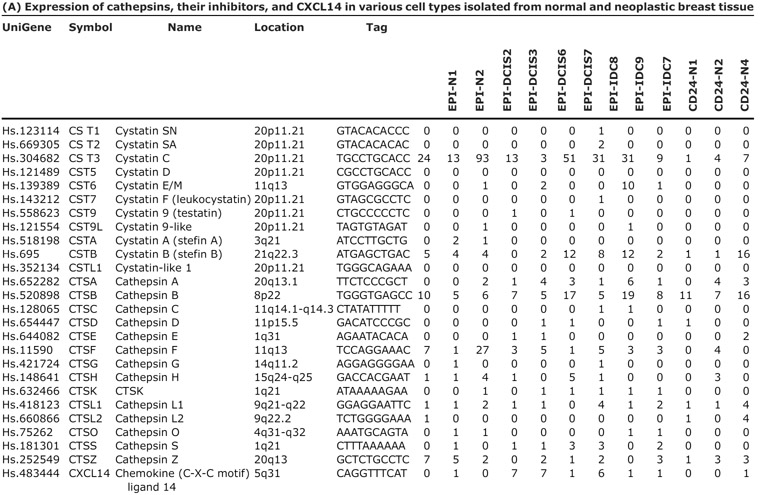
Based on our serial analysis of gene expression of different cell types composing normal breast tissue and in situ and invasive breast carcinomas, we found that several cathepsins (CTSB, CTSF, CTSK, and CTSL) and CXCL14 chemokine were dramatically up-regulated in DCIS myoepithelial cells compared with normal myoepithelium (4). In addition, myofibroblasts of both in situ and invasive carcinomas expressed several cathepsins at very high levels, whereas tumor epithelial cells were largely negative for most genes with the exception of CTSB, which was highly expressed in most cell types in tumors (Fig. 1A; Table 3A). Interestingly, among epithelial cells, only the CD44+ stem cell-like cells had significant CTSK and CXCL14 expression correlating with our prior data implying a role for these cells in invasion and angiogenesis (30). Besides cathepsins, several cysteine protease inhibitors including cystatin C were also up-regulated in DCIS-associated myoepithelial cells and myofibroblasts raising the possibility that alterations in cysteine protease balance in epithelial and various stromal cells composing the microenvironment may contribute to breast tumor progression by promoting invasion.
Fig. 1.

Expression of CXCL14, cathepsins, and cystatins in human breast tissue. A, dendogram depicting clustering of the indicated serial analysis of gene expression libraries based on the expression of the genes listed. Blue rectangle, high expression of CTSK and CXCL14 in DCIS-associated myoepithelial cells, myofibroblasts, and fibroblasts and in a subset of breast epithelial cells with stem-like phenotypes. B, Northern blot analysis of CTSB, CTSF, CTSK, and CTSL RNA levels in the indicated breast cancer cell lines and normal breast organoids. C, immunoblot analysis of CTSF, CTSL, and CTSK expression in the indicated breast cancer cell lines, normal organoids, and primary cultured normal breast (PBS) and breast tumor (PBTS) fibroblasts. CTSK expression is only detected in primary cultured breast stromal fibroblasts. The 37- and 25-kDa bands on the CTSK blot correspond to pro- and mature proteins, respectively, whereas in the case of CTSF and CTSL only mature peptides were detected on the gel. D, immunohistochemical analysis of CTSK expression in human DCIS and in xenografts derived from the MCFDCIS cell line. High CTSK expression is detected in stromal myofibroblasts in both cases.
Table 3.
Cathepsins and their inhibitors
 |
| (B) Summary of results of growth inhibition assays with various cathepsin inhibitors
| |||
|---|---|---|---|
| Cell line | CTSB inhibitor | CTSL inhibitor | CTSK inhibitor (A and B) |
| BT-549 | Inhibition of growth at 20 μmol/L | No response | ND |
| MDA-MB-231 | Inhibition of growth at 20 μmol/L | No response | ND |
| MDA-MB-435 | Inhibition of growth at 20 μmol/L | Morphologic changes at 10 μL | ND |
| MCF10DCIS | Inhibition of growth at 20 μmol/L | No response | No response |
| MCF10DCIS+stroma | Inhibition of growth at 20 μmol/L | No response | No response |
NOTE: (A) Gene names and symbols, serial analysis of gene expression tag numbers (normalized to 50,000) and sequence, UniGene IDs, and chromosomal location are indicated. CD24, CD44, and MUC1 refer to cells purified using these cell surface markers. (B) Cells, inhibitor used, concentration, and results are indicated.
Abbreviations: N, normal; D, DCIS; I, invasive; EPI, epithelial cells; MYOEPI, myoepithelial cells; MYOFIB, myofibroblasts; STR, stromal fibroblasts; ND, not determined.
To test this hypothesis, we had to identify suitable models of human breast cancer. Thus, we first analyzed the expression of CTSB, CTSF, CTSK, and CTSL in human breast cancer cell lines, freshly isolated (uncultured) organoids, and primary cultured fibroblasts derived from normal breast tissue and breast carcinomas (Fig. 1B and C; Supplementary Table S1). Correlating with our serial analysis of gene expression data in primary human breast tissue samples, CTSB and CTSL were highly expressed in most breast cancer cell lines, whereas no significant expression of CTSF and CTSK were detected in most of the cell lines tested (Fig. 1B). We also analyzed several breast cell lines and primary cultured breast stromal fibroblasts by immunoblot to correlate mRNA levels with protein levels and activation status. Correlating with the Northern blot data, CTSF and CTSL were expressed in most cells, whereas high CTSK protein levels were only detected in primary cultured fibroblasts derived from normal and neoplastic breast tissue (Fig. 1C). The restricted expression of CTSK to breast stromal fibroblasts was also confirmed by immunohistochemical analysis of human primary DCIS and xenografts derived from the MCFDCIS cell line (Fig. 1D; ref. 31).
Effect of cathepsin inhibitors on cell proliferation, survival, migration, and invasion
To begin dissecting the functional relevance of high cathepsin expression in breast tumor epithelial and stromal cells, we analyzed the effect of several cathepsin inhibitors on the proliferation, migration, and invasion of breast cancer cell lines selected based on their expression pattern of the various cathepsins. Proliferation assays were done in both two-dimensional and three-dimensional conditions; in the latter case, the cells were embedded in Matrigel. We found that high concentration (20 μmol/L) of cathepsin B inhibitor inhibited the growth of all cell lines tested, whereas lower doses had no discernable effect. CTSL inhibition did not have an effect on cell proliferation at any concentration tested, but at 10 μmol/L it appeared to alter the morphology of MDA-MB-435 cells growing in Matrigel (Fig. 2A) potentially by reducing the invasiveness of the cells. To test this hypothesis, we analyzed the effect of cathepsin B and L inhibitors on the migration and invasion of MDA-MB-435 cells at a concentration that did not affect cellular proliferation in three-dimensional cultures. Neither inhibitor had significant effect on cell migration, but both very potently inhibited invasion through Matrigel (Fig. 2B), suggesting that up-regulation of cathepsin B and L expression in breast tumor cells may promote their ability to degrade extracellular matrix and enhance their invasive and metastatic behavior.
Fig. 2.

Effect of cathepsin inhibitors on breast cancer cells. A, three-dimensional growth of MDA-MB-435 cells in Matrigel in the presence and absence of CTSB or CTSL inhibitors used at the indicated concentration. MDA-MB-435 cancer cells grow in a highly invasive, branching pattern in Matrigel. Addition of CTSB inhibitor at 2 μmol/L concentration did not influence the cells, whereas at 20 μmol/L it dramatically inhibited their growth. CTSL inhibitor at 10 μmol/L concentration inhibits the branching growth of the cells. B, quantitative summary of migration and invasion assays determined in the presence and absence of CTSB or CTSL inhibitors used at the concentration indicated. Y axis, number of cells migrating or invading through the membrane/well. Numbers, representative experiment done in triplicate. Bars, SD. The experiment was repeated three times with identical results. C, growth of MCFDCIS cells in Matrigel alone or cocultured with breast stromal fibroblasts (+PBS). Image was acquired on day 8 of the culture. The cells alone form spheroid-like structures with occasional branching, whereas coculturing with fibroblasts dramatically enhanced branching growth. D, migration and invasion of green fluorescence protein – positive MCFDCIS cells alone or cocultured with fibroblasts (+PBS) in the presence or absence of CTSK inhibitors used at the indicated concentrations. Representative experiment done in triplicate. Left, actual images of the cells; right, quantitative summary of the invasion assays shown in the photos. Y axis, number of cells invading through the membrane/well. Numbers, representative experiment done in triplicate. Bars, SD. The experiment was repeated three times with essentially the same results.
CTSK was not expressed in any of the breast cancer cell lines we tested, but it was highly expressed in primary cultured breast stromal fibroblasts (Fig. 1B) similar to what we observed in the majority of primary breast tumors. This expression pattern raised the hypothesis that CTSK may influence tumor epithelial cell behavior via paracrine interactions. To test this hypothesis, we cocultured CTSK-expressing breast stromal fibroblasts with MCFDCIS cells (31, 32), a noninvasive breast cancer cell line in Matrigel. Coculturing MCFDCIS cells with breast stromal fibroblasts dramatically altered the morphology of the cells (Fig. 2C). MCFDCIS cells embedded in Matrigel formed small round acini, and only at later time points (after 8 days in culture), we observed occasional branching. Embedding MCFDCIS cells together with breast stromal fibroblasts resulted in the outgrowth of extensively branched structures (Fig. 2C). This observation suggested that fibroblasts may enhance the invasiveness of MCFDCIS cells or alter the morphology of the forming structures and CTSK expressed in the fibroblasts may play a role in this process.
To test the hypothesis that fibroblasts enhance epithelial cell invasion, we did migration and invasion assays using MCFDCIS cells and breast fibroblasts. We infected the MCFDCIS cells with an adenovirus expressing green fluorescence protein for these assays to be able to differentiate between the two cell types. Coculture with breast fibroblasts significantly enhanced the invasion of MCFDCIS cells but had no significant effects on their migration (Fig. 2D). Addition of CTSK inhibitors had no effect on the migration of the cells but dramatically reduced the invasion promoting effect of breast fibroblasts on MCFDCIS cells (Fig. 2D and E). The proliferation of MCFDCIS cells was not affected by the CTSK inhibitors used at a concentration that inhibited invasion in cocultures (Supplementary Fig. S1).
In summary, these results implied that stromal CTSK expression may play a role in breast tumor progression by promoting invasion, and as a consequence of this, it may influence the clinical outcome of breast cancer patients.
CTSK and CXCL14 expression in normal, benign, and malignant breast lesions
To determine the expression of CTSK in breast tumor progression, we analyzed its expression in normal breast (interlobular and intralobular stroma), in various benign lesions including usual ductal hyperplasia (UDH), sclerosing adenosis (SA), nonproliferative disease (NP), radial scar, biopsy sites, and in ADH, DCIS, and invasive and metastatic breast carcinomas from the BIDMC data set (Supplementary Table S2). We also analyzed CXCL14 expression in some of the tissue samples, including ADH, DCIS, radial scar, and infiltrating ductal, because our serial analysis of gene expression data indicated that CXCL14 and CTSK are coexpressed in the same tumor and cell types (Fig. 1A; Table 1A). The associations between CTSK expression levels in stroma and tissue types are summarized in Table 1B; representative images of immunohistochemical results are in Fig. 3A and B (No tests were done for CTSK expression in epithelium or CXCL14 expression in either stroma or epithelium because of the paucity of positive levels for these cases.).
Fig. 3.

Immunohistochemical analysis of CTSK and CXCL14 expression in human breast tissue samples. A, CTSK expression in normal breast and in various benign and malignant breast lesions. B, CXCL14 expression in DCIS and invasive breast carcinoma. In the majority of DCIS, only stromal and myoepithelial staining was observed, but in some tumors the epithelial cells expressed high levels of CXCL14. C, CTSK expression in primary invasive tumor and matched distant metastases.
No significant difference was found in stromal CTSK levels between high-grade and low-to-intermediate-grade DCIS. Infiltrating ductal carcinoma samples were more likely to have positive CTSK expression levels in the stroma than DCIS samples, but this was only marginally significant (P = 0.02; the cutoff after correcting for multiple comparisons would be 0.0071), although significant difference was found when expression levels were categorized into four categories (P = 0.004). No significant difference was found in CTSK positivity between DCIS and ADH tumor samples (Table 1B). Among benign lesions, UDH had the highest percentage of positive CTSK expression levels, whereas radial scar had the lowest percentage, but the percentages of positivity among the four benign lesions were not statistically significantly different (P = 0.07). Comparison of all four types of benign tissue samples with normal tissues (including interlobular and intralobular stroma) was not significant (P = 0.55). In contrast, CTSK expression levels in biopsy site tissue samples were significantly (P < 0.0001) more likely to be positive than in normal tissue samples (including interlobular stroma and intralobular stroma). CTSK expression was always positive in biopsy sites, whereas 55% of normal tissue samples were negative. Similarly, CTSK was significantly (P < 0.0001) more likely to be positive in tissue from biopsy sites compared with DCIS and invasive breast tumors. CTSK expression in biopsy sites was always positive, whereas only 33% of DCIS and infiltrating ductal carcinomas were positive. The expression of CTSK in the stroma of biopsy sites indicates the recruitment of CTSK+ myofibroblasts to the tissue injury and a potential role for CTSK in tissue remodeling and wound healing via modulation of extracellular matrix degradation and angiogenesis.
Next, we compared CTSK expression levels (divided into the four categories: −, +, ++, and +++) between interlobular stroma and intralobular stroma within tissue samples from the same patient (Table 1C). Nine patients had discordant expression of CTSK between interlobular and intralobular stroma. Among these 9 cases, there were 7 (78%) patients with higher CTSK expression levels in the intralobular stroma and 2 (22%) patients with higher CTSK expression levels in the interlobular stroma, but this difference was not statistically significant (P = 0.18). We also tested if the expression levels of CTSK and CXCL14 (each divided into four categories) were different between stromal and epithelial cells within the same tissue sample to determine if their expression in the different cell types is coregulated. Among all tissue specimens analyzed, 85 samples had CTSK expression levels determined both in the stroma and in the epithelium. Among the 63 discrepant pairs, 62 (98%) had significantly (P < 0.0001) higher CTSK expression levels in the stroma than in the epithelium (Table 1D). Eighty-two tissue samples had CXCL14 expression levels both in the stroma and in the epithelium. Among the 31 discrepant pairs, 28 (90%) had higher CXCL14 expression levels in the stroma than in the epithelium, and this difference was also highly significant (P < 0.0001).
Finally, we compared the expression of CTSK in matched primary tumors and distant metastases. Interestingly, high CTSK expression was observed in the stroma of the primary tumor and bone metastasis, whereas liver metastases were essentially negative for CTSK expression (Fig. 3B). These results are consistent with the proposed role of CTSK in osteolytic breast cancer bone metastases (13).
In summary, CTSK expression in the stroma was frequently detected (at a + or ++ level) in various specimens of normal breast tissue and benign and malignant breast lesions (42% overall). CXCL14 expression in the stroma was seldom detected at this level (10% of specimens). The majority of CTSK and CXCL14-positive stromal cells were myofibroblasts, whereas a subset of DCIS-associated myoepithelial cells and leukocytes showed variable expression. Epithelial CTSK expression was rarely detected in invasive ductal carcinomas, whereas CXCL14 was expressed in the epithelial cells of a subset of DCIS and ADH tumors.
Associations between CTSK or CXCL14 expression and patient and tumor characteristics and clinical outcome
To determine if the expression of CTSK or CXCL14 correlates with clinical outcome, we did immunohistochemical analysis for invasive breast tumors with clinical follow-up data in the UMCC and the Korea data sets. Among the 146 patients included in the analysis for the Korea data set, 111 and 65 had CTSK and CXCL14 expression levels analyzed, respectively. The CTSK expression levels in stroma were dichotomized as being negative (− or +) or positive (++ or +++). When using the Fisher’s exact test to assess the relationships between CTSK expression levels and tumor and patient characteristics, T stage (P = 0.02) and estrogen receptor (ER) status (P = 0.05) were significantly associated with CTSK positivity (Supplementary Table S3). Patients with T1 stage tumors were more likely to be negative for CTSK than patients with T2/T3 stage, whereas ER-negative tumors were more likely to be positive for CTSK than were ER-positive tumors. In the Korean data set, 18% of the 22 patients with T1 tumors had positive CTSK in stroma versus 52% of the 87 patients with T2 or T3 tumors. In the UMCC data set, 37% of the 70 patients with T1 tumors had positive CTSK in stroma versus 41% in the 59 patients with T2 or T3 tumors. In the Korean data set, 37% of the 60 ER-positive patients had positive CTSK in stroma versus 57% of the 51 ER-negative and unknown patients. In the UMCC data set, 38% of the 81 ER-positive patients had positive CTSK in stroma versus 34% of the 44 ER-negative patients. The differences between the two cohorts analyzed with respect to CTSK expression in tumor stage and hormone receptor status could potentially be due to differences in ethnicity and/or age. The evaluation of larger independent data sets would be necessary to determine if either of these variables could influence CTSK expression.
In the step-up logistic models for CTSK expression levels, T1 stage was the most significant covariate to add to the model (P = 0.002, after adjusting for T stage unknown). With T1 stage in the model, no other variable (including ER status) added significantly to this model. When including all the possible covariates in the logistic model, T1 was still significantly associated with CTSK expression levels (P = 0.01), but ER status was not.
The CXCL14 levels were dichotomized as completely negative (−) versus positive at any level (+, ++, or +++). There was no significant association between this categorization of CXCL14 expression levels and tumor and patient characteristics using Fisher’s exact test. The variable closest to significant was overall tumor stage; patients with stage III breast cancer were less likely to be completely negative for CXCL14 expression than stage I/II breast cancer patients (P = 0.13).
In the UMCC data set, there were 38% and 46% of patients with positive CTSK expression levels (defined as ++ or +++) in the stroma and in the epithelium, respectively. There was no significant association between CTSK expression and patient characteristics using Fisher’s exact test (Supplementary Table S4). In the step-up logistic models for CTSK expression levels in the stroma, N stage II/III was the covariate closest to significant (P = 0.07, after adjusting for N stage unknown). Patients with N stage II/III were less likely to have CTSK-positive stroma. As for CTSK expression levels in the epithelium, the covariate closest to significant was lobular or mixed lobular and ductal histology (P = 0.09). Patients with lobular or mixed lobular and ductal histology were less likely to have positive CTSK in epithelium than were patients with pure ductal or other histology. However, none of the above was statistically significant.
To determine if CTSK expression in the stroma or in the epithelium influences clinical outcome, we analyzed the association between CTSK levels and RFS in the UMCC data set (which had an overall median RFS of 107 months, with 72 RFS events and 55 patients with censored RFS) using a step-up Cox proportional hazards model. The covariates significantly associated with longer RFS, in the order added to the model, were age at diagnosis 48 to 59 years (the second quartile), disease stage I or II (versus III), prior radiotherapy, and progesterone receptor positive (see Supplementary Table S5). Neither CTSK expression level in stroma nor CTSK expression level in epithelium was significantly associated with RFS, although there were enough failures to have ~80% power to detect a hazard ratio of ~2.2 for each of these variables (Supplementary Table S6).
We also analyzed the relationship between overall survival (defined as time from diagnosis to death) and CTSK expression levels in the UMCC data set by using the log-rank test. The median overall survival was 122 months among the 127 patients with survival data available. No significant association was found (P = 0.51 and 0.75 for dichotomized CTSK in stroma and epithelium, respectively). Of the 127 patients with survival data available, 73 had died; 34 died of breast cancer, whereas 39 died of other causes. More than 50% of the deaths were due to reasons other than breast cancer.
Conclusions
The results of our study show that stromal CTSK expression promotes breast tumor epithelial cell invasion in vitro. In human breast tissues, stromal CTSK expression is elevated in association with invasive ductal carcinomas when compared with DCIS, underscoring the role of CTSK as a paracrine tumor progression factor. Furthermore, CTSK-positive stroma was associated with a higher tumor stage and a negative ER status, two features associated with worse clinical outcome. Based on these data, we hypothesize that CTSK-positive stromal fibroblasts may play a role in breast tumor progression by promoting extracellular matrix degradation and angiogenesis and by increasing the invasiveness of neighboring tumor epithelial cells. Thus, CTSK inhibitors may offer a novel therapeutic option to decrease breast tumor progression.
Acknowledgments
Grant support: National Cancer Institute SPORE in Breast Cancer grant CA89393 and Dana-Farber/Harvard Cancer Center grant CA006516 (S.J. Schnitt, R. Gelman, Y-H. Chen, and K. Polyak); Department of Defense grant W8IXWH-04-1-0452, National Cancer Institute grant CA116235, and American Cancer Society grant RSG-05-154-01-MGO (K. Polyak); Susan G. Komen Foundation fellowship (M. Hu); Department of Defense grant BCO30054 (P. Argani); and National Cancer Institute grants CA107469 and CA090876 (C.G. Kleer).
We thank Diana Calogrias for help with the acquisition of human tissue samples, Beatriz Feldstein for assistance in the immunohistochemical scoring and recording, and Dr. Johann Zimmermann (Novartis) for providing CTSK inhibitors and for recommendation of antibodies.
Footnotes
Note: Supplementary data for this article are available at Clinical Cancer Research Online (http://clincancerres.aacrjournals.org/).
Disclosure of Potential Conflicts of Interest
K. Ployak has received a commercial research grant from Novartis and is a Novartis consultant.
References
- 1.Bissell MJ, Rizki A, Mian IS. Tissue architecture: the ultimate regulator of breast epithelial function. Curr Opin Cell Biol. 2003;15:753–62. doi: 10.1016/j.ceb.2003.10.016. [DOI] [PMC free article] [PubMed] [Google Scholar]
- 2.Weinberg R, Mihich E. Eighteenth Annual Pezcoller Symposium: tumor microenvironment and heterotypic interactions. Cancer Res. 2006;66:11550–3. doi: 10.1158/0008-5472.CAN-06-3149. [DOI] [PubMed] [Google Scholar]
- 3.Tlsty TD. Stromal cells can contribute oncogenic signals. Semin Cancer Biol. 2001;11:97–104. doi: 10.1006/scbi.2000.0361. [DOI] [PubMed] [Google Scholar]
- 4.Allinen M, Beroukhim R, Cai L, et al. Molecular characterization of the tumor microenvironment in breast cancer. Cancer Cell. 2004;6:17–32. doi: 10.1016/j.ccr.2004.06.010. [DOI] [PubMed] [Google Scholar]
- 5.Hu M, Yao J, Cai L, et al. Distinct epigenetic changes in the stromal cells of breast cancers. Nat Genet. 2005;37:899–905. doi: 10.1038/ng1596. [DOI] [PubMed] [Google Scholar]
- 6.Dvorak HF. Tumors: wounds that do not heal. Similarities between tumor stroma generation and wound healing. N Engl J Med. 1986;315:1650–9. doi: 10.1056/NEJM198612253152606. [DOI] [PubMed] [Google Scholar]
- 7.Jedeszko C, Sloane BF. Cysteine cathepsins in human cancer. Biol Chem. 2004;385:1017–27. doi: 10.1515/BC.2004.132. [DOI] [PubMed] [Google Scholar]
- 8.Gocheva V, Zeng W, Ke D, et al. Distinct roles for cysteine cathepsin genes in multistage tumorigenesis. Genes Dev. 2006;20:543–56. doi: 10.1101/gad.1407406. [DOI] [PMC free article] [PubMed] [Google Scholar]
- 9.Abrahamson M, Alvarez-Fernandez M, Nathanson CM. Cystatins. Biochem Soc Symp. 2003;70:179–99. doi: 10.1042/bss0700179. [DOI] [PubMed] [Google Scholar]
- 10.Joyce JA, Baruch A, Chehade K, et al. Cathepsin cysteine proteases are effectors of invasive growth and angiogenesis during multistage tumorigenesis. Cancer Cell. 2004;5:443–53. doi: 10.1016/s1535-6108(04)00111-4. [DOI] [PubMed] [Google Scholar]
- 11.Bell-McGuinn KM, Garfall AL, Bogyo M, Hanahan D, Joyce JA. Inhibition of cysteine cathepsin protease activity enhances chemotherapy regimens by decreasing tumor growth and invasiveness in a mouse model of multistage cancer. Cancer Res. 2007;67:7378–85. doi: 10.1158/0008-5472.CAN-07-0602. [DOI] [PubMed] [Google Scholar]
- 12.Saftig P, Hunziker E, Wehmeyer O, et al. Impaired osteoclastic bone resorption leads to osteopetrosis in cathepsin-K-deficient mice. Proc Natl Acad Sci U S A. 1998;95:13453–8. doi: 10.1073/pnas.95.23.13453. [DOI] [PMC free article] [PubMed] [Google Scholar]
- 13.Le Gall C, Bellahcene A, Bonnelye E, et al. A cathepsin K inhibitor reduces breast cancer induced osteolysis and skeletal tumor burden. Cancer Res. 2007;67:9894–902. doi: 10.1158/0008-5472.CAN-06-3940. [DOI] [PubMed] [Google Scholar]
- 14.Vasiljeva O, Reinheckel T, Peters C, Turk D, Turk V, Turk B. Emerging roles of cysteine cathepsins in disease and their potential as drug targets. Curr Pharm Des. 2007;13:387–403. doi: 10.2174/138161207780162962. [DOI] [PubMed] [Google Scholar]
- 15.Vasiljeva O, Turk B. Dual contrasting roles of cysteine cathepsins in cancer progression: apoptosis versus tumour invasion. Biochimie. 2008;90:380–6. doi: 10.1016/j.biochi.2007.10.004. [DOI] [PubMed] [Google Scholar]
- 16.Littlewood-Evans AJ, Bilbe G, Bowler WB, et al. The osteoclast-associated protease cathepsin K is expressed in human breast carcinoma. Cancer Res. 1997;57:5386–90. [PubMed] [Google Scholar]
- 17.Frederick MJ, Henderson Y, Xu X, et al. In vivo expression of the novel CXC chemokine BRAK in normal and cancerous human tissue. Am J Pathol. 2000;156:1937–50. doi: 10.1016/S0002-9440(10)65067-5. [DOI] [PMC free article] [PubMed] [Google Scholar]
- 18.Ozawa S, Kato Y, Komori R, Maehata Y, Kubota E, Hata R. BRAK/CXCL14 expression suppresses tumor growth in vivo in human oral carcinoma cells. Biochem Biophys Res Commun. 2006;348:406–12. doi: 10.1016/j.bbrc.2006.07.070. [DOI] [PubMed] [Google Scholar]
- 19.Schwarze SR, Luo J, Isaacs WB, Jarrard DF. Modulation of CXCL14 (BRAK) expression in prostate cancer. Prostate. 2005;64:67–74. doi: 10.1002/pros.20215. [DOI] [PubMed] [Google Scholar]
- 20.Shurin GV, Ferris RL, Tourkova IL, et al. Loss of new chemokine CXCL14 in tumor tissue is associated with low infiltration by dendritic cells (DC), while restoration of human CXCL14 expression in tumor cells causes attraction of DC both in vitro and in vivo. J Immunol. 2005;174:5490–8. doi: 10.4049/jimmunol.174.9.5490. [DOI] [PubMed] [Google Scholar]
- 21.Starnes T, Rasila KK, Robertson MJ, et al. The chemokine CXCL14 (BRAK) stimulates activated NK cell migration: implications for the downregulation of CXCL14 in malignancy. Exp Hematol. 2006;34:1101–5. doi: 10.1016/j.exphem.2006.05.015. [DOI] [PubMed] [Google Scholar]
- 22.Shellenberger TD, Wang M, Gujrati M, et al. BRAK/CXCL14 is a potent inhibitor of angiogenesis and a chemotactic factor for immature dendritic cells. Cancer Res. 2004;64:8262–70. doi: 10.1158/0008-5472.CAN-04-2056. [DOI] [PubMed] [Google Scholar]
- 23.Meuter S, Schaerli P, Roos RS, et al. Murine CXCL14 is dispensable for dendritic cell function and localization within peripheral tissues. Mol Cell Biol. 2007;27:983–92. doi: 10.1128/MCB.01648-06. [DOI] [PMC free article] [PubMed] [Google Scholar]
- 24.Nara N, Nakayama Y, Okamoto S, et al. Disruption of CXC motif chemokine ligand-14 in mice ameliorates obesity-induced insulin resistance. J Biol Chem. 2007;282:30794–803. doi: 10.1074/jbc.M700412200. [DOI] [PubMed] [Google Scholar]
- 25.Takahashi M, Takahashi Y, Takahashi K, et al. CXCL14 enhances insulin-dependent glucose uptake in adipocytes and is related to high-fat diet-induced obesity. Biochem Biophys Res Commun. 2007;364:1037–42. doi: 10.1016/j.bbrc.2007.10.120. [DOI] [PubMed] [Google Scholar]
- 26.Kleer CG, Cao Q, Varambally S, et al. EZH2 is a marker of aggressive breast cancer and promotes neoplastic transformation of breast epithelial cells. Proc Natl Acad Sci U S A. 2003;100:11606–11. doi: 10.1073/pnas.1933744100. [DOI] [PMC free article] [PubMed] [Google Scholar]
- 27.Porter DA, Krop IE, Nasser S, et al. A SAGE (serial analysis of gene expression) view of breast tumor progression. Cancer Res. 2001;61:5697–702. [PubMed] [Google Scholar]
- 28.Porter D, Lahti-Domenici J, Keshaviah A, et al. Molecular markers in ductal carcinoma in situ of the breast. Mol Cancer Res. 2003;1:362–75. [PubMed] [Google Scholar]
- 29.Muller A, Homey B, Soto H, et al. Involvement of chemokine receptors in breast cancer metastasis. Nature. 2001;410:50–6. doi: 10.1038/35065016. [DOI] [PubMed] [Google Scholar]
- 30.Shipitsin M, Campbell LL, Argani P, et al. Molecular definition of breast tumor heterogeneity. Cancer Cell. 2007;11:259–73. doi: 10.1016/j.ccr.2007.01.013. [DOI] [PubMed] [Google Scholar]
- 31.Miller FR, Santner SJ, Tait L, Dawson PJ. MCF10DCIS com xenograft model of human comedo ductal carcinoma in situ [letter] J Natl Cancer Inst. 2000;92:1185–6. doi: 10.1093/jnci/92.14.1185a. [DOI] [PubMed] [Google Scholar]
- 32.Miller F. Xenograft models of premalignant breast disease. J Mammary Gland Biol Neoplasia. 2000;5:379–91. doi: 10.1023/a:1009577811584. [DOI] [PubMed] [Google Scholar]