Abstract
Combining matrix-assisted laser desorption/ionization (MALDI) mass spectrometry with ion-mobility (IM) results in the fast sorting of biomolecules in complex mixtures along trend lines. In this 2D analysis of biological families, lipids, peptides, and nucleotides are separated from each other by differences in their ion mobility drift times in a timescale of hundreds of microseconds. Molecular ions of similar chemical type fall along trend lines when plotted in two-dimensional plots of ion mobility drift time as a function of m/z. In this study, MALDI-IM MS is used to analyze species from all of the major phospholipid classes. Complex samples including tissue extracts and sections were probed to demonstrate the effects that radyl chain length, degree of unsaturation, and class/head group have upon an ion’s cross section in the gas-phase. We illustrate how these changes can be used to identify individual lipid species in complex mixtures, as well as the effects of cationization on ion cross section and ionization efficiency.
INTRODUCTION
Lipidomics is a rapidly emerging field of study in the biological sciences, particularly neuroscience (1,2). Phospholipids are a major lipid group found in abundance in biological membranes and represent over half of the lipid content of the brain (3). In the current study, Ion- Mobility orthogonal Time-of-Flight Mass Spectrometry (IM-MS) is used to characterize the effect of phospholipids’ head and radyl groups on their mobility. In IM-MS, ions formed by the matrix-assisted laser desorption/ionization (MALDI) process enter the electric field of a gas-filled mobility drift cell region where they acquire an average drift velocity based on their collision cross section (Ω) to charge ratio, thus allowing the separation of molecules according to their conformation (4–8). We have previously demonstrated that IM-MS separates biomolecules along trend lines according to their composition, thus allowing the assignments of the ions’ chemical types based on their specific m/z and mobility drift time (8). In addition, IM-MS allows the elimination of chemical noise which improves accuracy. It also permits the elucidation of minute differences between analytes from the same or other biochemical families.
IM-MS is a powerful tool for the analysis of a variety of compounds such as explosives, drugs, noncovalent complexes, biological mixtures and tissue sections. (9–12). Combining MALDI-MS with ion-mobility (IM) results in fast 2D analysis of biological families (6,7). Lipids, peptides and nucleotides in a complex mixture, are separated and sorted by the difference in their IM drift times, along familial trend lines (7,13). Ions of similar chemical types fall along trend lines plotted in two-dimensional graphs of ion mobility drift time as a function of m/z. The peptide trend line is sandwiched between the slower mobility of the hydrophobic lipids and the faster mobility of the hydrophilic oligonucleotides.
Recently, the use of MALDI for lipid characterization from mixtures and tissue sections has grown significantly (14–16). Altered levels of phospholipids are found in many pathological conditions such as Alzheimer Disease, Down syndrome, diabetes, and Stargardt disease-3 macular dystrophy (17–20). In this study, MALDI-IM MS was used to analyze species from all of the major phospholipid classes including phosphatidylcholine (PC), phosphatidylethanolamine (PE), phosphatidylserine (PS), phosphatidylinositols (PI), phosphatidylglycerol (PG), phosphatidic acid (PA) and from sphingomyelin (SM). Complex samples including tissue extracts and sections were probed. Traditionally, mixtures of phospholipids are separated based upon radyl chain length, degree of unsaturation, or class using high performance liquid chromatography (HPLC) or thin-layer chromatography (TLC) prior to mass analysis(21,22). Both of these methods are time-consuming when compared to IM, in which separation occurs in hundreds of microseconds, and are not applicable to tissue imaging (23). In this work, we studied the effects that radyl chain length, degree of unsaturation, and class/head group have upon an ion’s collision cross section in the gas-phase and how these changes can be used to help identify individual species in complex mixtures. Additionally, the effects of cationization on collision cross section and on ionization efficiency were probed, particularly for direct tissue analysis; the results of these experiments are listed below.
MATERIAL AND METHODS
Mass Spectrometer
Data were acquired with a periodic focusing MALDI-IM-TOFMS instrument in positive ion mode (Ionwerks Inc., Houston, TX). A mobility resolution of 30 (FWHM of drift time) and a mass resolution of 3000 for m/z 1000 using an orthogonal time-of-flight mass spectrometer (o-TOFMS) are routinely achieved on calibration standards. The length of the mobility cell is 15 cm. It is operated at 1700 V with 3.5 torr helium pressure. An X-Y sample stage (National Aperture Inc, folded micro-stage, model MM-3M-F-2) provides 1 µm accuracy in beam positioning and sample scanning. An Nd:YLF UV laser (Crystalaser, λ = 349 nm at 200 Hz) is used to generate ions in the source at the operating pressure of the mobility cell. The mobility separation of lipids took hundreds of microseconds, while the total signal accumulation lasted from 0.5 – 2 minutes according to analyte concentration.
Data is presented as 2D contour plots of ion intensity as a function of drift time (y-axis) and m/z (x-axis). In addition, the derived 1D ion mobility spectrum and 1D mass spectrum for each MALDI-IM spectrum are also included. In the 2D contour plots of drift time versus m/z, compounds that have the same molecular weight but different structures are observed along ion groupings which have different slopes. The values reported for the m/z and drift time for individual lipid species are based upon a centroid calculation of the (boxcar-averaged) smoothed 2D signal, giving the center-of-mass for a particular 2D ion intensity distribution. All contour plots were produced using IDL software (Research Systems, Boulder, CO).
Lipid Extracts
The following lipid extracts: PAs from chicken egg, PCs from porcine brain, PCs from soy, PEs from porcine brain, PGs from chicken egg, PIs from bovine liver, PSs from porcine brain, and SMs from porcine brain and two synthetic lipid species PC 36:2(18-1/18-1) and PE 36:2a (18-1/18-1) were purchased from Avanti Polar Lipids (Alabaster, AL). Stock solutions of the lipids were prepared in chloroform:methanol (2:1 v/v) at a concentration of 10 nmol/uL.
Matrix
Cesium chloride was dissolved in 50% ethanol at a concentration of 10mM. 2,6-dihydroxyacetophenone, DHA and 2,5-dihydroxybenzoic acid; DHB were prepared in 50% ethanol or 10 mM CsCl in 50% ethanol at a concentration of 30 mg/mL.
Tissue Sectioning and Handling
Experiments were conducted under a protocol approved by the Animal Care and Use Committee of the National Institute on Drug Abuse Intramural Research Program. Male Sprague-Dawley rats (Harlan Industries, Indianapolis, IN) between 300 and 420 g were euthanized by an intraperitoneal injection of sodium pentobarbital (> 65 mg/kg). Brains were removed quickly from the skull and frozen in dry ice-chilled isopentane for 15 seconds, prior to storage at −80°C. The frozen brain tissue was cut into thin sections (16 µm thickness) in a cryostat (CM 3050 S; Leica Microsystems Nussloch GmbH, Nussloch, Germany) and placed onto a MALDI sample plate. This procedure has been described in detail previously (13).
Sample Preparation
Lipid extracts were diluted to a specific concentration in matrix solution prior to being spotted on the sample target. For direct tissue analysis, 0.5 µL of matrix solution was deposited directly on the section and allowed to air-dry prior to insertion into the mass spectrometer.
Lipid Assignment
In this work, PC, PI, PS, PA, and PG species number equals the total length and number of double bonds of both radyl chains, while SM species number corresponds to the length and number of double bonds of the acyl chain attached to the sphingosine base. PE species number equals the total length and number of both radyl chains with “a” representing 1,2 diacyl species and “p” representing a 1-O-(1’-alkenyl)-2-acyl (plasmalogen) species.
RESULTS
Effects of Radyl Substituents on Ion Mobility
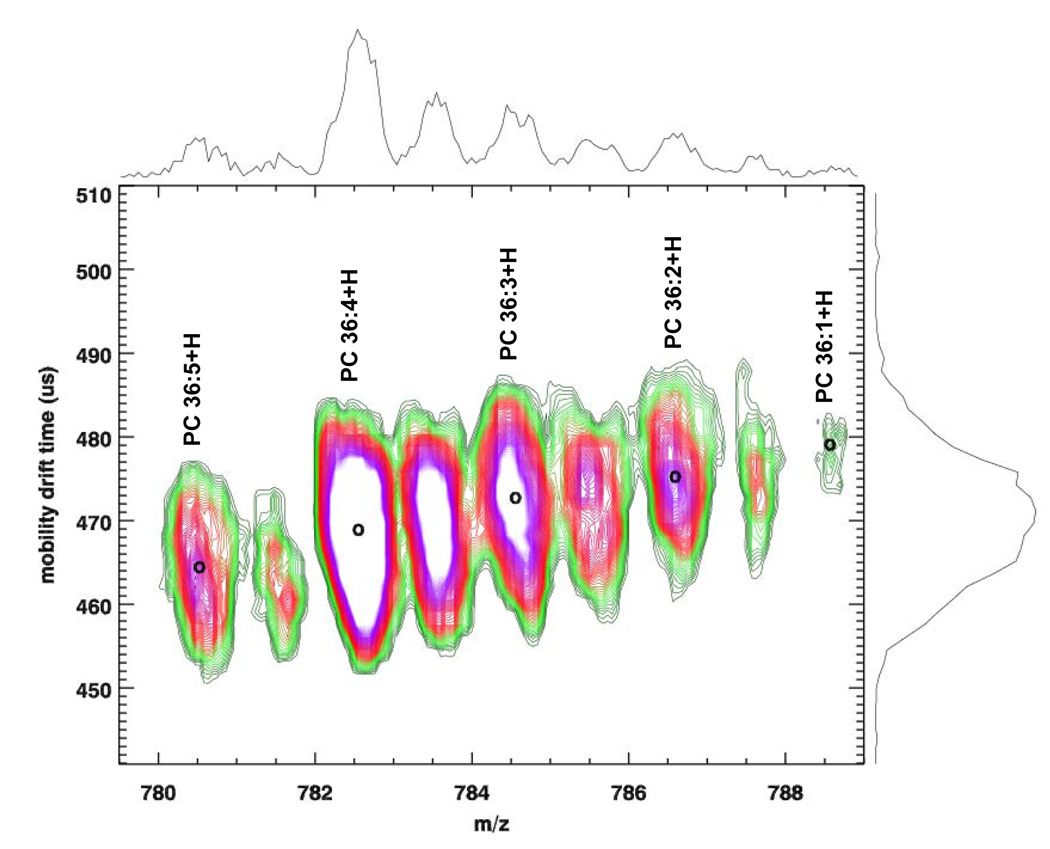
Separation of lipids by reverse phase (RP)-HPLC is based on their radyl chain length and degree of unsaturation (21,22). Figure 1a illustrates a MALDI-IM MS spectrum of 100 pmol of soy PC extract in positive ion mode with DHA matrix. In this spectrum, a series of PC species are shown in which the number of double bonds of the acyl chain substituents varies from one to five. As illustrated in the figure, when the degree of unsaturation on the acyl chain increases, the drift time decreases. The reduction of collision cross section of the gas phase lipid ion structure appears to be linearly correlated to the number of double bonds and varies at a rate of 0.52% ± 0.11 drift time for each double bond added to the acyl chain. This slight increase in drift time for the addition of one double bond to the acyl substients was observed for a wide range of phospholipid classes including SMs, PEs, and PSs. Furthermore, this change in drift time can not only be due to m/z, because the C13 peak for the PC species has the same drift time as the C12 and is shifted horizontal by one Dalton. The variation in collision cross section (and thus in drift time) for lipids with acyl chains containing different degrees of unsaturation can be explained by the fact that the presence of an unsaturated double bond causes the chain to bend. As a result, the molecule is less elongated and the collision cross section is smaller.
Figure 1.
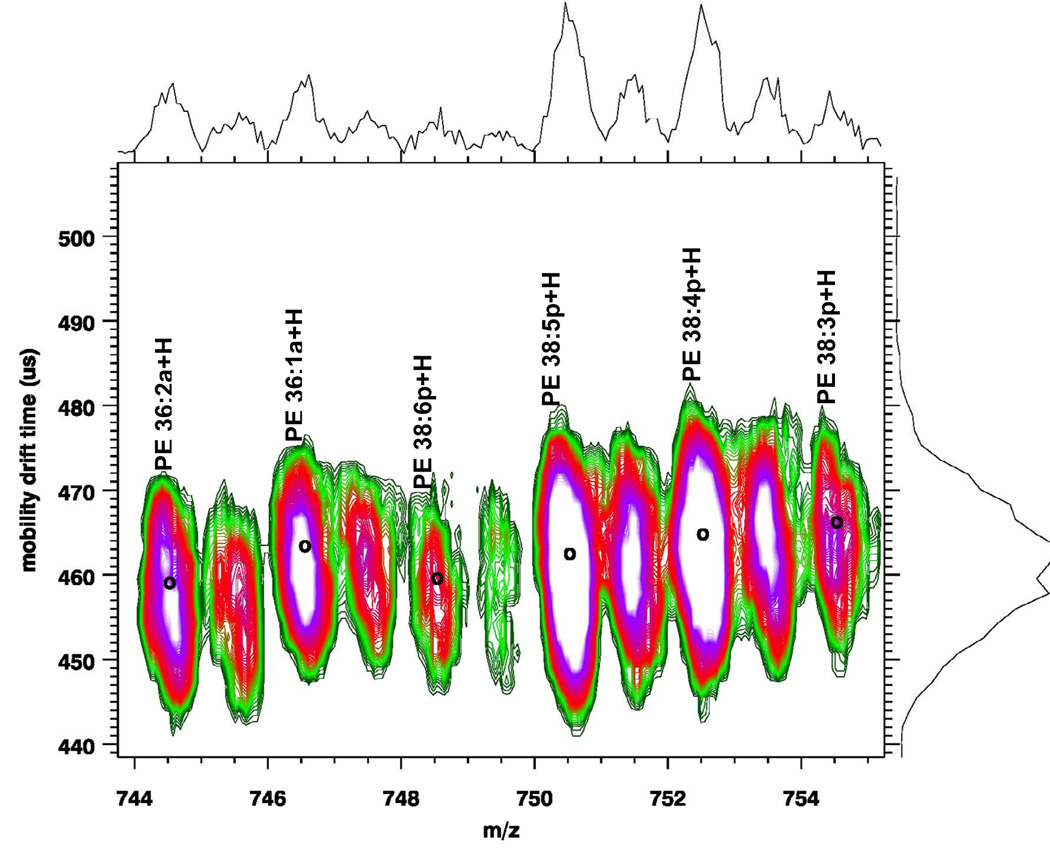
MALDI-IM 2D plot of (a) 100 pmol of Soy PCs and (b) porcine brain PEs with DHA matrix. Decrease in the drift time as a function of the number of unsaturated bonds in acyl chains is observed.
The increase in mobility time for lipids due to the addition of a double bond to the radyl chains can be used to identify lipid species in cases where there could be overlap due to different subclasses at the same m/z value. PEs are one of the most abundant glycerophospholipid classes. In addition to the basic diacyl species of glycerophospholipids, in which two acyl groups are attached to the sn-1 and sn-2 position of the glycerol backbone, PE also contain plasmalogen species, in which a vinyl ether group instead of an acyl group is attached to the sn-1 position. Plasmalogen species are a major constituent of brain PE, accounting for approximately 60% of PE in human adult brain(1). Figure 1(b) shows a MALDI-IM MS spectrum of porcine brain PE extract in positive ion mode. Overall, we were able to identify 31 PE species in this brain extract including 16 diacyl species and 15 plasmalogen species. The mass range shown in Figure 1(b) illustrates an example where the mobility drift time can be employed to identify whether a species is a diacyl or a plasmalogen. The lipid species at m/z 748.5 could either be PE 36:0a or PE 38:6p. However, if the species was PE 36:0a, the drift time should increase but instead the drift time actually decreases and the species corresponds well to the expected mobility shift associated with the series of plasmalogen species (PE 38:5p-PE 38:4p) recorded in the figure. Based upon this data we are able to label the peak PE 38:6p.
Effects of Class/Head group on Ion Mobility
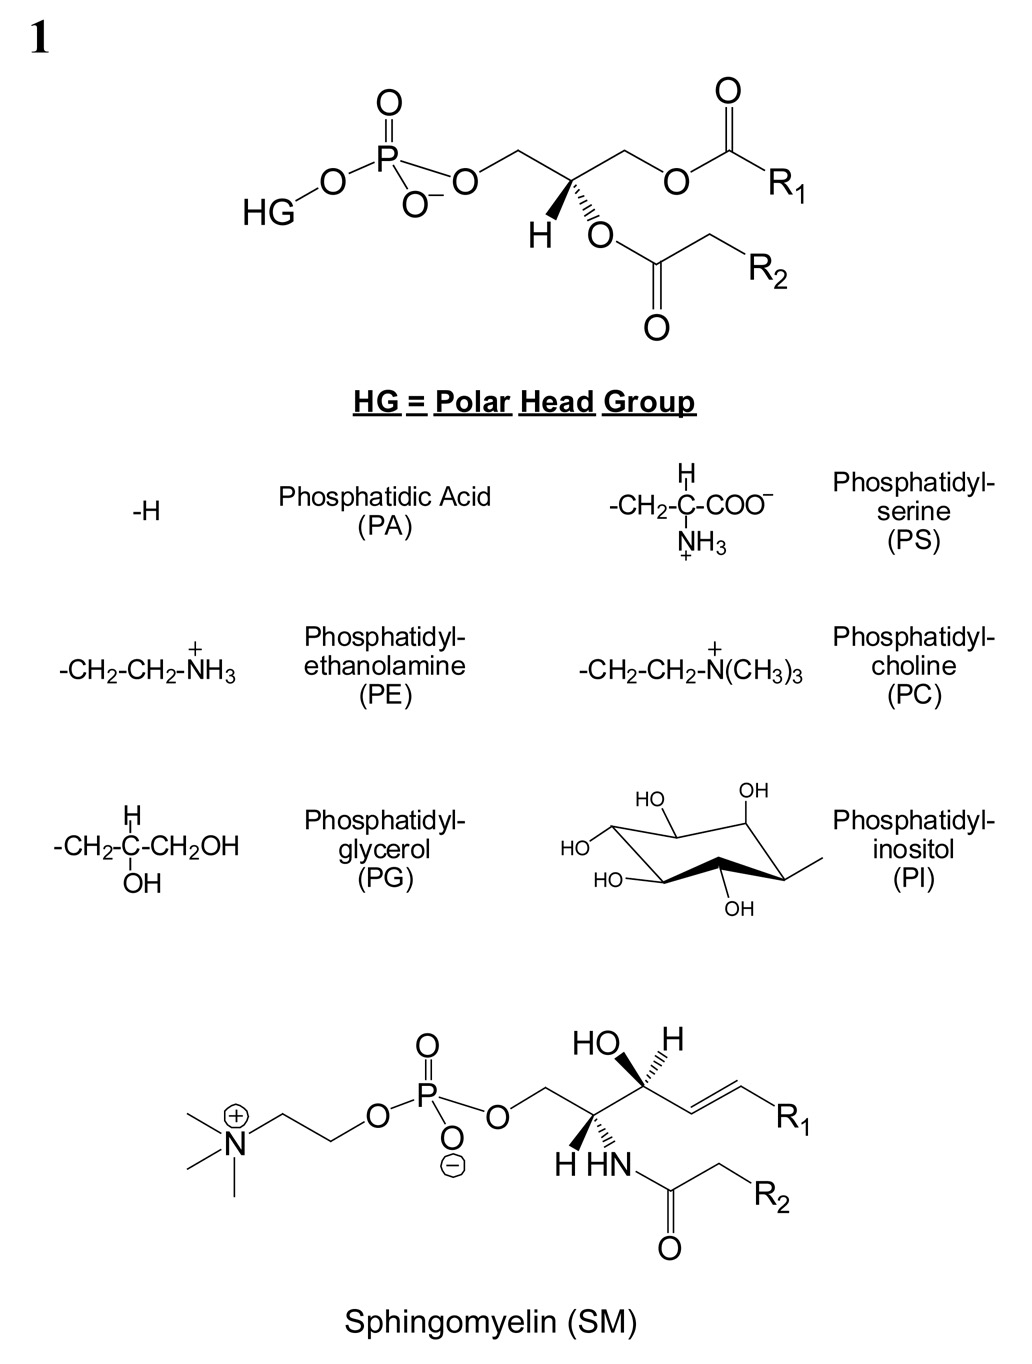
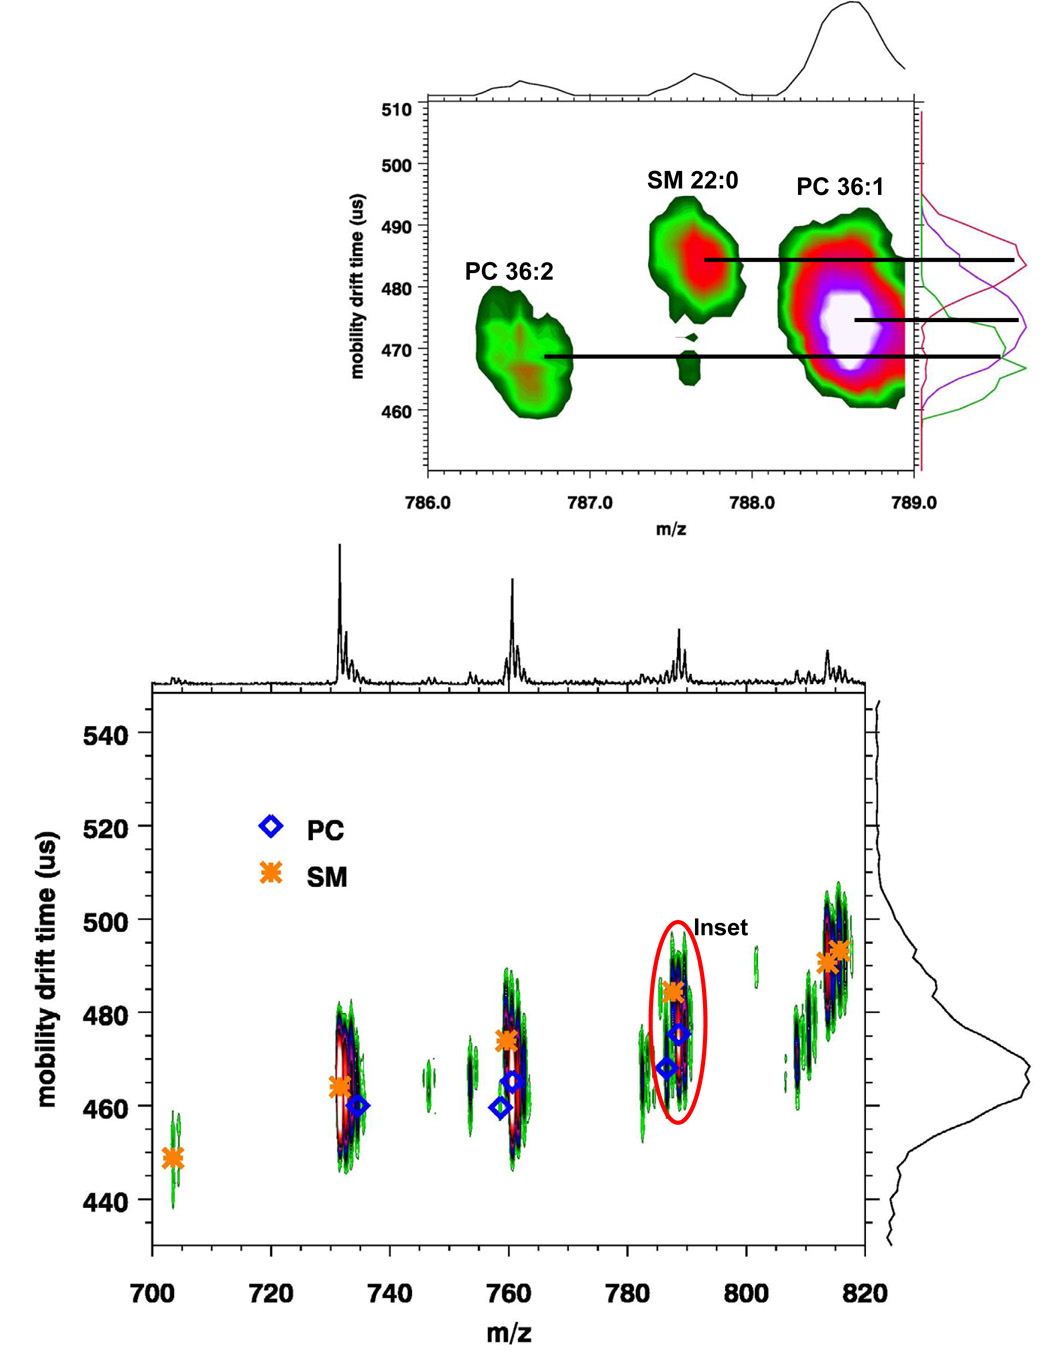
Phospholipids are usually separated according to class using TLC or normal-phase HPLC (22). The basic structures of the different classes of phospholipids are shown 1. A mixture of phosphatidylcholine and sphingomyelin was used to demonstrate how ion mobility can be used to separate lipid classes with similar head groups. Both phosphatidylcholine and sphingomyelin have a phosphocholine head group; however, the sphingomyelin ceramide backbone differs subtly from the glycerol backbone of phosphatidylcholine. In addition, the SM ceramide backbone usually consists of a sphingosine and a saturated acyl chain while the PC glycerol backbone usually consists of two acyl chains esterified at the sn-1 and sn-2 positions with one chain being unsaturated (24). Figure 2 shows a MALDI-IM spectrum of a mixture of 25 pmol of PC and SM brain extracts with DHA matrix. A total of six SM species (SM 16:0, SM 18:0, SM 20:0, SM 22:0, SM 24:1, SM 24:0) and five PC species (PC 32:0, PC 34:2, PC 34:1, PC 36:2, PC 36:1) were identified and the protonated mass peak for each species is assigned in Figure 2. One clear observation from this figure is that SM species have a slightly higher drift time compared to PC species. The larger collision cross section of SMs as compared to PCs is most likely attributed to saturation versus nonsaturation, acyl chain length, and the different backbone structure of the two classes.
Figure 2.
MALDI-IM 2D spectrum of 25 pmol each of brain PC extract and brain SM extract with DHA matrix illustrating the ion mobility separation of phosphatidylcholine and sphingomyelin species.
The MH+ of PC species are always even while those of SM species are always odd; therefore, even though they occupy similar mass ranges, the mass peaks do not overlap. However, problems in assignment can arise in complex samples such as tissue, in which there are several species of PC and SM at varying concentrations and thus the possibility of overlap exists between the C12 and C13 monoisotopic peaks of SM and PC species. An example of how ion mobility can resolve this problem is shown in Figure 2’s inset. The mass range shown includes two PC (PC 36:2+H and PC 36:1+H) and one SM species (SM 22:0+H). As is observed in the figure, the two PC species have smaller drift times compared to the SM species. The increase in drift time due to the loss of a double bond between PC 36:2 and PC 36:1 is approximately 1.5% while the increase in drift time for SM 22:0 versus PC 36:1 is 1.9% despite being one Dalton less. This increase in drift time for SM versus PC species is above what would be expected due to the differences in double bonds and was seen for all SM and PC species observed in Figure 2.
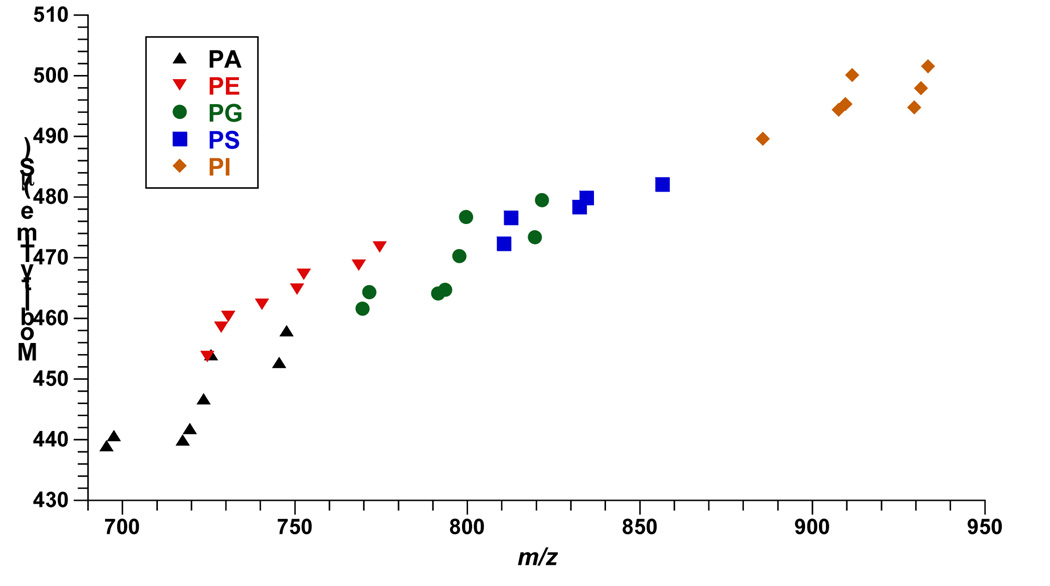
Figure 3 shows a plot of drift time versus m/z for a sample containing egg PA, brain PE, egg PG, liver PI, and brain PS extracts, respectively. Overall, 25 lipid species were identified including 4 PAs, 8 PEs, 4 PGs, 5 PIs, and 4 PSs species. PE species were observed mainly as protonated adducts while the more acidic phospholipid classes such as PA, PG, PI, and PS were recorded as sodiated and doubly sodiated adducts. As seen in Figure 3, different phospholipid classes occupy different drift time-m/z space, which simplifies their assignment in complex mixtures.
Figure 3.
MALDI-IM 2D plot of 15 pmol each of egg PA, brain PE, egg PG, liver PI, and brain PS extracts with DHA matrix. Demonstrates the extent of the drift time-m/z encompassed by head group, acyl chains, and salt adduct differences in the lipid classes.
Effects of Cationization on Ion Mobility
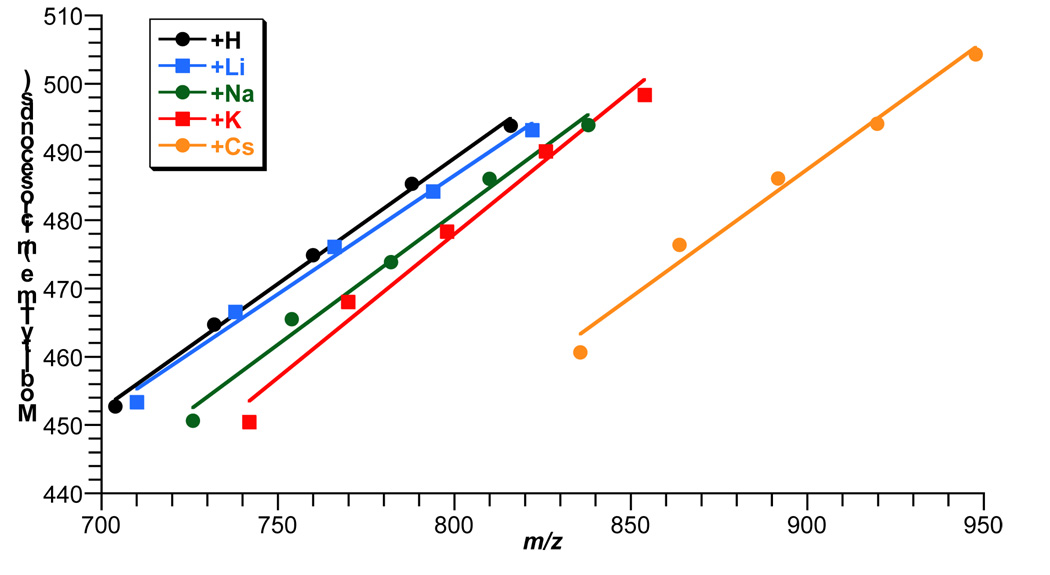
Cationization has been shown to be an effective MALDI IM TOFMS shift agent for biomolecules(25,26). Figure 4 illustrates this phenomenon for five saturated SM species with acyl chain lengths varying from 16 to 24. In this sample, salt adducts were generated by mixing 50 pmol of SM brain extract with DHA matrix containing 10 mM each of LiCl, NaCl, KCl, and CsCl. Figure 4 shows a typical IM progression of alkali adducts that can be visualized by a trend line which is drawn as a linear fit between the protonated, lithiated, sodiated, potassiated, and cesiated ions of each SM lipid species. As seen is Figure 4, the slope of the trend line for each adduct type is similar. The average slope for the trend lines in Figure 2 is 0.38 with a standard error of 0.03. The results show that formation of alkali adducts move the lipid species into a different drift time-m/z space. The attachment of an alkali ion leads to a significant shift towards lower collision cross sections as compared to protonated lipid species with a similar m/z. This shift increases as the atomic mass of the alkali ion increases due to the higher mass to area ratio of an atom compared to an acyl chain. Despite this shift to lower collision cross sections, alkali adducts of lipids do not disrupt the mobility trend of protonated lipid species for acyl chain length, saturation, and head group differences as mentioned in this study.
Figure 4.
Plot of drift time versus m/z for 50 pmol of SM brain extract with DHA matrix containing 10 mM of LiCl, NaCl, KCl, CsCl. Lipid ion mobility shifts produced by alkali cationization is illustrated. Only saturated SM lipids and adduct ions from extract are plotted.
The presence of a positively charged quaternary ammonium group in both phosphatidycholines and sphingomyelins aid in the detection of these two classes of phospholipids in positive ion mode. Previous MALDI-MS studies of extract phospholipid mixtures have demonstrated that in positive ion mode, phosphatidylcholine and sphingomyelin species can inhibit the detection of other classes of phospholipids at similar concentrations (27,28). One approach to overcome the suppression of other phospholipids classes in positive ion mode has been to add CsCl crystals to the sample. In one study, the formation of cesium adducts increased the signal of PGs species in the presence of SMs and PCs species in positive ion mode using MALDI-MS (28). As shown in Figure 4, the attachment of an alkali ion leads to a significant shift towards lower collision cross sections, as compared to the typical trend line drawn between species of the same lipid with different chain lengths. Furthermore, additional alkali attachments result in further downward shift in drift time. Thus, the analysis of cesium adducts by MALDI-IM MS offers two advantages for the analysis of complex lipid samples: 1. The addition of cesium will increase the ionization of the more acidic lipid classes. 2. The addition of cesium ions will shift the drift times and allow for trend lines based upon the number of cesium ions attached.
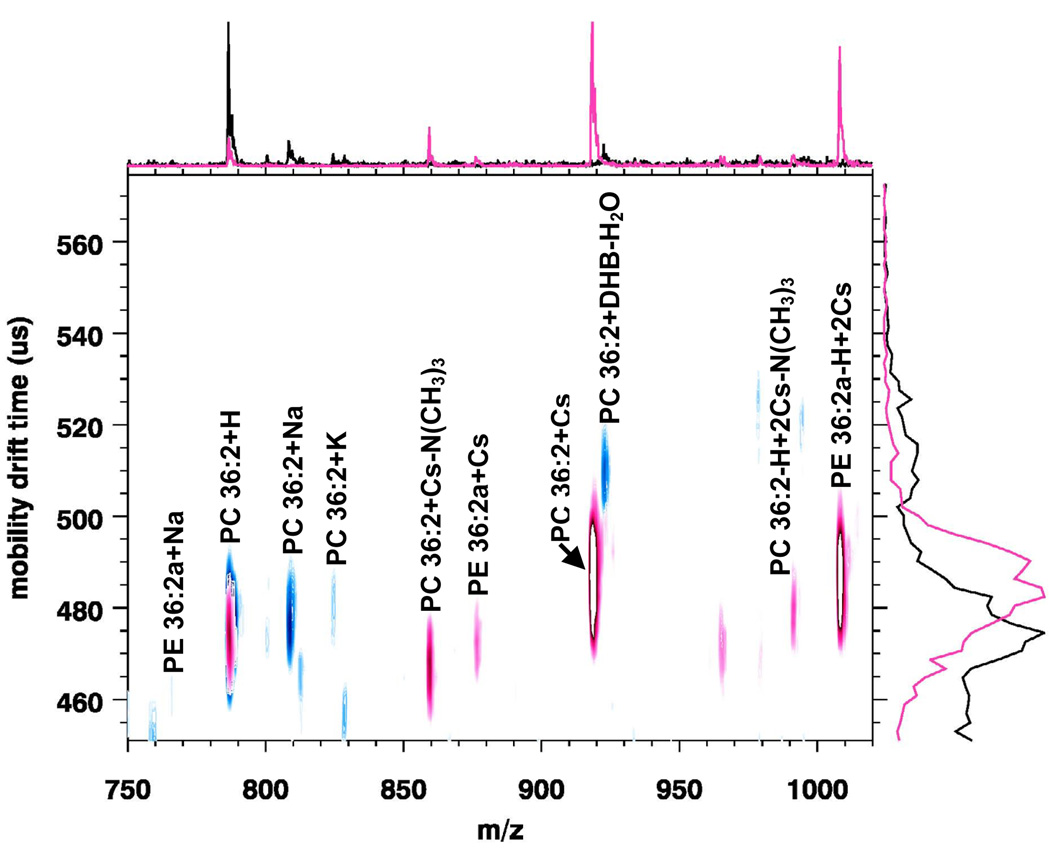
Figure 5 shows an overlay of two MALDI-IM 2D plots of 15 pmol of PC 36:2 and PE 36:2a with DHB matrix with and without cesium. The blue signals represent the MALDI-IM spectrum that was obtained with no cesium. In this spectrum, the major peak is PC 36:2+H with minor adduct peaks (PC 36:2+Na, PC 36:2+K, PC 36:2+DHB-H2O) also being recorded. Although PE and PC have the same concentration, only one very weak signal (PE 36:2a+Na) is observed for PE 36:2a. The red signals represent the MALDI-IM spectrum that was recorded using DHB matrix with cesium. In this spectrum, strong mass peaks are observed for both lipid species. For PC 36:2, the major peak is PC 36:2+Cs with additional peaks corresponding to PC 36:2+H, PC 36:2+Cs-N(CH3)3, and PC 36:2-H+Cs- N(CH3)3. For PE 36:2a, the major peak is PE 36:2a-H+2Cs, PE 36:2a+Cs is also seen.
Figure 5.
Overlay of two MALDI-IM 2D plots of 15 pmol of each PC 36:2 and PE 36:2a with DHB matrix without cesium (blue area) and with cesium (red area). The addition of cesium increases the signal intensity for PE 36:2a.
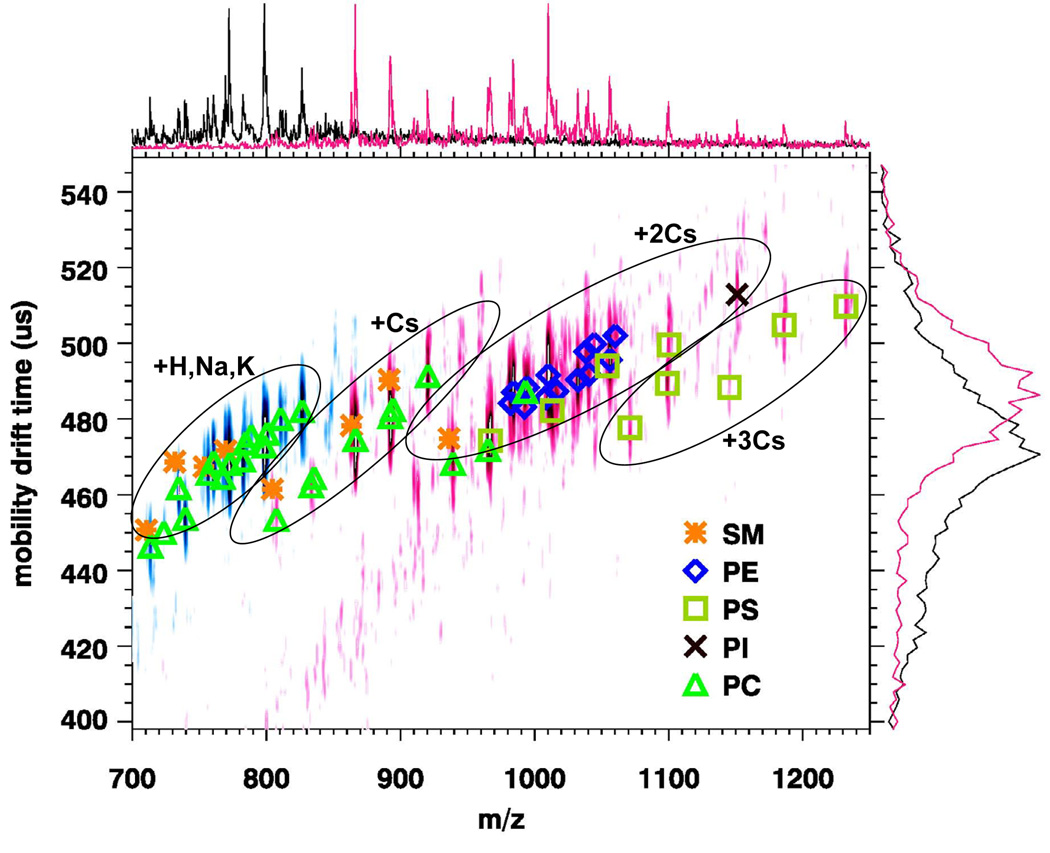
In order to test the utility of cesium adduct formation to analyze complex lipid samples, experiments were conducted using matrix with cesium for the direct analysis of tissue sections. Figure 6 illustrates an overlay of two MALDI-IM 2D spectra of the cerebral caudate-putamen region in rat brain tissue with DHB matrix without cesium (blue area) and with cesium (red area). The data for each spectrum were acquired from the same tissue section, one from the left hemisphere and the other from the right hemisphere. The instrumental parameters were kept constant in order to aid in comparison of the data. Table 1 contains the peak assignments for each spectrum in Figure 6. The blue signals represent the MALDI-IM spectrum that was obtained using DHB matrix with no cesium. Based upon this spectrum, 4 PCs and 1 SM species were observed. Peaks corresponding to the protonated, sodiated, and potassiated ions and the loss of trimethylamine from the lipid species were observed. A previous study using both MALDI-MS and MALDI-IM MS in positive ion mode obtained similar results in which PC and SM species were observed but little to no signals was recorded for neutral or acidic phospholipids (13).
Figure 6.
Overlay of two MALDI-IM 2D plots of the cerebral caudate-putamen region in rat brain tissue with DHB matrix without cesium (blue area) and with cesium (red area). The addition of cesium allows for the assignment of other phospholipid species which were not observed with only DHB matrix.
Table 1.
Peak assignments for the cerebral caudate-putamen region in rat brain tissue with DHB matrix with and without cesium salt.
| DHB matrix (blue area) | DHB matrix with cesium (red area) | ||||
|---|---|---|---|---|---|
| Assignment | m/z | Mobility | Assignment | m/z | Mobility |
| SM 18:0+K-N(CH3)3 | 710.4 | 450.7 | SM 18:0+Cs-N(CH3)3 | 804.4 | 461.5 |
| PC 32:0+K-N(CH3)3 | 713.5 | 446.4 | PC 32:0+Cs-N(CH3)3 | 807.4 | 453.5 |
| PC 34:1+Na-N(CH3)3 | 723.5 | 450.0 | PC 34:1+Cs-N(CH3)3 | 833.4 | 462.3 |
| SM 18:0+H | 731.6 | 468.7 | PC 34:0+Cs-N(CH3)3 | 835.6 | 464.5 |
| PC 32:0+H | 734.6 | 461.8 | SM 18:0+Cs | 863.5 | 478.3 |
| PC 34:1+K-N(CH3)3 | 739.5 | 453.8 | PC 32:0+Cs | 866.4 | 474.6 |
| SM 18:0+Na | 753.6 | 467.4 | SM 20:0+Cs | 891.5 | 490.3 |
| PC 32:0+Na | 756.5 | 465.5 | PC 34:1+Cs | 892.5 | 480.6 |
| PC 34:1+H | 760.6 | 468.6 | PC 34:0+Cs | 894.4 | 482.6 |
| PC 36:1+K-N(CH3)3 | 767.4 | 464.5 | PC 36:1+Cs | 920.4 | 491.5 |
| SM 18:0+K | 769.5 | 471.6 | SM 18:0-H+2Cs- N(CH3)3 | 936.1 | 474.8 |
| PC 32:0+K | 772.5 | 468.2 | PC 32:0-H+2Cs-N(CH3)3 | 939.2 | 468.3 |
| PC 34:1+Na | 782.6 | 469.1 | PC 34:1-H+2Cs-N(CH3)3 | 965.3 | 471.9 |
| PC 34:0+Na | 784.5 | 473.6a | PS 36:1-2H+2Cs- C3H5NO2 | 967.2 | 474.2 |
| PC 36:1+H | 788.6 | 475.6 | PE 34:1a-H+2Cs | 982.1 | 484.2 |
| PC 34:1+K | 798.5 | 472.8 | PE 34:0a-H+2Cs | 984.3 | 487.0 |
| PC 34:0+K | 800.5 | 476.2 | PE 36:2p-H+2Cs | 992.4 | 483.1 |
| PC 36:1+Na | 810.6 | 480.1 | PC 36:1-H+2Cs-N(CH3)3 | 993.2 | 487.3 |
| PC 36:1+K | 826.6 | 482.2 | PE 36:1p-H+2Cs | 994.3 | 488.3 |
| PE 36:2a-H+2Cs | 1008.4 | 485.7 | |||
| PE 36:1a-H+2Cs | 1010.3 | 491.6 | |||
| PS 40:6-H+2Cs-C3H5NO2 | 1013.2 | 482.2 | |||
| PE 38:4p-H+2Cs | 1016.4 | 487.3 | |||
| PE 38:4a-H+2Cs | 1032.3 | 490.3 | |||
| PE 38:1a-H+2Cs | 1038.4 | 497.8 | |||
| PE 40:6p-H+2Cs | 1040.3 | 491.8 | |||
| PE 40:4p-H+2Cs | 1044.5 | 499.8 | |||
| PS 36:1-H+2Cs | 1054.2 | 494.0 | |||
| PE 40:6a-H+2Cs | 1056.2 | 495.6 | |||
| PE 40:4a-H+2Cs | 1060.3 | 502.0 | |||
| PS 34:1-2H+3Cs-C3H5NO2 | 1071.2 | 477.7 | |||
| PS 36:1-2H+3Cs- C3H5NO2 | 1099.0 | 489.4 | |||
| PS 40:6-H+2Cs | 1100.2 | 499.5 | |||
| PS 40:6-2H+3Cs- C3H5NO2 | 1145.3 | 488.3 | |||
| PI 38:4-H+2Cs | 1151.1 | 512.9 | |||
| PS 36:1-2H+3Cs | 1186.3 | 504.8 | |||
| PS 40:6-2H+3Cs | 1232.3 | 509.7 | |||
Represents tentative assignment.
The red signals represent the MALDI-IM spectrum that was recorded using DHB matrix with cesium. The addition of cesium to the matrix for direct tissue analysis produces phospholipid signals mainly as cesium adducts and allowed for the identification of 22 phospholipid species including neutral and acidic species. First, the same PC and SM species were identified as was detected with just DHB matrix. PC and SM species were observed mainly as adducts with one cesium ion attached, but some signal was observed as adducts with two cesium ions attached and the loss of trimethylamine. Secondly, several neutral and acidic phospholipid species were observed by the addition of cesium. A total of 13 PE species were identified and observed exclusively as doubly cesiated adducts. Three PS species were assigned and included peaks with doubly and triply cesiated adducts. Additionally, peaks corresponding to the loss of the serine head group were observed, which allowed the assignment of the PS species. One PI species was recorded as a doubly cesiated adduct. In a previous study, the cerebral caudate-putamen region was probed by direct tissue analysis using MALDI-MS in negative ion mode and 29 lipid species, including PE, PS, PI,PG, and sulfatide (ST) species were identified(29). Excluding the PC and SM species not detected in the negative ion mode study, 12 of 17 other species detected were also identified by negative ion mode in the previously mentioned study. One major difference was that no ST species were detected using DHB matrix with cesium in positive ion mode; the previous study detected 8 ST species when using negative ion mode.
DISCUSSION
In this study, MALDI-IM MS was used for the analysis of complex mixtures of phospholipids and allowed for the fast (hundreds of microseconds) 2D separation of phopholipid species based upon drift time and m/z. The change in drift time (i.e. collision cross section of the ion) of phospholipids was due to the radyl chain length and degree of unsaturation, the head group, and the cationization of individual species. Based upon these three factors, we were able to simplify and improve the identification of phospholipids species using MALDI-IM MS. Finally, a combination of all three factors, especially cesium cationization, was used for in situ analysis of tissue sections in which we were able to concurrently detect basic, neutral, and acidic phospholipids.
Future studies will include expanding the mass range to include both smaller and larger lipid species. Studies will also be conducted using nanoparticles and other novel matrices that should allow for the analysis of even more lipid classes. Furthermore, since tissue imaging has just recently been demonstrated using MALDI-IM MS (30,31), additional work will be conducted using cesium cationization for imaging experiments. This will produce ion image maps for basic, neutral, and acid phospholipids from the same sample run, thus allowing for the simultaneous tracking of these species in tissue.
Acknowledgements
This research was supported by the Intramural Research Program of the National Institute on Drug Abuse, NIH. The authors thank Ms. Mary Pfeiffer for editorial assistance and the Office of National Drug Control Policy (ONDCP) for instrumentation funding, without which this and other projects could not have been accomplished. This project has also been funded in part at Ionwerks with federal funds from the National Institute on Drug Abuse, National Institutes of Health, Department of Health and Human Services, under contracts No. HHSN271200677593C, HHSN271200677563C, and N44DA-3-7727
Footnotes
Publisher's Disclaimer: This is a PDF file of an unedited manuscript that has been accepted for publication. As a service to our customers we are providing this early version of the manuscript. The manuscript will undergo copyediting, typesetting, and review of the resulting proof before it is published in its final citable form. Please note that during the production process errors may be discovered which could affect the content, and all legal disclaimers that apply to the journal pertain.
References
- 1.Piomelli D, Astarita G, Rapaka R. A neuroscientist’s guide to lipidomics. Nature Rev. Neurosci. 2007;8:743–754. doi: 10.1038/nrn2233. [DOI] [PubMed] [Google Scholar]
- 2.Han X. Neurolipidomics: challenges and developments. Front. Biosci. 2007;12:2601–2615. doi: 10.2741/2258. [DOI] [PMC free article] [PubMed] [Google Scholar]
- 3.Agranoff BW, Benjamins JA, Hajra AK. In: Basic neurochemistry molecular, cellular and medical aspects. 6th ed. Siegel GJ, et al., editors. Philadelphia: Lippincott Williams & Wilkins; 1999. pp. 47–67. [Google Scholar]
- 4.Baumbach JI, Eiceman GA. Ion mobility spectrometry: arriving on site and moving beyond a low profile. Appl. Spectrosc. 1999;53:338A–355A. doi: 10.1366/0003702991947847. [DOI] [PubMed] [Google Scholar]
- 5.McDaniel EW, Mason EA. The mobility and diffusion of ions in gases. New York: Wiley; 1973. pp. 68–72. [Google Scholar]
- 6.Collins DC, Lee ML. Developments in ion mobility spectrometry-mass spectrometry. Anal. Bioanal. Chem. 2002;372:66–73. doi: 10.1007/s00216-001-1195-5. [DOI] [PubMed] [Google Scholar]
- 7.Gillig KJ, et al. Coupling high-pressure MALDI with ion mobility/orthogonal time-of-flight mass spectrometry. Anal. Chem. 2000;72:3965–3971. doi: 10.1021/ac0005619. [DOI] [PubMed] [Google Scholar]
- 8.Woods AS, et al. Lipid/Peptide/Nucleotide separation with MALDI-Ion Mobility-TOF MS. Anal. Chem. 2004;76:2187–2195. doi: 10.1021/ac035376k. [DOI] [PubMed] [Google Scholar]
- 9.Clemmer DE, Jarrold MF. Ion mobility measurements and their applications to clusters and biomolecules. J. Mass Spectrom. 1997;32:577–592. [Google Scholar]
- 10.Kanu AB, Dwivedi P, Tam M, Matz L, Hill HH., Jr. Ion mobility-mass spectrometry. J. Mass Spectrom. 2008;43:1–22. doi: 10.1002/jms.1383. [DOI] [PubMed] [Google Scholar]
- 11.Woods AS, et al. A study of peptide-peptide interactions using MALDI ion mobility o- TOF and ESI-TOF mass spectrometry. J. Am. Soc. Mass Spectrom. 2002;13:166–169. doi: 10.1016/S1044-0305(01)00348-8. [DOI] [PubMed] [Google Scholar]
- 12.Woods AS, et al. AngiotensinII/Acetylcholine non-covalent complexes analyzed with MALDI-ion mobility-TOFMS. J Biomol Tech. 2003;14:1–8. [PMC free article] [PubMed] [Google Scholar]
- 13.Jackson SN, et al. Direct tissue analysis of phospholipids in rat brain using MALDI-TOFMS and MALDI-ion mobility-TOFMS. J. Am. Soc. Mass Spectrom. 2005;16:133–138. doi: 10.1016/j.jasms.2004.10.002. [DOI] [PubMed] [Google Scholar]
- 14.Harvey DJ. Matrix-assisted laser desorption/ionization mass spectrometry of phospholipids. J. Mass Spectrom. 1995;30:1333–1346. [Google Scholar]
- 15.Schiller J, et al. MALDI-TOF MS in lipidomics. Front. Biosci. 2007;12:2568–2579. doi: 10.2741/2255. [DOI] [PubMed] [Google Scholar]
- 16.Woods AS, Jackson SN. Brain tissue lipidomics: direct probing using MALDI MS. AAPS Journal. 2006;8:E391–E395. doi: 10.1007/BF02854910. [DOI] [PMC free article] [PubMed] [Google Scholar]
- 17.Han X, Holtzman DM, McKeel DW., Jr. Plasmalogen deficiency in early Alzheimer’s disease subjects and in animal models: molecular characterization using electrospray ionization mass spectrometry. J. Neurochem. 2001;77:1168–1180. doi: 10.1046/j.1471-4159.2001.00332.x. [DOI] [PubMed] [Google Scholar]
- 18.Murphy EJ, Schapiro MB, Rapoport SI, Shetty HU. Phospholipid composition and levels are altered in down syndrome brain. Brain Res. 2000;867:9–18. doi: 10.1016/s0006-8993(00)02205-8. [DOI] [PubMed] [Google Scholar]
- 19.Han X, et al. Alterations in myocardial cardiolipin content and composition occur at the very earliest stages of diabetes: a shotgun lipidomics study. Biochemistry. 2007;46:6417–6428. doi: 10.1021/bi7004015. [DOI] [PMC free article] [PubMed] [Google Scholar]
- 20.McMahon A, Jackson SN, Woods AS, Kedzierski W. A Stargardt disease-3 mutation in the mouse Elovl4 gene causes retinal deficiency f C32–C36 acyl phosphatidylcholines. FEBS Letters. 2007;581:5459–5463. doi: 10.1016/j.febslet.2007.10.050. [DOI] [PMC free article] [PubMed] [Google Scholar]
- 21.Watson AD. Lipodomics:a global approach to lipid analysis in biological systems. J. Lipid Res. 2006;47:2101–2111. doi: 10.1194/jlr.R600022-JLR200. [DOI] [PubMed] [Google Scholar]
- 22.Peterson BL, Cummings BS. A review of chromatographic methods for the assessment of phospholipids in biological samples. Biomed. Chromatogr. 2006;20:227–243. doi: 10.1002/bmc.563. [DOI] [PubMed] [Google Scholar]
- 23.Cornett DS, Reyzer ML, Chaurand P, Caprioli RM. MALDI imaging mass spectrometry: molecular snapshots of biochemical systems. Nat. Methods. 2007;4:828–833. doi: 10.1038/nmeth1094. [DOI] [PubMed] [Google Scholar]
- 24.van Meer G. Cellular lipidomics. EMBO J. 2005;24:3159–3165. doi: 10.1038/sj.emboj.7600798. [DOI] [PMC free article] [PubMed] [Google Scholar]
- 25.Ruotolo BT, et al. Analysis of phosphorylated peptides by ion mobility-mass spectrometry. Anal. Chem. 2004;76:6727–6733. doi: 10.1021/ac0498009. [DOI] [PubMed] [Google Scholar]
- 26.Ruotolo BT, Tate CC, Russell DH. Ion mobility-mass spectrometry applied to cyclic peptide analysis: conformational preferences of gramicidin S and linear analogs in the gas phase. J. Am. Soc. Mass Spectrom. 2004;15:870–878. doi: 10.1016/j.jasms.2004.02.006. [DOI] [PubMed] [Google Scholar]
- 27.Petkovic M, et al. Detection of individual phospholipids in lipid mixtures by matrix-assisted laser desorption/ionization time-of-flight mass spectrometry: phosphatidylcholine prevents the detection of further species. Anal. Biochem. 2001;289:202–216. doi: 10.1006/abio.2000.4926. [DOI] [PubMed] [Google Scholar]
- 28.Estrada R, Yappert MC. Alternative approaches for the detection of various phospholipid classes by matrix-assisted laser desorption/ionization time-of-flight mass spectrometry. J. Mass Spectrom. 2004;39:412–422. doi: 10.1002/jms.603. [DOI] [PubMed] [Google Scholar]
- 29.Jackson SN, Wang H-YJ, Woods AS. In situ structural characterization of glycerophospholipids and sulfatides in brain tissue using MALDI-MS/MS. J. Am. Soc Mass Spectrom. 2007;18:17–26. doi: 10.1016/j.jasms.2006.08.015. [DOI] [PubMed] [Google Scholar]
- 30.Jackson SN, et al. MALDI-ion mobility-TOFMS imaging of lipids in rat brain tissue. J. Mass Spectrom. 2007;42:1093–1098. doi: 10.1002/jms.1245. [DOI] [PMC free article] [PubMed] [Google Scholar]
- 31.McLean JA, Ridenour WB, Caprioli RM. Profiling and imaging of tissues by imaging ion mobility-mass spectrometry. J. Mass Spectrom. 2007;42:1099–1105. doi: 10.1002/jms.1254. [DOI] [PubMed] [Google Scholar]


