

Summary
Adipose tissue development and function play a central role in the pathogenesis and pathophysiology of metabolic syndromes. Here we show that Chicken Ovalbumin Upstream Promoter Transcription Factor II (COUP-TFII) plays a pivotal role in adipogenesis and energy homeostasis. COUP-TFII is expressed in the early stages of white adipocyte (WAT) development. COUP-TFII heterozygous mice (COUP-TFII+/-) have much less WAT than wild type mice (COUP-TFII+/+). COUP-TFII+/- mice display a decreased expression of key regulators for WAT development. Knock down COUP-TFII in 3T3-L1 cells resulted in an increased expression of Wnt10b, while chromatin immunoprecipitation analysis revealed that Wnt10b is a direct target of COUP-TFII. Moreover, COUP-TFII+/− mice have increased mitochondrial biogenesis in WAT, and COUP-TFII+/− mice have improved glucose homeostasis and increased energy expenditure. Thus, COUP-TFII regulates adipogenesis by regulating the key molecules in adipocyte development, and can serve as a new target for regulating energy metabolism.
Introduction
Metabolic homeostasis requires precise control of food intake and energy expenditure (Spiegleman and Flier, 2001). Adipose tissue is now recognized as an active endocrine organ, playing a more active role in regulating whole body metabolism and homeostasis by secreting various adipocytokines. Both excess and deficiency of adipose tissue have harmful metabolic consequences and represent significant medical and socioeconomic burdens in the world today. Thus, a better understanding of the molecular mechanisms that control adipose tissue development and function should improve our understanding of the pathogenesis and pathophysiology of metabolic syndrome.
Adipogenesis is regulated by an elaborate network of transcription factors. The peroxisome proliferator activated receptor γ (PPARγ) and the CCAAT/enhancer binding protein family of transcription factors α (C/EBPα) are at the center of this network (Farmer, 2006; Rosen and Spiegelman, 2000). They control a number of adipocyte-specific genes expression, and also cross-regulate each other. The differentiation of preadipocytes into adipocytes is regulated by both induction of activators and suppression of inhibitors. Activation of the Wnt signaling pathway has been shown to inhibit differentiation of preadipocytes and block adipose tissue development by supressing C/EBPα and PPARγ (Moldes et al., 2003; Ross et al., 2000). Thus, a basic framework for studying the adipocyte differentiation program has been laid out. Nevertheless, critical aspects of the transcriptional control of adipocyte differentiation remain unclear.
Chicken ovalbumin upstream promoter transcription factor II (COUP-TFII) is widely expressed in multiple tissues and organs throughout embryonic development, and is an important regulator of development, cellular differentiation, and growth (Kurihara et al., 2007; Lee et al., 2004; Petit et al., 2007; Takamoto et al., 2005b; You et al., 2005a and 2005b;). The high expression of COUP-TFII in mesenchymal cells and the formation of adipose cells from mesenchymal precursor cells indicated that COUP-TFII may play an important role in adipocyte differentiation and development. Although COUP-TFII homozygous knockout (COUP-TFII−/−) mice die before E10 (Pereira et al., 1999), and the female heterozygous knockout mice (COUP-TFII+/−) have reduced reproductive function (Takamoto et al., 2005a), the male COUP-TFII+/− mice are apparently normal and fertile.
In the present study, we found that COUP-TFII+/− mice have much less WAT mass than wild-type mice. We show here that COUP-TFII+/− mice have improved glucose homeostasis and increased energy expenditure, and COUP-TFII+/− mice are protected from high-fat diet induced obesity and insulin resistance. In addition, the expressions of PGC-1α and UCP1 as well as mitochondrial density are all increased in the WAT of COUP-TFII+/− mice. We further demonstrate that COUP-TFII directly and negatively regulates an adipogenesis inhibitor Wnt10b expression. Therefore, our results reveal an important function of COUP-TFII in WAT development and energy metabolism.
Results
COUP-TFII+/− mice display reduced adiposity
Our initial observation of the COUP-TFII+/− mice revealed a similar body weight at birth, with a reduction in the rate of weight gain compared to wild-type mice at the perinatal stage (before week 4) (Takamoto, 2005a). Eventually, the body weight of COUP-TFII+/− mice caught up with those of the control and reached to 80-90% of their wild-type littermates (Figures 1A top, 1B). Although COUP-TFII+/− mice have similar interscapular BAT masses in comparison to wild-type mice (Figure 1A bottom, Table), there was a significant 2-3 fold reduction of epididymal WAT (EWAT) in COUP-TFII+/− mice (Figure 1A bottom, Table). Histological analysis showed indistinguishable brown adipocytes in the two groups, and much smaller white adipocytes in COUP-TFII+/− WAT (Figure 1C). Despite a comparable food intake when normalized to body weight (Figure 1E), magnetic resonance imaging (MRI) revealed that the COUP-TFII+/− mice have decreased fat mass and increased lean content (Figure 1F). When the total fat mass was normalized to the body weight for each mouse, COUP-TFII+/− mice had a 30% reduction in fat mass. In contrast, when normalized to the total body weight, with no difference regarding the liver, BAT was observed between wild type and heterozygous mice (Table). Moreover, less lipid storage in COUP-TFII+/− EWAT was observed (Figure 1D), while there is no difference of lipid accumulation in BAT between the two groups of mice (data not shown). The marked decrease in WAT mass was mainly due to a reduction in adipocyte cell size, since measurement of relative cyclophilin A gene copy of genomic DNA isolated from wild type and heterozygous mice that only show a moderate, but not statistically significant, decrease in EWAT (Figure 1G). Therefore, COUP-TFII+/− mice are leaner because of the smaller size of adipocytes giving rise to smaller WAT fat pads.
Figure 1. COUP-TFII+/− mice display reduced adiposity.
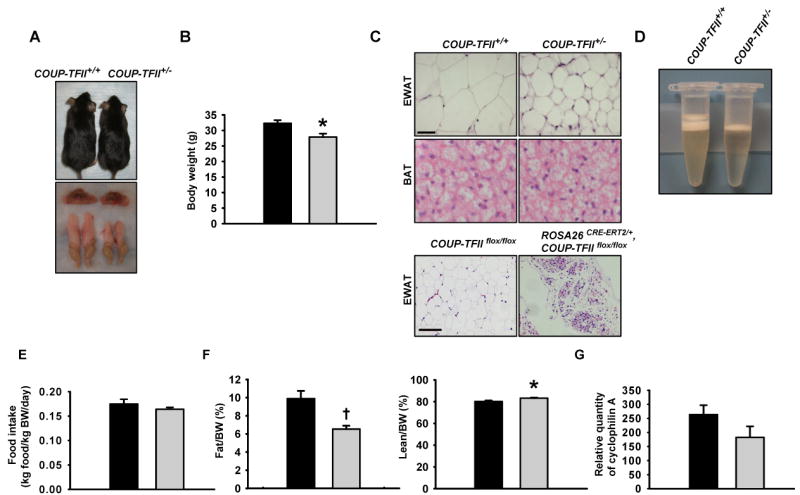
(A). The photograph depicts the appearance of the 3-month-old COUP-TFII+/+ and COUP-TFII+/− mice (top), and gross morphology of BAT and epididymal WAT (EWAT) (bottom). (B). Body weight of 3-month-old COUP-TFII+/+ (black box, n=7) and COUP-TFII+/− (gray box, n=7) mice fed a normal chow. (C). H&E staining of paraffin-embedded EWAT and BAT sections. The upper scale bar shown is equal to 20 μm and applicable to the top four sections; the lower scale bar shown is equal to 100 μm and applicable to the bottom two sections.
(D). One side of whole mount EWAT were collected from COUP-TFII+/+ and COUP-TFII+/− mice respectively, and were completely homogenized in a 0.5 ml RIPA buffer. Picture was taken after the samples were centrifuged for 15 min at 12,000 rpm. COUP-TFII+/− mice had much less lipid accumulation in EWAT than the control (top layer).
(E). COUP-TFII+/− mice have similar food intake (gray box, n=7) in comparison with COUP-TFII+/+ mice (black box, n=7).
(F). MRI analysis revealed that COUP-TFII+/− mice (gray box, n=7) have less fat mass and are leaner than COUP-TFII+/+ mice (black box, n=7).
(G). Real-time PCR analysis of cyclophilin A gene number in EWAT genomic DNA from both COUP-TFII+/+ (black box, n=7) and COUP-TFII+/− (gray box, n=7) mice. Data in (B) and (E-G) represent mean ± SEM. * p<0.05; † p<0.005.
Table.
Reduced EWAT in COUP-TFII+/- Mice
| Age | 2-week-old (n=5) | 3-week-old (n=5) | 2-month-old (n=5) | 3-month-old (n=7) | |||||
|---|---|---|---|---|---|---|---|---|---|
| EWAT/BW (%) | Lv/BW (%) | EWAT/BW (%) | Lv/BW (%) | EWAT/BW (%) | Lv/BW (%) | EWAT/BW (%) | BAT/BW (%) | Lv/BW (%) | |
| COUP-TFII+/+ | 0.51 ± 0.03 | 3.81 ± 0.19 | 0.43 ± 0.04 | 4.96 ± 0.13 | 1.20 ± 0.11 | 4.95 ± 0.21 | 1.45 ± 0.2 | 0.25 ± 0.01 | 5.36 ± 0.13 |
| COUP-TFII+/− | 0.19 ± 0.03a | 4.10 ± 0.54 | 0.14 ± 0.01c | 4.45 ± 0.19 | 0.59 ± 0.04b | 5.33 ± 0.29 | 0.64 ± 0.05a | 0.29 ± 0.01 | 5.23 ± 0.17 |
Values represent mean ± SEM.
p<0.005,
p<0.001,
p<0.0005 versus COUP-TFII+/+mice of the same age.
BW: body weight, EWAT: epididymal WAT, Lv: liver.
To further evaluate COUP-TFII function in adipogenesis, we exploited a tamoxifen-inducible knock out system by crossing ROSA26CRE-ERT2/+ to COUP-TFII flox/flox mice to generate ROSA26CRE-ERT2/+, COUP-TFIIflox/flox mice. COUP-TFII is expressed in these mice in the absence of tamoxifen treatment. An ablation of COUP-TFII was achieved by maternal administration of tamoxifen at E18.5 to bypass the early lethality of the COUP-TFII null mutant, and the WAT was collected when the mice were 3 months old. We observed a significant decrease of WAT mass, and the mutant WAT depots contained multilocular adipocytes that resembled undifferentiated adipocytes (Figure 1C bottom). This further indicates that COUP-TFII plays an essential role in adipogenesis in vivo.
COUP-TFII is required for adipocyte differentiation in vivo
To determine the function of COUP-TFII in WAT development, we first examined the expression of COUP-TFII during adipocyte differentiation. EWAT was isolated from 3-, 5-day, two-week and two-month old wild-type mice. COUP-TFII as well as key adipogenic regulators PPARγ and C/EBPα expression levels were assessed by Q-PCR. COUP-TFII expression is high in the early adipocyte differentiation stage and lower at the later stage. High expression of COUP-TFII was followed by expression of PPARγ and C/EBPα; expression of both PPARγ and C/EBPα persisted through adipocyte differentiation (Figure 2A).
Figure 2. COUP-TFII is required for adipocyte differentiation in vivo.
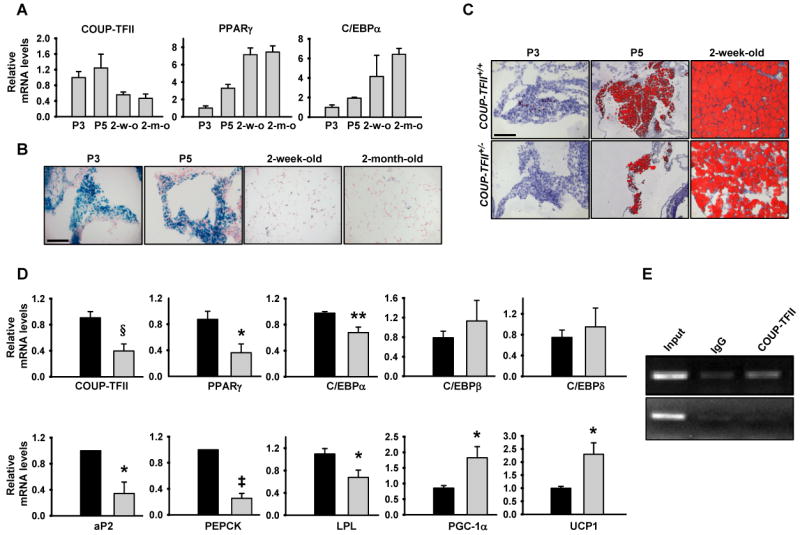
(A). Real-time PCR analysis of the mRNA expression of COUP-TFII and the adipogenic transcription factors PPARγ and C/EBPα in EWAT collected from COUP-TFII+/+ mice at different developmental stages. Expression levels of each gene were normalized to the levels of the 18S rRNA (n=6).
(B). X-gal staining of histological sections of EWAT taken from different ages of COUP-TFII-LacZ knock-in mice. The scale bar shown equals 50 μm, and is applicable to all sections.
(C). Oil-red-O staining of frozen sections of EWAT from COUP-TFII+/+ and COUP-TFII+/− mice at different ages. The scale bar shown equals 50 μm, and is applicable to all sections.
(D). Real-time PCR analysis of adipocyte marker genes and transcription factors. RNAs were isolated from EWAT of COUP-TFII+/+ (black box) and COUP-TFII+/− (gray box) mice. Expression levels of each gene were normalized to the levels of the 18S rRNA (n=7). Data in (A) and (D) indicate mean ± SEM. * p<0.05; ** p<0.01; ‡ p<0.001; § p<0.0005.
(E). ChIP analysis of COUP-TFII binding to a PGC-1α promoter at the promoter region of 2 kb upstream of transcriptional initiation site (top row) and at the second intron region (bottom row) which served as a control.
Previously, our group has generated COUP-TFII-LacZ knock-in mice, in which a lacZ gene was used to replace the COUP-TFII allele (Takamoto et al., 2005b). Therefore, the expression of COUP-TFII during WAT development was monitored in heterozygotes by measuring β-galactosidase activity. X-gal staining of E-WAT collected from 3-, 5-day, two-week and two-month old COUP-TFII-LacZ knock-in mice also revealed similar expression patterns of COUP-TFII during adipocyte differentiation; high in the early developmental stages and gradually decreasing thereafter (Figure 2B). This expression pattern suggests that COUP-TFII play an important role during early WAT development.
Whereas wild-type adipocytes are characterized by large lipid deposits as assessed by Oil red O staining, the COUP-TFII+/− adipocytes stain less and contain much less fat deposits (Figure 2C and Figure S1A). Given that the characteristic morphology of adipocytes normally develop in the first 24 hr after birth (Rosen, 2002), these results suggest that haploinsufficiency of COUP-TFII results in delayed or impaired WAT development.
To further analyze the function of COUP-TFII in adipocyte differentiation, EWAT was collected from 3-day old COUP-TFII+/+ and COUP-TFII+/− mice, and the expression levels of COUP-TFII and other adipogenic marker genes were assessed by using real-time PCR. As expected, expression of COUP-TFII was reduced in COUP-TFII+/− WAT. Expression levels of the key adipogenic transcription factors PPARγ and C/EBPα were significantly lower in COUP-TFII+/− WAT than in those of the wild-type WAT (Figure 2D). Similarly, the expression levels of late adipocyte differentiation markers, including adipocyte P2 (aP2), phosphoenolpyruvate carboxykinase (PEPCK) and lipoprotein lipase (LPL), were significantly reduced in COUP-TFII+/− WAT (Figure 2D). On the other hand, expression of C/EBPβ and C/EBPδ was comparable in the two groups. Strikingly, PGC-1α and UCP1, were significantly expressed at a higher level in COUP-TFII+/− WAT. Chromatin immunoprecipitation (ChIP) assays further indicated that COUP-TFII directly bound to and negatively regulated PGC-1α expression (Fig 2E).
Taken together, this data reveals that COUP-TFII played an important role in adipocyte differentiation in vivo.
COUP-TFII is necessary for adipocyte differentiation in vitro
To further address the function of COUP-TFII in adipocyte differentiation, the expression of COUP-TFII during adipocyte differentiation from 3T3-L1 cells was analyzed. During that process, COUP-TFII protein increased 4 hr after induction of differentiation, and its level peaked after 18 hr and then gradually declined 1 day after the onset of hormonal stimulation (Figure 3A). Induction of COUP-TFII was followed by PPARγ, as previously reported, and expression of PPARγ persisted through maturation of 3T3-L1 cells. The transient high expression level of COUP-FII in an early phase of 3T3-L1 adipocyte differentiation indicates that COUP-TFII may be essential for adipogenesis.
Figure 3. COUP-TFII is necessary for adipocyte differentiation from 3T3-L1 cells and embryonic fibroblasts.
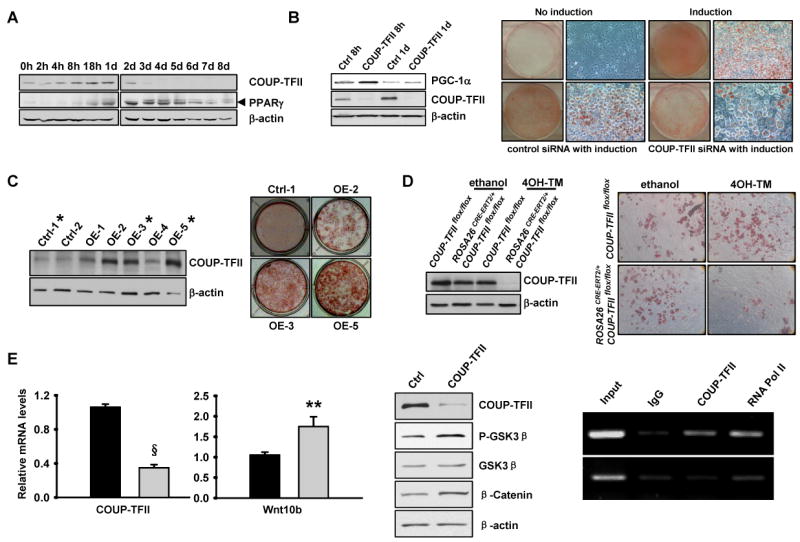
(A). Western blot analysis of COUP-TFII and PPARγ expression during differentiation of 3T3-L1 cells. Cells were harvested at the indicated times. Arrowhead indicates positions of bands corresponding to PPARγ.
(B). 3T3-L1 cells were transfected with COUP-TFII-siRNA (COUP-TFII) or control siRNA (Ctrl), expression of COUP-TFII and PGC-1α in cells 8 hours and 1 day after induction were analyzed by western blot (left). siRNA knock down 3T3-L1 cells were induced to differentiate. Cells were stained with Oil-Red-O on day 8 (right). H in (A-B) stands for hours, d stands for days.
(C). 3T3-L1 cells transfected with a control plasmid (Ctrl) or one expressing COUP-TFII (OE). Expression of COUP-TFII in cells was analyzed by western blot (left). COUP-TFII overexpression in cells was subsequently induced to differentiate. Cells were stained with Oil-Red-O on day 8 (right).
(D). Impaired adipocyte differentiation in COUP-TFII null embryonic fibroblasts (MEFs). Immunoblot analysis of COUP-TFII in MEFs prepared from COUP-TFII flox/flox and ROSA26CRE-ERT2/+, COUP-TFII flox/flox embryos. Cells were harvested 2 days after having been cultured in DMEM with or without 1 μM 4-hydroxy-tamoxifen (4OH-TM) (left). MEFs were induced to differentiate and cells were staining with Oil-Red-O on day 8 (right).
(E). COUP-TFII negatively regulates Wnt10b expression. Real-time PCR analysis of COUP-TFII and Wnt10b expressions in COUP-TFII knock down 3T3-L1 cells (left). Expression levels of each gene were normalized to the levels of the 18S rRNA (n=3). Western blot analysis of molecules in Wnt signaling pathway (middle). ChIP analysis of COUP-TFII binding to Wnt10b promoter at the promoter region 1.8 kb upstream of the transcriptional initiation site (top row) and at the second intron region (bottom row) which was served as a control (right). Data indicates mean ± SEM. ** p<0.01, § p<0.0005.
To further evaluate the role played by COUP-TFII in adipogenesis, we knocked down COUP-TFII expression using a specific siRNA. As expected, cells transfected with COUP-TFII-siRNA showed significant loss of COUP-TFII protein in comparison to cells transfected with control siRNA 8 hours or 1 day after being exposed to the cocktail of insulin, dexamethasone (DEX) and 3-isobutyl-1-methyl-xanthine (MIX) (Figure 3B left). Oil-Red-O staining on day 8 after induction showed that 3T3-L1 cells treated with COUP-TFII-siRNA accumulated much less lipids compared to cells transfected with control siRNA, as evaluated by visualization of entire culture plates and microscopically representative fields (Figure 3B right and Figure S1B). The positive role of COUP-TFII in adipogenesis is further confirmed by using a retroviral system to knock down COUP-TFII in 3T3-L1 cells before adipogenesis assays were performed. Consistently, down regulation of COUP-TFII resulted in decreased adipocyte differentiation (Figure S2).
Conversely, we also generated several 3T3L1 cells overexpressing wild-type COUP-TFII (Figure 3C left). Enhanced expression of COUP-TFII resulted in accumulation of more lipid droplets and in a larger fraction of cells than was seen with the control (Figure 3C right). The enhancement of adipogenesis by COUP-TFII is dosage-dependent; 3T3-L1 with higher COUP-TFII expression accumulated more lipids (Figure 3C). These results clearly indicate that COUP-TFII is necessary for the proper adipogenesis of 3T3L1 cells.
To further analyze the importance of COUP-TFII in adipocyte differentiation, we compared the capacity of primary mouse embryonic fibroblasts (MEFs) with or without COUP-TFII to accumulate lipids when stimulated with insulin, DEX, MIX, and rosiglitazone. Because COUP-TFII-/- embryos die around E9.5, and we could not obtain COUP-TFII-/- MEFs, we exploited an inducible knock out system instead. Confluent MEFs prepared from COUP-TFII flox/flox and ROSA26CRE-ERT2/+, COUP-TFII flox/flox embryos were cultured in DMEM with or without 4-hydroxy-tamoxifen for two days and then subjected to hormone-induced adipocyte differentiation. As expected, the COUP-TFII protein was undetectable in ROSA26CRE-ERT2/+, COUP-TFII flox/flox MEFs two days after being cultured with tamoxifen (Figure 3D left). By day 8 after induction, less than 5% of ROSA26CRE-ERT2/+, COUP-TFII flox/flox MEFs treated with tamoxifen bore lipid droplets, whereas 50%-60% of COUP-TFII flox/flox MEFs with or without tamoxifen treatment and ROSA26CRE-ERT2/+, COUP-TFII flox/flo MEFs without tamoxifen treatment did so (Figure 3D right and Figure S1C). The defective adipocyte differentiation of COUP-TFII null MEFs clearly demonstrates the importance of COUP-TFII in adipocyte differentiation.
Since the Wnt signaling pathway plays an important role in adipogenesis, we analyzed the Wnt signaling pathway by using an in vitro adipogenesis system and found that the expression levels of Wnt10b and its downstream signaling molecules, β-catenin and P-GSK3β, were all increased in the COUP-TFII knock down 3T3-L1 cells (Figures 3E left and middle). ChIP assay further indicated that COUP-TFII could bind to Wnt10b promoter and repress Wnt10b expression (Figure 3E right). This result revealed that COUP-TFII regulates adipogenesis by supressing the Wnt signaling pathway.
COUP-TFII+/− mice have improved glucose homeostasis
The COUP-TFII+/− mice displayed comparable plasma glucose, cholesterol, and nonesterified fatty acid (NEFA) levels under either fed or fasting conditions as compared to the control mice (Figure 4A). Both fed and fasting plasma triglycerides were decreased in the COUP-TFII+/− mice compared to the control mice. Although the COUP-TFII+/− mice have similar fed plasma insulin and adiponectin levels in comparison to the control mice, they displayed an approximately 70% decrease in fasting insulin levels and a 20% increase in fasting adiponectin levels compared to the control mice (Figure 4A). Since the COUP-TFII+/− adipocytes exhibit reduced accumulation of triglycerides and a reduction in cell size, we examined the lipid content in liver, skeletal muscle, and pancreas by Oil-red-O staining. The result revealed that there is no detectable lipid accumulation in skeletal and pancreas in both the control and heterozygous mice (data not shown). Surprisingly, we observed much less lipid storage in the COUP-TFII+/− liver as compared to the control mice (Figure 4B). It is well established that high intra-tissue triglycerides can induce states of insulin resistance (Biddinger and Kahn, 2006; Krssak and Roden, 2004). Indeed, reduced lipid content in the COUP-TFII+/− mice correlated with a significantly enhanced insulin sensitivity (Figure 4C right) and improved glycemic control in a glucose tolerance test as compared to the control mice (Figure 4C left). Taken together, these findings indicate that COUP-TFII+/− mice have improved glucose homeostasis and increased insulin sensitivity.
Figure 4. COUP-TFII +/- mice have improved glucose homeostasis.
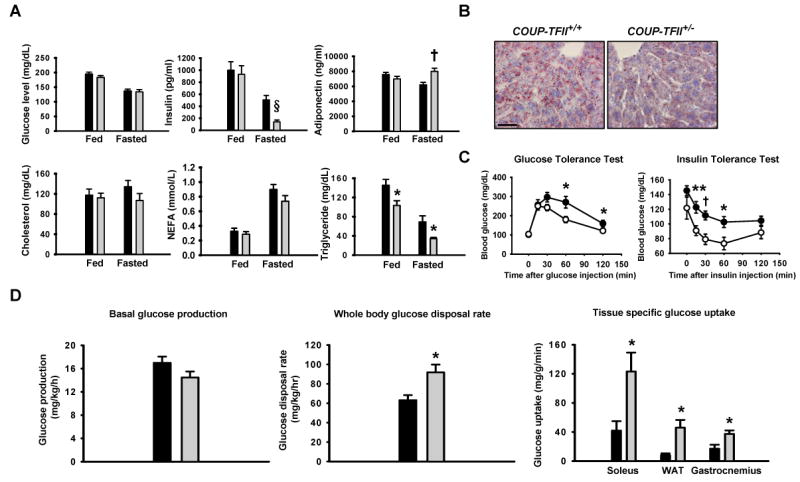
(A). Plasma glucose, insulin, adiponectin, cholesterol, NEFA and triglyceride levels in 3-month-old COUP-TFII+/+ (black box, n=11) and COUP-TFII+/− (gray box, n=11) mice in the fed and fasted overnight states. * p<0.05; † p<0.005; § p<0.0005.
(B). Oil-red-O staining of histological sections of liver taken from 3-month-old COUP-TFII+/+ and COUP-TFII+/− mice fed with normal chow. The red staining indicates neutral lipids. The scale bar shown equals 20 μm, and is applicable to all sections.
(C). Glucose tolerance test and insulin tolerance test on 3-month-old COUP-TFII+/+ (filled circle, n=7) and COUP-TFII+/− (opened circle, n=7) mice. * p<0.05; ** p<0.01; † p<0.005.
(D). Following an overnight fast, 3-month-old COUP-TFII+/+ (black box, n=4) and COUP-TFII+/− (gray box, n=5) mice were subjected to a conscious euglycemic-hyperinsulinemic clamp. Basal glucose production (left); whole-body glucose disposal rate during hyperinsulinemic-euglycemic clamp (middle); muscle (soleus and gastrocnemius) and white adipose tissue glucose uptake during the hyperinsulinemic-euglycemic clamp (right). * p<0.05. Data in (A), (C) and (D) represent mean ± SEM.
To study whole-body and tissue insulin sensitivity in detail, we performed hyperinsulinemic-euglycemic clamps. Basal endogenous glucose production, a measure of liver insulin sensitivity, was not affected by the genotype (Figure 4D left). The whole body glucose disposal rate during the clamp reflects whole-body insulin sensitivity, and was increased by 50% in the COUP-TFII+/− mice relative to the control mice (Figure 4D middle). Skeletal muscle (both soleus and gastrocnemius) glucose uptake measured at the end of the clamp was elevated (3 fold and 2 fold respectively) in the COUP-TFII+/− mice (Figure 4D right). Remarkably, WAT glucose uptake was substantially increased about 6 fold in the COUP-TFII+/− mice (Figure 4D right). As expected, liver glucose uptake was comparable between COUP-TFII+/+ and COUP-TFII+/− mice (Figure S3). Together, these data establish that low dose of COUP-TFII protein results in increased whole-body insulin sensitivity from both improved skeletal muscle and adipose tissue glucose disposal.
COUP-TFII+/− mice are resistant to high-fat diet induced obesity
Despite the similar food intake with wild type mice, the leaner phenotype of COUP-TFII+/− mice suggested that COUP-TFII+/− mice might be protected against high-fat diet induced obesity. To critically assess this, we fed the animals with a high-fat diet containing 45% of calories derived from fat. As expected, control mice gain substantially more body weight throughout the course of high-fat feeding; in contrast, COUP-TFII+/− mice are resistant to high-fat diet induced obesity (Figure 5A). Analysis of body fat content using MRI revealed that COUP-TFII+/− mice are remarkably leaner (15.2 % ±1.4% body fat and 73.5% ± 1.3% body lean) than the control mice (30.0% ± 1.51% body fat and 60.8% ± 1.40% body lean) after 12 weeks of high-fat feeding (Figure 5B). As expected from their obesity, high-fat diet fed control mice developed diabetes as indicated by the glucose tolerance test, as well as insulin resistance, as indicated by the insulin tolerance test (Figure 5C). In contrast, COUP-TFII+/− mice displayed normal glycemic excursions in a glucose tolerance test as compared to the control mice, as well as improved insulin resistance during an insulin tolerance test (Figure 5C). Analysis of mice after 3 months of high-fat diet feeding showed that COUP-TFII+/+ mice have much more visceral WAT (Figure 5D left), where both the BAT and liver were paler in color, and loaded with more lipids as compared with COUP-TFII+/− mice (Figures 5D right, 5E, and FigureS1D). This data clearly indicates that COUP-TFII+/− mice are resistant to obesity induced by high-fat feeding and are protected from developing insulin resistance and glucose intolerance associated with obesity.
Figure 5. COUP-TFII+/− mice are resistant to high-fat diet induced obesity.
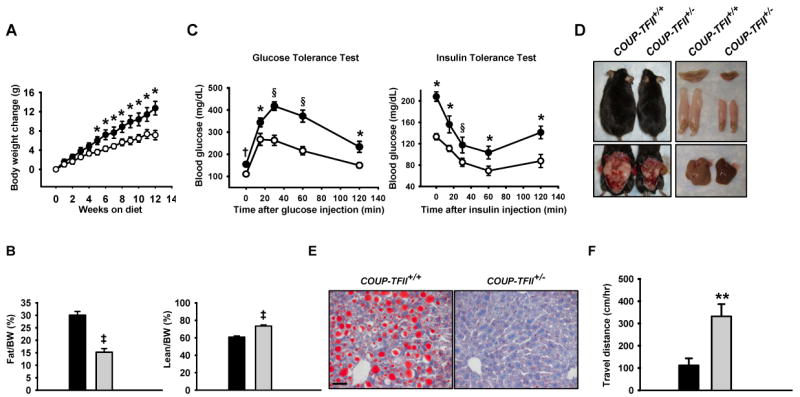
(A). Body weight gain of COUP-TFII+/+ (filled circle, n=9) and COUP-TFII+/− (opened circle, n=8) mice fed a high-fat diet. 8-week-old mice were fed a high-fat diet for 12 weeks. Body weight was measured weekly. * p<0.05.
(B). MRI analysis of body fat and lean content in COUP-TFII+/+ (black box, n=9) and COUP-TFII+/− (gray box, n=8) mice after 12 weeks of high-fat feeding. ‡ p<0.001.
(C). Glucose tolerance test and insulin tolerance test on COUP-TFII+/+ (filled circle, n=9) and COUP-TFII+/− (opened circle, n=8) mice after 12 weeks of high-fat feeding. * p<0.05; † p<0.005; § p<0.0005.
(D). The photograph depicts the appearance of COUP-TFII+/+ and COUP-TFII+/− mice after 12 weeks of high-fat feeding (top left); exposed ventral view of the mice revealed much less WAT mass in COUP-TFII+/− mice (bottom left); much less BAT and EWAT in COUP-TFII+/− mice (top right), and gross morphology of the liver (bottom right). Paler BAT and liver color of COUP-TFII+/+ mice indicated higher lipid accumulation in these organs.
(E). Oil-red-O staining of the liver collected from COUP-TFII+/+ and COUP-TFII+/− mice. The scale bar shown equals 50 μm, and is applicable to all sections.
(F). Locomotion activity was measured in COUP-TFII+/+ (black box, n=6) and COUP-TFII+/− (gray box, n=6) mice under a high-fat diet with the VersaMax animal activity monitoring system. Shown is the average movement during the monitoring period. ** p<0.01. Data in (A-C and F) represent mean ± SEM.
It is known that aging is associated with weight gain, fat deposition, and insulin resistance; these age-related changes contribute to development of diabetes and cardiovascular complications as people age. We therefore examined the phenotypes of mice at 17-18 months of age that were maintained on regular chow. We found that COUP-TFII+/− mice are much leaner than the control group, and are resistant to the development of age-related obesity (Figure S4A). Moreover, a glucose tolerance test reveals impaired glucose tolerance in aged wild-type control mice, whereas COUP-TFII+/− mice at the same age retain a completely normal GTT profile, indicating that they are protected from age-related diabetes (Figure S4B).
COUP-TFII+/− mice have increased energy expenditure
The two major arms of energy balance are energy intake as measured by food intake and energy expenditure. COUP-TFII+/+ and COUP-TFII+/− mice show similar food intake, but COUP-TFII+/− mice are much leaner than the control mice, in addition, COUP-TFII+/− mice are resistant to high-fat diet induced obesity. This data indicates that COUP-TFII+/− mice may have increased energy expenditure. Using indirect calorimetry, we measured oxygen consumption (VO2) and CO2 production rate (VCO2) of mice over a period of two days. VO2 and VCO2 are significantly higher in the dark phase (Figure 6A). As compared to wild-type mice, COUP-TFII+/− mice have elevated VO2 and VCO2 in both light and dark phases. Consistent with the high O2 consumption, COUP-TFII+/− mice generated more heat (17.87 ± 0.48 Kcal/kg/Hr) than the control mice (14.38 ± 0.68 Kcal/kg/Hr) (Figure 6B). Respiratory exchange ratio (RER) was increased in the COUP-TFII+/− mice (0.90 ± 0.005 versus 0.86 ± 0.03 of control mice) (Figure 6C), indicating that the COUP-TFII+/− mice have high rates of energy expenditure due to the high glucose uptake and efficient oxidation of carbohydrates in the skeletal muscle and WAT.
Figure 6. COUP-TFII+/− mice have increased energy expenditure.
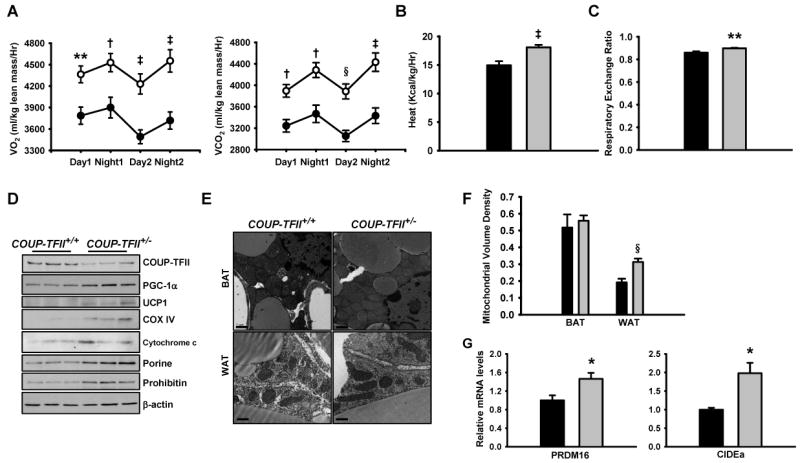
(A). Oxygen consumption (VO2) and carbon dioxide generation (VCO2) analyzed by indirect calorimetry in COUP-TFII+/+ (filled circle, n=8) and COUP-TFII+/− (open circle, n=8) mice. ** p<0.01; † p<0.005; ‡ p<0.001; § p<0.0005.
(B). Heat generation of COUP-TFII+/+ (black box, n=8) and COUP-TFII+/− (gray box, n=8) mice. ‡ p<0.001.
(C). Respiratory exchange ratio of COUP-TFII+/+ (black box, n=8) and COUP-TFII+/− (gray box, n=8) mice. ** p<0.01.
(D). Immunoblots of EWAT (in triplicate) extracts for COUP-TFII, PGC-1α, UCP1 and other structural mitochondrial markers. Tissues were collected from COUP-TFII+/+ and COUP-TFII+/− mice.
(E). Transmission electron microscopy revealed mitochondria in the WAT (bottom) and BAT (top) from COUP-TFII+/+ and COUP-TFII+/− mice. Scale bar for BAT equals 1 μm; scale bar for the WAT equals 500 nm.
(F). Comparison of mitochondrial volume densities from white adipocyte of COUP-TFII+/+ (black box) and COUP-TFII+/− (gray box) depicted in (E) (n=20 micrographs per group). § p<0.0005.
(G). Real-time PCR analysis PRDM16 and CIDEa expression in EWAT collected from COUP-TFII+/+ (black box, n=5) and COUP-TFII+/− (gray box, n=5) mice that have been treated with CL316243 for 6 days. Data in (A-C, F and G) represent mean ± SEM.
Increased energy expenditure could result from an increase in mitochondrial biogenesis. To determine whether there is a change in mitochondrial density in COUP-TFII+/− mice, we examined the expression of structural mitochondrial markers in WAT, BAT, liver, and muscle. Immunoblotting of EWAT extracts demonstrated increased levels of several structural mitochondrial markers such as porine and prohibitin, as well as the electron transport chain proteins cytochrome c and protein subunits of complexes IV (Figure 6D) in COUP-TFII+/− mice as compared with COUP-TFII+/+ mice. In contrast, there was no significant difference in these mitochondrial markers in liver, muscle and BAT in the two types of animals (Figure S5). Again, we also detected increased levels of PGC-1α and the BAT marker UCP1 in COUP-TFII+/− WAT, as compared with the wild-type control WAT (Figure 6D). The increase in mitochondria markers in EWAT is consistent with the observation that enhanced energy expenditure might result from increased mitochondrial volume density in COUP-TFII+/− mice.
Indeed, transmission electron microscopy further revealed a significant elevation of mitochondrial volume density in COUP-TFII+/− WAT, but not in BAT or muscle (Figure 6E and data not shown). Quantitative analysis of this data revealed a 1.6-fold increase in mitochondrial volume density while no difference was observed in brown adipocytes (Figure 6F). Q-PCR analysis of the mitochondrial DNA in COUP-TFII+/− white adipocyte tissue also indicated a 1.4-fold increase in mitochondrial DNA content in comparison to the wild-type control (Figure S6). Taken together, this data shows that the decreased fat mass of COUP-TFII+/− mice results at least partially from general elevated energy expenditure machinery associated with increased mitochondrial volume density in their WAT.
To assess whether the effect of increased mitochondrial content in COUP-TF+/- mice is white adipose specific or if it also applies to other tissues, we treated COUP-TFII+/+ and COUP-TF+/- mice for 6 days with CL316243, a selective β3-adrenergic agonist. BAT-related genes, PRDM16 and CIDEa were greatly enhanced in the WAT of COUP-TF+/- mice (Figure 6G). However, the expression of PRDM16 and CIDEa in BAT are increased to a similar level between COUP-TFII+/+ and COUP-TF+/- mice (data not shown). Consistent with the similar mitochondria number in BAT of COUP-TFII+/+ and COUP-TF+/- mice, the cold challenge test indicated that the BAT of COUP-TF+/- mice functioned as normal as wild type (data not shown). Therefore, the difference in energy metabolism in the COUP-TFII heterozygous mice is not resulted from changes in the mitochondrial content of the BAT or muscle.
Since the mitochondrial DNA content in the muscle and BAT is not different and it is unlikely that the WAT is the sole contributor for the increase in energy expenditure of COUP-TF+/- mice, we asked whether there is a difference at the level of physical activity. To assess this possibility, we monitored the locomotor activity of animals under a high-fat diet. As shown in Figure 5F, COUP-TFII+/- mice are profoundly hyperactive, and have a 3-fold increase in physical movement compared to the controls. Therefore, increased locomotion activity is another factor that contributes to the high-energy expenditure in COUP-TFII+/- mice.
Discussion
One of the most distinctive phenotypes caused by haploinsufficiency of COUP-TFII in mouse was the impairment of WAT development. The importance of the precise control of COUP-TFII expression levels was also evident in in vitro analyses as well. In addition, we demonstrated that reduction of COUP-TFII expression in 3T3L1 cells results in an increase of Wnt signaling, which is known to be a repressive factor for adipogenesis. Furthermore, we used an inducible system to knockout COUP-TFII in mice and demonstrated that COUP-TFII is essential for the proper formation of adipocytes (Figure 1C bottom), supporting the positive role of COUP-TFII in adipogenesis. Taken together, the in vivo and in vitro observations indicate that COUP-TFII is required for adipocyte differentiation. The important role played by COUP-TFII in adipocyte differentiation is also consistent with the finding that seven-up, the Drosophila ortholog of COUP-TFII, is important for fat body development in flies (Hoshizaki et al., 1994).
During the preparation of this manuscript, Xu et al. reported that COUP-TFII is critical in adipocyte differentiation from 3T3-L1 (Xu et al., 2008). Contrary to our data, their data showed that COUP-TFII plays a negative role in adipogenesis. Over-expression of COUP-TFII reduced and under-expression of COUP-TFII induced adipogenesis in 3T3L1 cells. Since they used a retrovirus system to carry out their studies and we did not, we repeated our experiment using the same viral system to knock down COUP-TFII in 3T3-L1 cells, and the result is consistent with our data showing that down regulation of COUP-TFII resulted in decreased adipocyte differentiation (Figure S2). In any event, our in vitro data from 3T3-L cells either using siRNA knocking down or a retroviral system is consistent with those from COUP-TFII null MEFs as well as those phenotypes observed in vivo in COUP-TFII+/- mice. The exact reason for the difference is not clear. Since a transient increase in COUP-TFII expression is observed 4 to 24 hours subsequent to induction of differentiation in 3T3-L1 cells (Fu et al., 2005 and the current data), it is likely that COUP-TFII is needed for adipogenesis at an early expansion phase and its presence at late time points during differentiation may be inhibitory. Therefore, the different times when COUP-TFII was knocked down may explain the difference between Xu's results and ours.
In the mouse, the characteristic morphology of adipocytes develops during the first 24 hr after birth, and there is little or no lipid accumulation at the time of birth (Ailhaud et al., 1992). After rapid development, however, differentiation of adipocytes from preadipocytes is believed to continue throughout the lifetime of an animal (Rosen, 2002). Adipocytes develop from mesenchymal stem cells that are characterized by multipotency. The high expression level of COUP-TFII in mesenchymal cells indicates that this transcription factor may play a role in lineage determination. The lower WAT mass in COUP-TFII+/− mice and the reduced adipocyte differentiation seen in COUP-TFII null MEFs and COUP-TFII knock down 3T3-L1 cells are consistent with COUP-TFII's role in early adipocyte differentiation, although the present experiment cannot distinguish COUP-TFII's role in preadipocytes from an effect on lineage commitment. To further elucidate the role of COUP-TFII in lineage determination and early differentiation, it will be important to examine the activity of COUP-TFII in a model in which multipotent stem cells differentiate into preadipocytes.
COUP-TFII+/− mice are lean and exhibit markedly improved glucose tolerance due to increased peripheral tissue insulin sensitivity (Figure 1F, 4C and 4D). Moreover, they are resistant to high-fat diet induced obesity (Figure 5A), and age-related weight gain (Figure S4A). Here we show that COUP-TFII+/− mice are resistant to the impaired glucose tolerance and poor insulin responsiveness observed in wild-type mice fed a high-fat diet (Figure 5C). Markedly improved glucose tolerance was observed in aged COUP-TFII+/− mice while as compared with control mice (Figure S4B). Hyperinsulinemic-euglycemic clamps revealed that increased whole-body insulin sensitivity in COUP-TFII+/− mice resulted from both improved skeletal muscle and white adipose tissue glucose disposal (Figure 4D). Taken together, this data indicates that the increased glucose tolerance observed in COUP-TFII+/− mice is due to increased insulin responsiveness. Thus, COUP-TFII may be an important modulator of potential linkages between adipocyte metabolism and whole-body glucose tolerance.
Since the total body fat mass in COUP-TFII+/− mice on a standard diet is reduced by 30% in comparison with wild-type mice (Figure 1F) without any significant change in food consumption (Figure 1E), a net increase in energy expenditure must exsist. Furthermore, COUP-TFII+/− mice appear to be able to up-regulate energy dissipation when fed with a high-fat diet, as demonstrated by the reduced weight gain (Figure 5A), as well as a relative resistance to diet-induced insulin resistance (Figure 5C). One possible mechanism by which this could be achieved is through the upregulation of mitochondrial biogenesis, which could provide a means for an increased flow of FFA to the mitochondria. An increase in density and/or biological activity of mitochondria, as reflected by the increased levels of COXIV and PGC-1α (Figure 6D), would further enhance this process. The relevance of this hypothesis is underscored by the fact that COUP-TFII+/− mice exhibit increased mitochondrial volume density in their WAT (Figures 6E, 6F and Figure S6) in association with their increased oxygen consumption (Figure 6A). Our data shows that the proteins of the mitochondrial electron transport chain are negatively controlled by COUP-TFII, and the appearance of the uncoupling protein UCP1 was observed in WAT of COUP-TFII+/− mice (Figure 6D). UCP1 is normally expressed only in brown fat that is believed to divert the energy derived from mitochondrial electron transport that would normally generate ATP into heat production. This uncoupling effect greatly accelerates oxygen consumption. In the white adipose tissue, COUP-TFII might act normally to attenuate the expression of UCP1 and genes involved in fatty acid oxidation and mitochondrial respiration.
Taken together, phenotypic analysis using the COUP-TFII haploinsufficiency mouse model indicates an important role of this gene in WAT development and metabolism. Although use of this model might be limited for overall phenotypic analysis, it could reveal the global impact of a gene dosage effect on adipogenesis. Detailed molecular and cellular mechanisms could be elucidated by conditional gene targeting approaches, using a specific Cre recombinase to delete COUP-TFII at different stages during adipocyte differentiation.
In summary, the present study discovered an important role played by COUP-TFII in adipocyte differentiation in vivo. Moreover, COUP-TFII+/- mice display enhanced glucose tolerance and insulin sensitivity compared with control mice; data presented here demonstrates that COUP-TFII likely plays a key role as a metabolic regulator. Then, the pharmacological manipulation of COUP-TFII may allow individuals to lose weight while maintaining a normal caloric intake and improved insulin sensitivity. In this way, COUP-TFII is a potential drug target candidate for the treatment of obesity, insulin resistance, and type 2 diabetes.
Experimental Procedures
Animal Experiments
The generation of COUP-TFII knock out mice has been described previously (Pereira et al., 1999). The COUP-TFII-LacZ knock-in mice were generated by homologous recombination in ES cells and described previously (Takamoto et al., 2005b). Wild type and heterozygous mice used for comparison are from littermates. Male COUP-TFII+/- mice and female COUP-TFII+/+ mice bred all the mice used in this study. Mice used for data analysis in this study were male unless otherwise indicated. Mice homozygous for a floxed COUP-TFII allele (COUP-TFII flox/flox) (Takamoto et al., 2005b) were mated with mice expressing the tamoxifen-inducible CRE-ERT2 fusion protein under the control of the ubiquitous ROSA26 promoter (ROSA26CRE-ERT2/+) (de Luca et al., 2005) to generate ROSA26CRE-ERT2/+, COUP-TFII flox/flox (Cre mice) and COUP-TFII flox/flox littermates (non Cre mice). Mice used in this study were backcrossed 3 generations to C57BL/6J background, except for COUP-TFII-LacZ knock-in mice that were used for X-gal staining, ROSA26CRE-ERT2/+ and COUP-TFII flox/flox for MEFs, which were on a mixed genetic background (129S6/C57B6). All animal experiments were performed according to the protocol approved by the animal care research committee of the Baylor College of Medicine.
Plasma glucose concentration was measured by the Quantichrom™ glucose assay kit (DIGL-200, BioAssay Systems). Plasma insulin was determined with an ultra sensitive rat insulin ELISA kit (Crystal Chem INC) by using mouse insulin standard. Plasma FFA was measured with a NEFA C test kit (Wako). Plasma triglyceride levels were analyzed by using a serum triglyceride determination kit (Sigma). Plasma cholesterol was determined with a cholesterol/cholesteryl ester quantitation kit (BioVision). Plasma leptin levels were measured by using a mouse leptin ELISA kit (Millipore). Plasma adiponectin concentration was determined using a mouse adiponectin ELISA kit (Millipore).
For β3-adrenergic agonist induction, mice received CL316243 (Sigma) solution (0.5 mg/kg) daily by intraperitoneal injection for 6 days, and EWAT were collected 4 hr following the final injection on day 6.
MRI analysis of body fat content was carried out using an EchoMRI™ whole body composition analyzer (Echo Medical Systems).
Energy expenditure for mice is measured by using the Columbus Instruments Oxymax System. The system monitors O2 and CO2 gas fractions at both the inlet and output ports of up to 16 chambers through which a known flow of air is passing. The gas fraction and flow measurements are used to compute VO2, VCO2, RER (respiratory exchange ratio) and heat. Animals were allowed to acclimatize to the chambers for 24 hr, and measurements were taken subsequently for 48 hr during the light cycle and dark cycle while mice are freely to access food and water.
Locomotion activity assay was performed by using the VersaMax animal activity monitoring system (AccuScan Instruments Inc. Columbus, Ohio, USA) that simultaneously measures physical movements for mice. Mice were acclimated in the monitoring chambers for one day before the experiment. Data was collected every 5 minutes for each mouse over a period of 16 hours while mice are freely allowed to access food and water.
Preparation of MEFs, cell culture, transfection and induction of adipogenic differentiation
A male mouse (ROSA26CRE-ERT2/+, COUP-TFII flox/flox) was mated with female mouse (COUP-TFIIflox/flox), and primary MEFs were isolated from E12.5 littermate embryos and cultured at 37°C in Dulbecco's Modified Eagle's medium (DMEM; Invitrogen) plus 10% fetal bovine serum (FBS) (Invitrogen). Cells after 3 passages were plated to 6-well plastic dishes and propagated to confluence. 4-hydroxy-tamoxifen (4OH-TM) (Sigma) was dissolved in ethanol to make a 1 mM stock solution and further diluted to a final concentration of 1 μM with medium prior to use. Two days later, the medium was replaced with a differentiation induction medium containing 0.5 mM 3-isobutyl-1-methyl-xanthine (MIX) (Sigma), 1 μM dexamethasone (DEX) (Sigma), 5 μg/ml insulin (INS) (Sigma), 10% FBS and 0.5 μM rosiglitazone (Cayman Chemical Company). Forty-eight hours later, cells were changed to a medium containing 5 μg/ml INS and 0.5 μM rosiglitazone. The medium was renewed every other day. At day 8 post-induction, the appearance of cytoplasmic lipid accumulation was stained with Oil-Red-O.
3T3-L1 cells were obtained from American Type Culture Collection (Manassas, VA), and were induced for differentiation using standard protocols (Wu et al., 1999). 3T3-L1 preadipocyte cells were transfected with COUP-TFII smart pool siRNA (Dharmacon) and non-targeting control siRNA pool (Dharmacon) using DharmaFECT 3 reagent following manufacturer's instructions. Stable COUP-TFII overexpression cells were achieved by transfection of 3T3-L1 cells with COUP-TFII cDNA construct using Lipofectamine 2000 (Invitrogen). Cells were plated into 30 cm diameter Petri dishes and grown for 48–72 hr, after which selection with G418 (0.8 mg/ml) was initiated. Selection was stopped as soon as the noninfected control cell died off, and colonies were picked up and maintained in growth media with G418 (0.2 mg/ml).
Chromatin immunoprecipitation (ChIP) assays
ChIP assays were performed by using an assay kit (Upstate Biotechnology) and monoclonal anti-COUP-TFII antibody (Perseus Proteoteomics, Inc) following the manufacturer's recommendation. The sequences of all used primers are available on request.
Histological analysis
Tissue were fixed overnight in 10% formalin at 4 °C, dehydrated, embedded in paraffin, and sectioned at 7 um for H&E staining.
X-gal staining of WAT tissues from COUP-TFII-LacZ knock-in mice was performed as described previously (Takamoto et al., 2005a), except that fat tissue was embedded in 15% gelatin in PBS instead of OCT compound.
Tissues for transmission electron microscopy were processed as described (Kurihara et al., 2007); the ultra thin sections were examined under a JEOL 1010 Transmission Electron Microscope. To calculate the mitochondrial volume density, micrographs (n=20) were opened under the software Image J, and the area of total mitochondria was expressed as a fraction of total cytoplasm area.
Glucose tolerance test, insulin tolerance test, and hyperinsulinemic clamp
The glucose tolerance test (GTT) and insulin tolerance test (ITT) were carried out on the male mice of 10-12 weeks old unless otherwise indicated. Prior to studies, mice fasted overnight (GTT) or for 6 hr (ITT). In GTT studies, mice were injected intraperitoneally (IP) with a D-glucose solution (2 g/kg body weight). For ITT, mice received an IP injection of human insulin (Eli Lilly) at a dose of 1 U/kg of body weight. Tail blood glucose concentration was measured at 0, 15, 30, 60 and 120 min after challenge using the commercially available ONETOUCH Ultra blood glucose meter and test strips (Life Scan). A hyperinsulinemic clamp was performed, and calculated as described previously (Saha et al., 2004).
Real-time PCR Assays
Total mRNA was isolated from tissues using TRIzol reagent (Invitrogen) according to manufacturer's instructions. The mRNA for genes of interest were quantitated with either TaqMan-based or Sybr Green-based RT-PCR using the ABI Prism 7700 sequence detection system (Applied Biosystems). Reverse transcription of RNA was carried out by using random primers and SuperScript™ II Reverse Transcriptase (Invitrogen). Real-time PCR was performed using TaqMan Universal PCR Master Mix or SYBR® Green PCR Master Mix (Applied Biosystems) according to the manufacturer's instructions. Means for mRNA expression between WT and COUP-TFII+/− mice were compared using a student's t test.
Supplementary Material
Acknowledgments
We appreciate many helpful discussions with Drs. Khoi Chu and Benny Hung-Junn Chang and technique help from Ms Xuefei Tong, Wei Qian, and Grace Wen Chen. We gratefully acknowledge Mr. Firoz A Vohra of the Children's Nutrition Research Center at Baylor College of Medicine for their expert technical assistance in energy expenditure study and Mr. Kenneth Dunner at M.D. Anderson Cancer Center for TEM. We thank Dr. Thomas Ludwig in the Department of Anatomy and Cell Biology at Columbia University for providing us with ROSA26CRE-ERT2/+ mice, and Ms Jodie R. Weeks for the help in preparation of this manuscript. This study was supported by National Institutes of Health research grants to MJT (DK45641, HD17379), SYT (P01DK59820 and HL076448), LC (HL51586) and DERK Center grant to Baylor (DK P30 DK079638).
Footnotes
Publisher's Disclaimer: This is a PDF file of an unedited manuscript that has been accepted for publication. As a service to our customers we are providing this early version of the manuscript. The manuscript will undergo copyediting, typesetting, and review of the resulting proof before it is published in its final citable form. Please note that during the production process errors may be discovered which could affect the content, and all legal disclaimers that apply to the journal pertain.
References
- Ailhaud G, Grimaldi P, Negrel R. Cellular and molecular aspects of adipose tissue development. Annu Rev Nutr. 1992;12:207–233. doi: 10.1146/annurev.nu.12.070192.001231. [DOI] [PubMed] [Google Scholar]
- Biddinger SB, Kahn CR. From mice to men: insights into the insulin resistance syndromes. Annu Rev Physiol. 2006;68:123–158. doi: 10.1146/annurev.physiol.68.040104.124723. [DOI] [PubMed] [Google Scholar]
- de Luca C, Kowalski TJ, Zhang Y, Elmquist JK, Lee C, Kilimann MW, Ludwig T, Liu SM, Chua SC., Jr Complete rescue of obesity, diabetes, and infertility in db/db mice by neuron-specific LEPR-B transgenes. J Clin Invest. 2005;115:3484–93. doi: 10.1172/JCI24059. [DOI] [PMC free article] [PubMed] [Google Scholar]
- Farmer SR. Transcriptional control of adipocyte formation. Cell Metabolism. 2006;4:263–273. doi: 10.1016/j.cmet.2006.07.001. [DOI] [PMC free article] [PubMed] [Google Scholar]
- Fu M, Sun T, Bookout AL, Downes M, Yu RT, Evans RM, Mangelsdorf DJ. A nuclear receptor atlas: 3T3-L1 adipogenesis. Mol Endocrinol. 2005;19:2437–2450. doi: 10.1210/me.2004-0539. [DOI] [PubMed] [Google Scholar]
- Hoshizaki DK, Blackburn T, Price C, Ghosh M, Miles K, Ragucci M, Sweis R. Embryonic fat-cell lineage in Drosophila melanogaster. Development. 1994;120:2489–2499. doi: 10.1242/dev.120.9.2489. [DOI] [PubMed] [Google Scholar]
- Krssak M, Roden M. The role of lipid accumulation in liver and muscle for insulin resistance and type 2 diabetes mellitus in humans. Rev Endocr Metab Disord. 2004;5:127–134. doi: 10.1023/B:REMD.0000021434.98627.dc. [DOI] [PubMed] [Google Scholar]
- Kurihara I, Lee DK, Petit FG, Jeong J, Lee K, Lydon JP, Demayo FJ, Tsai MJ, Tsai SY. COUP-TFII mediates progesterone regulation of uterine implantation by controlling ER activity. PLoS Genet. 2007;3:e102. doi: 10.1371/journal.pgen.0030102. [DOI] [PMC free article] [PubMed] [Google Scholar]
- Lee CT, Li L, Takamoto N, Martin JF, Demayo FJ, Tsai MJ, Tsai SY. The nuclear orphan receptor COUP-TFII is required for limb and skeletal muscle development. Mol Cell Biol. 2004;24:10835–10843. doi: 10.1128/MCB.24.24.10835-10843.2004. [DOI] [PMC free article] [PubMed] [Google Scholar]
- Moldes M, Zuo Y, Morrison RF, Silva D, Park BH, Liu J, Farmer SR. Peroxisome-proliferator-activated receptor gamma suppresses Wnt/beta-catenin signalling during adipogenesis. Biochem J. 2003;376:607–613. doi: 10.1042/BJ20030426. [DOI] [PMC free article] [PubMed] [Google Scholar]
- Pereira FA, Qiu Y, Zhou G, Tsai MJ, Tsai SY. The orphan nuclear receptor COUP-TFII is required for angiogenesis and heart development. Genes Dev. 1999;13:1037–1049. doi: 10.1101/gad.13.8.1037. [DOI] [PMC free article] [PubMed] [Google Scholar]
- Petit FG, Jamin SP, Kurihara I, Behringer RR, Demayo FJ, Tsai MJ, Tsai SY. Deletion of the orphan nuclear receptor COUP-TFII in uterus leads to placental deficiency. Proc Natl Acad Sci USA. 2007;104:6293–6298. doi: 10.1073/pnas.0702039104. [DOI] [PMC free article] [PubMed] [Google Scholar]
- Rosen ED. The molecular control of adipogenesis, with special reference to lymphatic pathology. Ann N Y Acad Sci. 2002;979:143–158. doi: 10.1111/j.1749-6632.2002.tb04875.x. [DOI] [PubMed] [Google Scholar]
- Rosen ED, Spiegelman BM. Molecular regulation of adipogenesis. Annu Rev Cell Dev Biol. 2000;16:145–171. doi: 10.1146/annurev.cellbio.16.1.145. [DOI] [PubMed] [Google Scholar]
- Ross SE, Hemati N, Longo KA, Bennett CN, Lucas PC, Erickson RL, MacDougald OA. Inhibition of adipogenesis by Wnt signaling. Science. 2000;289:950–953. doi: 10.1126/science.289.5481.950. [DOI] [PubMed] [Google Scholar]
- Saha PK, Kojima, Martinez-Botas HJ, Sunehag AL, Chan L. Metabolic adaptations in the absence of perilipin: increased beta-oxidation and decreased hepatic glucose production associated with peripheral insulin resistance but normal glucose tolerance in perilipin-null mice. J Biol Chem. 2004;279:35150–35158. doi: 10.1074/jbc.M405499200. [DOI] [PubMed] [Google Scholar]
- Spiegelman BM, Flier JS. Obesity and the regulation of energy balance. Cell. 2001;104:531–543. doi: 10.1016/s0092-8674(01)00240-9. [DOI] [PubMed] [Google Scholar]
- Takamoto N, Kurihara I, Lee K, Demayo FJ, Tsai MJ, Tsai SY. Haploinsufficiency of chicken ovalbumin upstream promoter transcription factor II in female reproduction. Mol Endocrinol. 2005a;19:2299–2308. doi: 10.1210/me.2005-0019. [DOI] [PMC free article] [PubMed] [Google Scholar]
- Takamoto N, You LR, Moses K, Chiang C, Zimmer WE, Schwartz RJ, Tsai MJ, Tsai SY. COUP-TFII is essential for radial and anteroposterior patterning of the stomach. Development. 2005b;132:2179–2189. doi: 10.1242/dev.01808. [DOI] [PubMed] [Google Scholar]
- Wu Z, Rosen ED, Brun R, Hauser S, Adelmont G, Troy AE, McKeon C, Darlington GJ, Spiegelman BM. Cross-regulation of C/EBPα and PPARγ controls the transcriptional pathway of adipogenesis and insulin sensitivity. Mol Cell. 1999;3:151–158. doi: 10.1016/s1097-2765(00)80306-8. [DOI] [PubMed] [Google Scholar]
- Xu Z, Yu S, Hsu CH, Eguchi J, Rosen ED. The orphan nuclear receptor chicken ovalbumin upstream promoter-transcription factor II is a critical regulator of adipogenesis. Proc Natl Acad Sci USA. 2008;105:2421–2426. doi: 10.1073/pnas.0707082105. [DOI] [PMC free article] [PubMed] [Google Scholar]
- You LR, Lin FJ, Lee CT, DeMayo FJ, Tsai MJ, Tsai SY. Suppression of Notch signalling by the COUP-TFII transcription factor regulates vein identity. Nature. 2005a;435:98–104. doi: 10.1038/nature03511. [DOI] [PubMed] [Google Scholar]
- You LR, Takamoto N, Yu CT, Tanaka T, Kodama T, DeMayo FJ, Tsai MJ, Tsai SY. Mouse lacking COUP-TFII as an animal model of Bochdalek-type congenital diaphragmatic hernia. Proc Natl Acad Sci USA. 2005b;102:16351–16356. doi: 10.1073/pnas.0507832102. [DOI] [PMC free article] [PubMed] [Google Scholar]
Associated Data
This section collects any data citations, data availability statements, or supplementary materials included in this article.