

Abstract
Deep brain stimulation (DBS) in the subthalamic nucleus (STN) is an effective tool for the treatment of advanced Parkinson's disease. The mechanism by which STN DBS elicits its beneficial effect, however, remains unclear. We previously reported STN stimulation increased the rate and produced a more regular and periodic pattern of neuronal activity in the internal segment of the globus pallidus (GPi). Here we extend our observations to neurons in the pallidal [ventralis lateralis pars oralis (VLo) and ventralis anterior (VA)] and cerebellar [ventralis lateralis posterior pars oralis (VPLo)] receiving areas of the motor thalamus during STN DBS. Stimulation parameters that produced improvement in rigidity and bradykinesia resulted in changes in the pattern and power of oscillatory activity of neuronal activity that were similar in both regions of the motor thalamus. Neurons in both VA/VLo and VPLo tended to become more periodic and regular with a shift in oscillatory activity from low to high frequencies. Burst activity was reduced in VA/VLo, but was not significantly changed in VPLo. There was also a significant shift in the population of VA/VLo neurons that were inhibited during STN DBS, whereas VPLo neurons tended to be activated. These data are consistent with the hypothesis that STN DBS increases output from the nucleus and produces a change in the pattern and periodicity of neuronal activity in the basal ganglia thalamic network, and that these changes include cerebellar pathways likely via activation of adjacent cerebello-thalamic fiber bundles.
Keywords: STN, MPTP, thalamus, DBS, oscillation, pattern
Introduction
Deep brain stimulation (DBS) is increasingly being used for the treatment of neurological disorders. The FDA has approved its use for Parkinson's disease (PD) and essential tremor and there is a humanitarian device exemption for dystonia. Exploration into its application for psychiatric disorders such as obsessive compulsive disorder and depression are ongoing. Although a potentially powerful tool for the treatment of neurological disorders, the mechanism underlying its therapeutic effect remains under debate. Early hypotheses centered on the concept that DBS exerts its beneficial effect by inhibiting neuronal activity and decreasing output from the stimulated structure (Benazzouz et al., 1995; Benazzouz et al., 1997; Benazzouz and Hallett, 2000). This hypothesis was based on the observation that the effect of stimulation and lesioning in the subthalamic nucleus (STN), internal segment of the globus pallidus (GPi) or the ventral intermediate nucleus of the thalamus (Vim) on parkinsonian motor signs, essential tremor and dystonia were similar. Further support for this hypothesis was also derived from reports of suppression of STN neuronal activity during STN stimulation with similar observations being made in GPi and Vim (Dostrovsky et al., 2000; Wu et al., 2001).
Subsequent studies in which recordings were obtained in the nucleus receiving projections from the stimulated site, however, did not support the suppression hypothesis (Anderson et al., 2003; Hashimoto et al., 2003; Pralong et al., 2003; Montgomery, 2006). Increased mean discharge rates in GPi were observed during STN stimulation in the monkey model of PD (Hashimoto et al., 2003) and thalamic activity was inhibited in normal monkeys during GPi stimulation (Anderson et al., 2003) and in patients with dystonia (Pralong et al., 2003; Montgomery, 2006). Modeling studies suggested that stimulation could suppress activity in the cell body, while activating axons projecting from the stimulated structure (McIntyre and Grill, 2000, 2002) and both microdialysis (Windels et al., 2000, 2003) and imaging (fMRI and PET) studies have supported the hypothesis that stimulation activates output from the stimulated site (Jech et al., 2001; Jech, 2002; Perlmutter et al., 2002; Hershey et al., 2003).
As part of ongoing studies in our laboratory examining the mechanisms of DBS we explored the effect of STN stimulation on neuronal activity in the pallidal receiving area [ventralis anterior (VA) and ventralis lateralis pars oralis (VLo)] and cerebellar receiving area [ventralis posterior lateralis pars oralis (VPLo)] of the motor thalamus in primates made parkinsonian with the neurotoxin 1-methyl-4-phenyl-1,2,3,6-tetrahydropyridine (MPTP). We observed distinct changes in the pattern and mean discharge rate of neuronal activity in the vast majority of neurons in both VA/VLo and VPLo during STN stimulation that were consistent with the hypothesis that STN stimulation activates the output of the stimulated structure as well as adjacent fiber pathways. These data further illustrate that STN stimulation induces alterations in neuronal activities that permeate throughout the basal ganglia thalamocortical network.
Materials and Methods
All surgical procedures and behavioral protocols were approved by the Institutional Animal Care and Use Committee and complied with United States Public Health Service policy on the humane care and use of laboratory animals.
Surgical procedures.
Two adult rhesus monkeys (Macaca mulatta; R7160- female, 5.2 kg and R370- male, 6.9 kg) were used in this study. These were the same monkeys used in a previous report of the effect of STN DBS on GPi neuronal activity. The methods of data collection and analysis as well as the surgical procedures of the current study are described in detail in this report (Hashimoto et al., 2003). Briefly, a hemiparkinsonian syndrome was induced by unilateral intracarotid injections of the neurotoxin 1-methyl-4-phenyl-1, 2, 3, 6-tetrahydropyridine (MPTP, 0.4–0.6 mg/kg over the course of ∼10 min) during aseptic surgical procedures performed under isoflurane anesthesia. Injections were repeated until a stable parkinsonian state characterized by contralateral rigidity and bradykinesia was achieved (usually 1–2 injections). A craniotomy was performed and a recording chamber implanted over the craniotomy site in a subsequent aseptic procedure under isoflurane anesthesia with the head held in a primate stereotaxic instrument. Stainless steel screws were secured to the skull, and the implant system consisting of screws, recording chamber and head stabilization receptacle was bonded together with dental acrylic. During a 2-week postoperative recovery period, the monkeys were given unlimited food and water, analgesics, and extra fruit. Prophylactic antibiotics were given preoperatively and continued postoperatively for 10 d.
Electrical stimulation.
An electrophysiological map of the STN and surrounding area was compiled by classifying neuron activity using the same techniques commonly used during human functional neurosurgery (Vitek et al., 1998). A scaled-down version of a DBS lead used in humans (Model 3387, Medtronic) was then implanted into the STN as described by Elder et al. (2005). The DBS lead had four metal contacts each with a diameter of 0.76 mm, a height of 0.50 mm, and a separation between contacts of 0.50 mm. The lead was connected to a programmable pulse generator (Itrel II, Medtronic) implanted subcutaneously between the scapulae. The maximum therapeutic benefit with bipolar stimulation (to minimize stimulation artifacts) was determined by systematically varying contacts, pulse duration, frequency, and voltage as described by Hashimoto et al. (2003). This combination of stimulation parameters was then termed “effective stimulation” (Hashimoto et al., 2003). Once this combination of stimulation parameters was identified the frequency, pulse duration and combination of contacts was kept constant while the voltage was decreased to that which did not produce a therapeutic effect. This combination of stimulation parameters which was identical to those chosen for effective stimulation except for a reduced voltage was termed “ineffective stimulation”. After the DBS lead was implanted into the STN, spontaneous activity of single neurons was recorded in VA/VLo and VPLo before, during and after high frequency (136 Hz) stimulation, while the monkey sat quietly in the primate chair. Both effective and ineffective stimulation parameters were used for each isolated neuron when it was possible to hold the cell long enough to assess both stimulation conditions. For some neurons only effective or ineffective stimulation conditions were able to be assessed and compared with baseline.
Single neuron recording.
The locations of VA/VLo, VPLo and nearby structures were identified by mapping the activity of single neurons with a microelectrode during a series of electrode penetrations. During recording sessions the monkeys were seated in a primate chair with the head restrained. Glass-insulated platinum-iridium microelectrodes (impedance 0.5–1.0 MΩ at 1 kHz) were advanced by a microdrive (Narishige Scientific Instruments) attached to the recording chamber. The recording chamber was oriented such that the microelectrode penetrations were made in the parasagittal plane in an anterodorsal to posteroventral direction at an angle of 70° degree to the orbitomeatal line. This approach allowed recording from several thalamic subnuclei such as VA/VLo and VPLo in one penetration. The microelectrode was slowly driven deeper into the thalamus while the acoustically transduced neuronal activity was monitored continuously as the monkey performed voluntary movement or was examined passively by the researcher.
Signals from the microelectrode were amplified and filtered using standard techniques. The filtered analog signals were sampled with a resolution of 20 μs and stored on a computer hard disk for later off-line analysis. Stimulation artifacts were removed from the digitized neuronal recordings as described by Hashimoto et al. 2002 (Hashimoto et al., 2002) and action potentials were discriminated. The sequence of action potential and stimulation times was stored for further analysis. Data from both animals were pooled in the combined analysis, except where noted.
Behavioral assessment.
A method for determining therapeutic stimulation parameters was detailed previously (Hashimoto et al., 2003). Briefly, the implanted programmable pulse generator was turned on using a set of stimulation parameters similar to that used in humans, and the monkey's spontaneous behavior was videotaped while in a special observation cage. The number and time of spontaneous movements was evaluated using a computer-assisted method of behavioral assessment (Bergman et al., 1990). Two scorers blinded to the experimental condition counted the total movement time over 10 min for the arm and leg on the right and left sides of the body from the video. A post hoc analysis (Tukey's honestly significant difference) was used to determine the significance of the difference in the amount of time of limb movement under the different testing conditions, i.e., no stimulation, effective stimulation and ineffective stimulation. Muscle tone of the biceps brachii muscles evoked by manual elbow extension contralateral to the HFS was assessed using electromyography (EMG). The most effective pair of stimulating electrode contacts was chosen for bipolar stimulation in each animal after evaluation of the clinical effect and the adverse effects. The threshold for adverse effects was determined by inspection of the animal for capsular responses with the onset of stimulation.
Data analysis.
A PSTH of activity before, during, and after stimulation was constructed by aligning the occurrence of action potentials with the onset of each stimulation pulse during stimulation, or to computer generated trigger pulses with the same frequency as the stimulation pulses during spontaneous activity before and after stimulation. The discharge rate within each bin of the PSTH during stimulation was tested for a significant increase or decrease by evaluating the probability that the change in discharge rate within each bin could have occurred by chance compared with the discharge rate predicted by a Poisson distribution with a mean rate of the corresponding bin in the prestimulation PSTH (p ≤ 0.05). Changes in the overall pattern of each PSTH was evaluated by comparing the distribution of bins in the PSTH during stimulation with the distribution of bins in the PSTH before stimulation using a Kolmogorov–Smirnov goodness of fit test. The incidence and burst characteristics of thalamic neurons in the pallidal and cerebellar receiving areas were also determined under the different testing conditions. Bursting, although not rigidly defined in the literature, is generally characterized as short intervals of time when action potential firing frequency is highly elevated compared with the baseline rate. We identified bursts using a modified version of the Poisson surprise method (Legendy and Salcman, 1985). Putative bursts were first identified as sequences of interspike intervals (ISI) that were less than the mean ISI of the series. These putative bursts were further refined by calculating the surprise index (SI) of every combination of contiguous spikes and taking the combination with the highest SI (lowest probability of occurrence). Spikes removed from putative bursts during this procedure were reassigned to the adjacent nonburst period. Bursts found in this manner were rejected if they did not consist of a minimum of 3 spikes or have an SI value of at least 3 (Wichmann and Soares, 2006), with the spikes being reassigned to the adjacent nonburst period.
The discharge properties within burst and nonburst periods were analyzed separately. The mean firing rate and coefficient of variation (CV) was calculated for each burst and nonburst period, as well as the time intervals between the onset of bursts and nonburst periods. Statistical comparison of the mean of these firing parameters with stimulation and control period was performed using t tests (α = 0.05). Differences between the proportion of neurons exhibiting changes in these parameters during effective and ineffective stimulation were analyzed using a χ2 test (α = 0.05). Oscillatory activity was assessed by evaluating the power in different frequency ranges as the ratio of the power in each range to the total power in the entire spectrum.
Electrophysiological and histological criteria for localization of neurons within specific thalamic subnuclei.
Microstimulation was used during electrophysiological recording of neuronal activities to help distinguish thalamic subnuclei. Microstimulation was delivered through the recording electrode at selected intervals at the time of recording in each track at 10–40 μA with 100 ms trains of balanced bipolar pulse pairs (200 μs cathodal pulse, 100 μs gap, 200 μs anodal pulse) at 400 Hz. Motor responses to microstimulation in the form of evoked movement are present in VPLo but not in VA/VLo (Vitek et al., 1996). Histologically the different subnuclei in the VA/VLo, VPLo, and neighboring subnuclei are distinguished using distinct cytoarchitectonic and chemoarchitectonic criteria. Histologic criteria used for identification of neurons within specific thalamic subnuclei are described in detail in our previous publication (Vitek et al., 1994). Neurons were localized to specific thalamic subnuclei using a combination of one or more of the above criteria.
Results
Database
A total of 51 neurons were recorded from the motor thalamus in two monkeys before, during and after stimulation of the STN, 27 from VA/VLo (pallidal receiving area) and 24 from VPLo (cerebellar receiving area). In VA/VLo all 27 neurons were successfully recorded before, during, and after stimulation under at least one stimulation condition. Of these, 18 neurons were recorded during both therapeutic (effective) and subtherapeutic (ineffective) stimulation. Because some neurons were lost before both effective and ineffective stimulation could be tested, in VA/VLo data from three neurons were recorded with effective stimulation only and six neurons were recorded with ineffective stimulation only. In VPLo 18 neurons were recorded using both effective and ineffective stimulation, and six neurons were recorded with ineffective stimulation only.
Changes in thalamic neuronal activity during STN stimulation
STN DBS produced a significant change in the pattern of the population poststimulus time histograms for both pallidal and cerebellar receiving areas during effective compared with ineffective stimulation. Stereotypical changes in thalamic neuronal activity were different in the two regions and are detailed below for each region.
Pattern
Figure 1 illustrates the change in the PSTH for the population of VA/VLo (N = 18) (a) and VPLo (N = 18) (b) neurons, that were recorded during both effective and ineffective stimulation during STN stimulation at 135 Hz. The response during ineffective stimulation is noted by the dotted line and green bars, whereas that which occurred during effective stimulation is denoted by the continuous line and red bars. During ineffective stimulation there was no change in the response of VA/VLo neurons compared with that which occurred during the prestimulus control period. During effective stimulation however, the PSTH was significantly changed from baseline being characterized by an early excitation peaking between 1 and 1.5 ms after the stimulation pulse followed by a smaller but prolonged period of inhibition beginning at ∼2 ms after the stimulation pulse and lasting until the next stimulation pulse.
Figure 1.
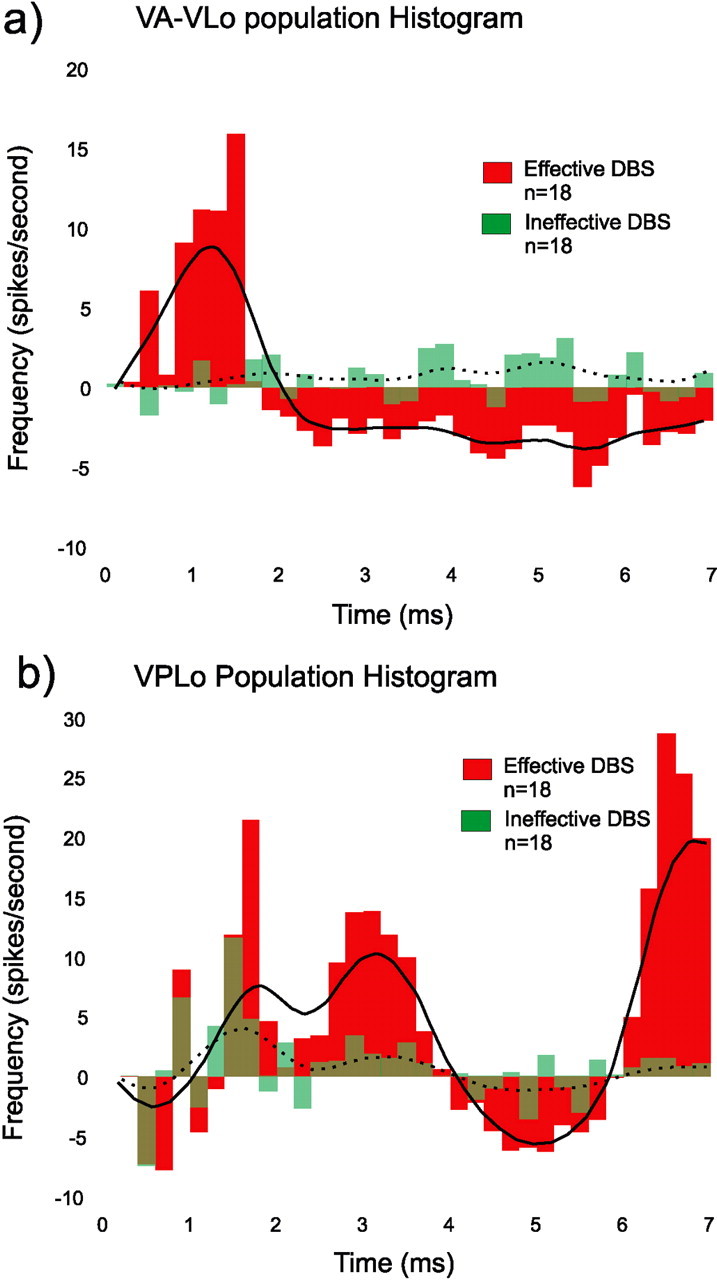
a, b, Poststimulation time histogram (PSTH) of effective (red) and ineffective (green) stimulation for VA/VLo (a) and VPLo (b) neurons. Eighteen neurons from each site were collected under both stimulation conditions. The x-axis is the time in milliseconds after the stimulation pulse. The y-axis is spikes per second; the bin width is 0.2 ms. The continuous line is a smoothed running average for effective whereas the dotted line is the smoothed running average for ineffective stimulation.
Changes in the pattern of response of neurons in the cerebellar receiving area, VPLo, were also seen during STN stimulation. The response of VPLo neurons was different from that of VA/VLo with the PSTH demonstrating a more complicated pattern of excitation and inhibition between stimulation pulses. Although the overall general pattern of change appeared the same during effective compared with ineffective stimulation, during effective stimulation the amplitude of change at each time point after the stimulation pulse was significantly larger.
The change in pattern of thalamic neuronal activity is further evident by comparing the distribution of interspike intervals at baseline to that which occurred during the prestimulus control to effective and ineffective stimulation conditions. During effective stimulation the ISI histogram changed from a continuous distribution to a multimodal distribution with peaks corresponding to multiples of the interstimulus interval (Fig. 2a). Although there were subtle changes suggesting the beginning of multimodality during ineffective stimulation, these changes were more profound during effective stimulation. When compared with prestimulation conditions the majority of neurons in VA/VLo and VPLo demonstrated a significant change in their ISI distribution during effective stimulation (Fig. 2b). Overall 52% (11/21) and 72% (13/18) of neurons in the pallidal and cerebellar receiving areas, respectively, demonstrated a significant (p < 0.05) change in the ISI histogram during effective stimulation.
Figure 2.

a, ISI distributions for all neurons during effective and ineffective DBS in VA/VLo and VPLo. The y-axis is the probability of discharge of a neuron, while the x-axis is time. In VA/VLo 21 neurons were collected during effective stimulation (a, upper left), whereas 24 neurons were collected during ineffective stimulation (a, upper right). In VPLo 18 neurons were collected during effective stimulation (a, lower left), whereas 24 neurons were collected during ineffective stimulation (a, lower right). b, Pie chart diagram of the number of neurons that significantly changed their ISI distribution during effective stimulation compared with the prestimulation control condition for neurons in VA/VLo and VPLo.
Response types
Although the PSTH reflects the summed changes of a population of neurons, during effective stimulation there were distinctly different types of responses that occurred in each subnuclei of the motor thalamus that contributed to the PSTH, these are illustrated in Figure 3a–f.
Figure 3.

a–f, Representative examples of different neuronal responses to stimulation in VA/VLo (a–c) and VPLo (d–f). Prolonged inhibition (a), transient excitation (b), excitation and inhibition (c), prolonged excitation with early transient phase (d), transient excitation (e), and inhibition and excitation (f). Rows 1–3 are the PSTH before, during, and after stimulation. Row 4 is the net change in discharge rate of the PSTH determined by subtracting “before” from “during”. The x-axis is the time in milliseconds and the y-axis is spikes per second.
In VA/VLo the predominant response to stimulation was an inhibition that began shortly after the stimulation pulse and persisted throughout the period of stimulation. This occurred in 8/18 neurons during effective stimulation (Fig. 3a, top left) and is reflected in the inhibitory period in the PSTH represented in Figure 1a. The second most common response was an excitation (4/18); this was transient in three neurons occurring immediately after the stimulation pulse (Fig. 3b, top center) and was reflected by the early excitatory period in the PSTH. Only 1/18 neurons showed a prolonged period of excitation, whereas six VA/VLo neurons showed no changed during effective compared with ineffective stimulation. Of the three neurons collected only during effective stimulation all three demonstrated a significant change in the PSTH with one showing a transient excitation, one a prolonged inhibition and the third reflecting the summed PSTH in Figure 1 with an early excitation followed by a prolonged inhibition (Fig. 3c).
The most common response pattern of VPLo neurons during effective STN stimulation was an excitation, which occurred in 10/18 neurons that were examined during both effective and ineffective stimulation. In general two patterns of excitation were observed; one was a prolonged period of excitation lasting until the next stimulation pulse that may or may not be preceded by an early excitation (Fig. 3d) and the other was an early excitation occurring within 1–2 ms after the stimulation pulse (Fig. 3e). On some occasions a more complicated pattern of response was observed with periods of excitation mixed with periods of inhibition (Fig. 3f).
Mean discharge rate
Although the overall mean discharge rate for VA/VLo neurons did not show a significant change during effective compared with ineffective stimulation (Fig. 4a), there was a significant (p < 0.05) difference in the number of neurons that were inhibited during effective (8/18) compared with ineffective (2/18) stimulation (Fig. 4b, black portion of the pie chart). Of the 6 VA/VLo cells recorded only during ineffective stimulation, none showed a significant change in mean discharge rate, whereas 2 of the 3 neurons recorded only during effective stimulation demonstrated a reduction in the mean discharge rate compared with the prestimulus control period.
Figure 4.

a, Change in mean discharge rate during STN DBS for VA/VLo and VPLo neurons during effective and ineffective stimulation. b, Pie chart showing proportion of cells with either an increase, decrease or no change in rate for effective compared with ineffective stimulation in VA/VLo and VPLo.
Similar to VA/VLo there was no significant change in the overall mean discharge rate of VPLo neurons during effective compared with ineffective stimulation (Fig. 4a). There was however, a marked shift in the population of cells that showed a significant increase in discharge rate during effective (10/18; 56%) compared with ineffective (5/18; 28%) stimulation (Fig. 4b, gray portion of the pie chart). This shift in the population response was not significant likely because of the small sample size.
Burst activity
In VA/VLo during effective stimulation there was a significant decrease in the incidence of bursting, intraburst rate and percentage spikes in a burst (p < 0.05). In VPLo there was not a significant change in the incidence or bursting characteristics of neurons during effective compared with ineffective stimulation.
Oscillatory activity
Comparing effective to ineffective stimulation, during effective stimulation there was a significant reduction in the percentage power at the oscillatory frequency of 3–8 Hz, for VA/VLo and VPLo neurons, while VA/VLo neurons also showed a reduction in the range of 8–30 Hz. There was an associated increase in the percentage power in the higher frequency range of 60–90 Hz for neurons in both VA/VLo and VPLo (Fig. 5). Thus, there was a shift in the power distribution of oscillatory activity from low frequency to higher frequencies during effective stimulation that was more predominant for cells in the pallidal compared with the cerebellar receiving area, but was present in both. An example of this change is illustrated in Figure 6 for a VPLo neuron. Interestingly during both ineffective and effective stimulation the low frequency component was reduced, whereas the increase in high frequency oscillatory activity only appeared during effective stimulation.
Figure 5.

Change in percentage power of oscillatory activity in VA/VLo and VPLo during effective compared with ineffective stimulation. The x-axis is specified frequency bands, the y-axis is the percentage of power relative to the total power in the calculated power spectrum during stimulation.
Figure 6.

Raster (top) and power spectrum (below raster) of a VPLo neuron during effective (top row of three rasters and power spectrum below each raster) compared with ineffective (bottom row of three rasters and power spectrum below each raster). The first column is spontaneous activity during the control period, the second column is during stimulation and the last is during the poststimulus control period. Note the reduction of low frequency oscillatory activity during both stimulation periods, whereas the appearance of higher frequency oscillatory activity only appeared during effective stimulation.
Discussion
During STN stimulation the vast majority of neurons in both the pallidal and cerebellar receiving areas of the motor thalamus showed a significant change in their pattern of activity and in the population of neurons that were suppressed versus activated during effective compared with ineffective stimulation. Comparisons across these two stimulation conditions provide compelling evidence that the changes in neuronal activity observed during effective stimulation underlie the beneficial effects of STN DBS on parkinsonian motor signs. Whereas similar changes in neuronal activity were often observed during ineffective stimulation, these changes were more profound and affected a greater population of neurons in each subnucleus during effective stimulation.
VA/VLo
In the pallidal receiving area the population PSTH was comprised of an early excitation followed by a prolonged period of inhibition that lasted throughout the interstimulus period. This pattern reflects the summed responses of predominately two populations of neurons. One with an early excitation and the second a prolonged inhibition that began shortly after the onset of the stimulation pulse and lasted throughout the interstimulus period. The prolonged inhibition may occur in part as a result of increased inhibitory output from the GPi that occurs during STN stimulation, i.e., activation of pallido-thalamic projections, as we previously reported (Hashimoto et al., 2003), whereas the transient excitation could reflect antidromic activation of corticosubthalamic collaterals to the thalamus (Baker et al., 2002; Li et al., 2007). Given the PSTH reflects the summed responses of a population of neurons during continuous stimulation, and incorporates the activity of a number of entrant and re-entrant pathways, a number of different circuits each with different temporal latencies are likely to contribute to the overall response observed during stimulation. This study was not directed at teasing out the anatomical-physiological components that make up the PSTH, which would require stimulation pulses to be delivered at varying intervals to allow longer latency re-entrant pathways to elicit their effect. Because low frequency stimulation has not been demonstrated to provide therapeutic benefit during STN stimulation in PD, it would appear that the therapeutic response may be more dependent on the short latency effects, i.e., those that occur within 7 ms after each stimulation pulse when stimulating at 135 Hz because the contribution of longer latency pathways would be washed out during high frequency stimulation.
The multimodal pattern of the ISI histogram reflects a more regular temporally regimented pattern of discharge in VA/VLo neurons during effective STN DBS. Taken together with the reduction in burst activity, the spike trains of thalamic neurons in the pallidal receiving area would appear to be more regular and periodic during stimulation conditions that improve motor signs.
The lack of a significant reduction in the mean rate of discharge of VA/VLo neurons is likely because of the early excitation seen in many of these neurons, which when summed in the PSTH negates the overall effect of the more prolonged but smaller degree of inhibition that occurred in the majority of VA/VLo neurons affected by stimulation. The shift in oscillatory activity from low to high frequency is consistent with previous hypotheses (Brown et al., 2001; Cassidy et al., 2002; Brown, 2003; Brown et al., 2004) regarding the relative role of low β and gamma oscillatory activity on movement in PD patients and may reflect a network that is more conducive to modulating motor commands or at least one that interferes less with signal processing in the cortex. Interestingly reductions in β range activity were present in some neurons during ineffective stimulation, whereas increases in high frequency activity seemed to occur predominately during effective stimulation. The relative importance of reductions in β range oscillatory activity to increases in gamma range activity remains to be determined with larger sample sizes under different behavioral conditions. These data are consistent with previous hypotheses that changes in pattern and the power of oscillatory activity in the basal ganglia thalamocortical circuit, not rate, are likely to play a significant role in mediating the beneficial effects of DBS in the STN.
VPLo
In VPLo the PSTH during effective simulation took on a very different pattern of change compared with VA/VLo. During stimulation the PSTH demonstrated a complex pattern of excitation and inhibition. This pattern was present during ineffective stimulation but to a smaller degree than that seen during effective stimulation consistent with more profound effects of effective stimulation in a larger number of VPLo neurons. Similar to neurons in the pallidal receiving area the majority of neurons in VPLo demonstrated a significant change in their ISI distribution during effective stimulation that appeared multimodal, suggesting that in both areas neurons demonstrated a tendency for responses to occur at particular time intervals relative to the stimulation pulse. Although there were basically two populations of neurons in VA/VLo with two different response types, i.e., excitation versus inhibition, VPLo neurons generally tended to be activated by STN stimulation, albeit in a different manner relative to one another, i.e., the majority were activated throughout the interstimulus period, whereas others demonstrated only an early and transient period of activation between stimulation pulses. Similar to VA/VLo, VPLo neurons demonstrated a shift toward higher oscillatory frequencies during effective compared with ineffective stimulation.
Given the lack of a direct projection from the STN to VPLo short latency activation of VPLo neurons during STN stimulation may reflect activation of adjacent cerebello-thalamic fibers that pass near the STN. Another potential factor contributing to the early excitation is antidromic activation of corticosubthalamic projections with collaterals to the thalamus. These data would be consistent with the hypothesis that stimulation activates white mater pathways running through or near the stimulated site and contributes to the overall pattern of response of these neurons to stimulation (Vitek, 2002a,b; Hashimoto et al., 2003; Vitek et al., 2004; Stover et al., 2005; Miocinovic et al., 2006). Another source, which could contribute to the observed responses in both sets of neurons, albeit with a longer latency, would be the potential effect of STN stimulation on the pedunculopontine nucleus, a site with broad projections across both pallidal and cerebellar receiving areas of the motor thalamus.
Mechanism of DBS: activation of adjacent fiber pathways
Data from our group and others suggest that stimulation in the dorsal portion of the STN that involves regions which lie outside of the nucleus are equally effective and may in some cases provide greater benefit than stimulation within the STN (Maks et al., 2008). Whereas there is little data at this time to support or refute this hypothesis, it is compelling to suggest that activation of adjacent fiber pathways such as the nigrostriatal, pallido-thalamic and cerebello-thalamic pathways directly contribute to the therapeutic effect seen during STN DBS. Although this study does not directly address this question, previous studies in parkinsonian monkeys and humans are consistent with activation of pallido-thalamic fibers during STN stimulation (Pralong et al., 2003; Montgomery, 2006; Miocinovic et al., 2006). Present observations of activation of VPLo neurons during STN stimulation, together with the reports of improvement in essential tremor during STN DBS (Murata et al., 2003; Stover et al., 2005), an observation consistent with activation of cerebello-thalamic pathways, also support the hypothesis that activation of adjacent fiber pathways play a role in mediating the beneficial effect of STN DBS.
Implications of present findings to the pathophysiology of PD
The present observations support the hypothesis that improvement in bradykinesia and rigidity may be due more to changes in neuronal activity patterns than to changes in rate. Improvement in bradykinesia and rigidity were associated with a significant change in the pattern of neuronal activity in the majority of thalamic neurons in VA/VLo and VPLo in the face of further inhibition in a significant population of VA/VLo neurons. We previously hypothesized that improvement in rigidity and bradykinesia during STN DBS was associated with activation of STN output and a regularization of the pattern of GPi neuronal activity (Hashimoto et al., 2003). Present data further support this hypothesis and extend these observations to additional nodal points within the network. The reduction in low and increase in high frequency oscillatory activity is also consistent with previous suggestions that lower frequency oscillatory activity may be proakinetic, whereas high frequency oscillatory activity is prokinetic (Brown et al., 2001; Cassidy et al., 2002). Understanding the specific effect of individual changes in neuronal activity produced by STN DBS in the pallido-thalamic and cerebello-thalamic circuits and their respective roles in alleviating individual parkinsonian motor signs are critical questions for which we do not as yet have answers. Answers to these questions will be critically important to improve our understanding of the pathophysiological basis underlying the development of parkinsonian motor signs and in determining how DBS works to alleviate them. This will in turn provide the framework on which to improve current and develop new DBS applications for the treatment of neurological disease.
Footnotes
This study was funded in part by National Institutes of Health Grant NS037019. We thank Dr. Alan Dorval of Duke University, Department of Biomedical Engineering, for his help with programming data analysis software, and Dr. Yunguo Yu, Department of Neuroscience, Mt. Sinai Medical School, and Jian Lin of the Department of Radiology of Cleveland Clinic for their help with additional programming and data analysis. We also thank Jane Rein for her expert assistance in the preparation of this manuscript.
References
- Anderson ME, Postupna N, Ruffo M. Effects of high-frequency stimulation in the internal globus pallidus on the activity of thalamic neurons in the awake monkey. J Neurophysiol. 2003;89:1150–1160. doi: 10.1152/jn.00475.2002. [DOI] [PubMed] [Google Scholar]
- Baker KB, Montgomery EB, Jr, Rezai AR, Burgess R, Lüders HO. Subthalamic nucleus deep brain stimulus evoked potentials: physiological and therapeutic implications. Mov Disord. 2002;17:969–983. doi: 10.1002/mds.10206. [DOI] [PubMed] [Google Scholar]
- Benazzouz A, Hallett M. Mechanism of action of deep brain stimulation. Neurology. 2000;55:S13–S16. [PubMed] [Google Scholar]
- Benazzouz A, Piallat B, Pollak P, Benabid AL. Responses of substantia nigra parts reticulata and globus pallidus complex to high frequency stimulation of the subthalamic nucleus in rats: electrophysiological data. Neurosci Lett. 1995;189:77–80. doi: 10.1016/0304-3940(95)11455-6. [DOI] [PubMed] [Google Scholar]
- Benazzouz A, Gao D, Piallat B, Bressand K, Benabid A. Inhibitory response of substantia nigra reticulata neurons to high frequency stimulation of the subthalamic nucleus is independent of globus pallidus activation. Soc Neurosci Abstr. 1997;23 183.193. [Google Scholar]
- Bergman H, Wichmann T, DeLong MR. Reversal of experimental parkinsonism by lesions of the subthalamic nucleus. Science. 1990;249:1436–1438. doi: 10.1126/science.2402638. [DOI] [PubMed] [Google Scholar]
- Brown P. Oscillatory nature of human basal ganglia activity: relationship to the pathophysiology of Parkinson's disease. Mov Disord. 2003;18:357–363. doi: 10.1002/mds.10358. [DOI] [PubMed] [Google Scholar]
- Brown P, Oliviero A, Mazzone P, Insola A, Tonali P, Di Lazzaro V. Dopamine dependency of oscillations between subthalamic nucleus and pallidum in Parkinson's disease. J Neurosci. 2001;21:1033–1038. doi: 10.1523/JNEUROSCI.21-03-01033.2001. [DOI] [PMC free article] [PubMed] [Google Scholar]
- Brown P, Mazzone P, Oliviero A, Altibrandi MG, Pilato F, Tonali PA, Di Lazzaro V. Effects of stimulation of the subthalamic area on oscillatory pallidal activity in Parkinson's disease. Exp Neurol. 2004;188:480–490. doi: 10.1016/j.expneurol.2004.05.009. [DOI] [PubMed] [Google Scholar]
- Cassidy M, Mazzone P, Oliviero A, Insola A, Tonali P, Di Lazzaro V, Brown P. Movement-related changes in synchronization in the human basal ganglia. Brain. 2002;125:1235–1246. doi: 10.1093/brain/awf135. [DOI] [PubMed] [Google Scholar]
- Dostrovsky JO, Levy R, Wu JP, Hutchison WD, Tasker RR, Lozano AM. Microstimulation-induced inhibition of neuronal firing in human globus pallidus. J Neurophysiol. 2000;84:570–574. doi: 10.1152/jn.2000.84.1.570. [DOI] [PubMed] [Google Scholar]
- Elder CM, Hashimoto T, Zhang J, Vitek JL. Chronic implantation of deep brain stimulation leads in animal models of neurological disorders. J Neurosci Methods. 2005;142:11–16. doi: 10.1016/j.jneumeth.2004.07.007. [DOI] [PubMed] [Google Scholar]
- Hashimoto T, Elder CM, Vitek JL. A template subtraction method for stimulus artifact removal in high-frequency deep brain stimulation. J Neurosci Methods. 2002;113:181–186. doi: 10.1016/s0165-0270(01)00491-5. [DOI] [PubMed] [Google Scholar]
- Hashimoto T, Elder CM, Okun MS, Patrick SK, Vitek JL. Stimulation of the subthalamic nucleus changes the firing pattern of pallidal neurons. J Neurosci. 2003;23:1916–1923. doi: 10.1523/JNEUROSCI.23-05-01916.2003. [DOI] [PMC free article] [PubMed] [Google Scholar]
- Hershey T, Revilla FJ, Wernle AR, McGee-Minnich L, Antenor JV, Videen TO, Dowling JL, Mink JW, Perlmutter JS. Cortical and subcortical blood flow effects of subthalamic nucleus stimulation in PD. Neurology. 2003;61:816–821. doi: 10.1212/01.wnl.0000083991.81859.73. [DOI] [PubMed] [Google Scholar]
- Jech R. Effects of deep brain stimulation of the STN and Vim nuclei in the resting state and during simple movement task. A functional MRI study at 1.5 Tesla. Mov Disord. 2002;17:S173. [Google Scholar]
- Jech R, Urgosik D, Tintera J, Nebuzelský A, Krásenský J, Liscák R, Roth J, Rùzicka E. Functional magnetic resonance imaging during deep brain stimulation: a pilot study in four patients with Parkinson's disease. Mov Disord. 2001;16:1126–1132. doi: 10.1002/mds.1217. [DOI] [PubMed] [Google Scholar]
- Legendy CR, Salcman M. Bursts and recurrences of bursts in the spike trains of spontaneously active striate cortex neurons. J Neurophysiol. 1985;53:926–939. doi: 10.1152/jn.1985.53.4.926. [DOI] [PubMed] [Google Scholar]
- Li S, Arbuthnott GW, Jutras MJ, Goldberg JA, Jaeger D. Resonant antidromic cortical circuit activation as a consequence of high-frequency subthalamic deep-brain stimulation. J Neurophysiol. 2007;98:3525–3537. doi: 10.1152/jn.00808.2007. [DOI] [PubMed] [Google Scholar]
- Maks CB, Butson CR, Walter BL, Vitek JL, McIntyre CC. Deep brain stimulation activation volumes and their association with neurophysiological mapping and therapeutic outcomes. J Neurol Neurosurg Psychiatry. 2008 doi: 10.1136/jnnp.2007.126219. [DOI] [PMC free article] [PubMed] [Google Scholar]
- McIntyre CC, Grill WM. Selective microstimulation of central nervous system neurons. Ann Biomed Eng. 2000;28:219–233. doi: 10.1114/1.262. [DOI] [PubMed] [Google Scholar]
- McIntyre CC, Grill WM. Extracellular stimulation of central neurons: influence of stimulus waveform and frequency on neuronal output. J Neurophysiol. 2002;88:1592–1604. doi: 10.1152/jn.2002.88.4.1592. [DOI] [PubMed] [Google Scholar]
- Miocinovic S, Parent M, Butson CR, Hahn PJ, Russo GS, Vitek JL, McIntyre CC. Computational analysis of subthalamic nucleus and lenticular fasciculus activation during therapeutic deep brain stimulation. J Neurophysiol. 2006;96:1569–1580. doi: 10.1152/jn.00305.2006. [DOI] [PubMed] [Google Scholar]
- Montgomery EB., Jr Effects of GPi stimulation on human thalamic neuronal activity. Clin Neurophysiol. 2006;117:2691–2702. doi: 10.1016/j.clinph.2006.08.011. [DOI] [PubMed] [Google Scholar]
- Murata J, Kitagawa M, Uesugi H, Saito H, Iwasaki Y, Kikuchi S, Tashiro K, Sawamura Y. Electrical stimulation of the posterior subthalamic area for the treatment of intractable proximal tremor. J Neurosurg. 2003;99:708–715. doi: 10.3171/jns.2003.99.4.0708. [DOI] [PubMed] [Google Scholar]
- Perlmutter JS, Mink JW, Bastian AJ, Zackowski K, Hershey T, Miyawaki E, Koller W, Videen TO. Blood flow responses to deep brain stimulation of thalamus. Neurology. 2002;58:1388–1394. doi: 10.1212/wnl.58.9.1388. [DOI] [PubMed] [Google Scholar]
- Pralong E, Debatisse D, Maeder M, Vingerhoets F, Ghika J, Villemure JG. Effect of deep brain stimulation of GPI on neuronal activity of the thalamic nucleus ventralis oralis in a dystonic patient. Neurophysiol Clin. 2003;33:169–173. doi: 10.1016/j.neucli.2003.07.001. [DOI] [PubMed] [Google Scholar]
- Stover NP, Okun MS, Evatt ML, Raju DV, Bakay RA, Vitek JL. Stimulation of the subthalamic nucleus in a patient with Parkinson disease and essential tremor. Arch Neurol. 2005;62:141–143. doi: 10.1001/archneur.62.1.141. [DOI] [PubMed] [Google Scholar]
- Vitek JL. Deep brain stimulation for Parkinson's disease: a critical re-evaluation of STN versus GPi DBS. Stereotact Funct Neurosurg. 2002a;78:119–131. doi: 10.1159/000068959. [DOI] [PubMed] [Google Scholar]
- Vitek JL. Mechanisms of deep brain stimulation: excitation or inhibition. Mov Disord. 2002b;3(17) Suppl:S69–S72. doi: 10.1002/mds.10144. [DOI] [PubMed] [Google Scholar]
- Vitek JL, Ashe J, DeLong MR, Alexander GE. Physiologic properties and somatotopic organization of the primate motor thalamus. J Neurophysiol. 1994;71:1498–1513. doi: 10.1152/jn.1994.71.4.1498. [DOI] [PubMed] [Google Scholar]
- Vitek JL, Ashe J, DeLong MR, Kaneoke Y. Microstimulation of primate motor thalamus: somatotopic organization and differential distribution of evoked motor responses among subnuclei. J Neurophysiol. 1996;75:2486–2495. doi: 10.1152/jn.1996.75.6.2486. [DOI] [PubMed] [Google Scholar]
- Vitek JL, Bakay RA, Hashimoto T, Kaneoke Y, Mewes K, Zhang JY, Rye D, Starr P, Baron M, Turner R, DeLong MR. Microelectrode-guided pallidotomy: technical approach and its application in medically intractable Parkinson's disease. J Neurosurg. 1998;88:1027–1043. doi: 10.3171/jns.1998.88.6.1027. [DOI] [PubMed] [Google Scholar]
- Vitek JL, Hashimoto T, Peoples J, DeLong MR, Bakay RA. Acute stimulation in the external segment of the globus pallidus improves parkinsonian motor signs. Mov Disord. 2004;19:907–915. doi: 10.1002/mds.20137. [DOI] [PubMed] [Google Scholar]
- Wichmann T, Soares J. Neuronal firing before and after burst discharges in the monkey basal ganglia is predictably patterned in the normal state and altered in parkinsonism. J Neurophysiol. 2006;95:2120–2133. doi: 10.1152/jn.01013.2005. [DOI] [PubMed] [Google Scholar]
- Windels F, Bruet N, Poupard A, Urbain N, Chouvet G, Feuerstein C, Savasta M. Effects of high frequency stimulation of subthalamic nucleus on extracellular glutamate and GABA in substantia nigra and globus pallidus in the normal rat. Eur J Neurosci. 2000;12:4141–4146. doi: 10.1046/j.1460-9568.2000.00296.x. [DOI] [PubMed] [Google Scholar]
- Windels F, Bruet N, Poupard A, Feuerstein C, Bertrand A, Savasta M. Influence of the frequency parameter on extracellular glutamate and gamma-aminobutyric acid in substantia nigra and globus pallidus during electrical stimulation of subthalamic nucleus in rats. J Neurosci Res. 2003;72:259–267. doi: 10.1002/jnr.10577. [DOI] [PubMed] [Google Scholar]
- Wu YR, Levy R, Ashby P, Tasker RR, Dostrovsky JO. Does stimulation of the GPi control dyskinesia by activating inhibitory axons? Mov Disord. 2001;16:208–216. doi: 10.1002/mds.1046. [DOI] [PubMed] [Google Scholar]