

Abstract
The amount of neurotransmitter released after the arrival of an action potential affects the strength and the trial-to-trial variability of postsynaptic responses. Most studies examining the dependence of synaptic neurotransmitter concentration on the release probability (P r) have focused on glutamatergic synapses. Here we asked whether univesicular or multivesicular release characterizes transmission at hippocampal GABAergic synapses. We used multiple probability functional analysis to derive quantal parameters at inhibitory connections between cannabinoid receptor- and cholecystokinin (CCK)-expressing interneurons and CA3 pyramidal cells. After the recordings, the cells were visualized and reconstructed at the light-microscopic level, and the number of boutons mediating the IPSCs was determined using electron microscopy (EM). The number of active zones (AZs) per CCK-immunopositive bouton was determined from three-dimensional EM reconstructions, thus allowing the calculation of the total number of AZs for each pair. Our results reveal an approximate fivefold discrepancy between the numbers of functionally determined release sites (17.4 ± 3.2) and structurally identified AZs (3.7 ± 0.9). Channel modeling predicts that a fivefold to sevenfold increase in the peak synaptic GABA concentration is required for the fivefold enhancement of the postsynaptic responses. Kinetic analysis of the unitary IPSCs indicates that the increase in synaptic GABA concentration is most likely attributable to multivesicular release. This change in the synaptic GABA concentration transient together with extremely low postsynaptic receptor occupancy permits a P r-dependent scaling of the postsynaptic response generated at a single hippocampal GABAergic synaptic contact.
Keywords: patch clamp, paired recordings, electron microscopy, quantal analysis, hippocampus, interneurons
Introduction
The amount of neurotransmitter released after the arrival of a presynaptic action potential (AP) determines the strength and variability of postsynaptic responses and critically affects information processing in neuronal networks (for review, see Zador and Dobrunz, 1997; Liu, 2003; Abbott and Regehr, 2004). If postsynaptic receptors are not fully occupied by the released transmitter (for review, see Frerking and Wilson, 1996; Bergles et al., 1999; Liu, 2003), trial-to-trial variations in the synaptic transmitter concentration transient will be translated into fluctuations of the postsynaptic response. Several studies demonstrated that only a single vesicle is released at each active zone (AZ) [i.e., univesicular release (UVR)] within a short period of time (<0.5 ms) after the arrival of an AP (Korn et al., 1982; Gulyas et al., 1993; Silver et al., 1996, 2003; Hanse and Gustafsson, 2001; Lawrence et al., 2004; Murphy et al., 2004; Biró et al., 2005). In such a case, variations in the synaptic neurotransmitter concentration can only be a result of differences in the content of vesicles or the extent of their emptying. If, however, the content of several vesicles is released simultaneously at a presynaptic AZ [multivesicular release (MVR)], the synaptic neurotransmitter concentration could vary to a much greater extent. Consistent with this, some studies have reported large fluctuations in the postsynaptic responses at single release sites (Conti and Lisman, 2003), a release probability (Pr)-dependent block of postsynaptic responses by low-affinity competitive antagonists (Tong and Jahr, 1994; Scanziani et al., 1997; Wadiche and Jahr, 2001; Foster et al., 2002; Watanabe et al., 2005; Christie and Jahr, 2006), and a Pr-dependent change in the [Ca2+] in single postsynaptic spines (Oertner et al., 2002). As apparent from these papers, most studies examining MVR concentrated on glutamatergic synapses. Much less is known about the release process at central inhibitory synapses. Auger et al. (1998) have reported that more than one GABA-containing vesicle can be released slightly asynchronously at cerebellar interneuron synapses. MVR caused only a small increase in the mean of IPSC amplitudes, predicting a high receptor occupancy in agreement with two other publications demonstrating postsynaptic receptor saturation at these cerebellar synapses (Auger and Marty, 1997; Nusser et al., 1997). However, this is clearly not a general feature of all GABAergic synapses, because several studies concluded that GABAA receptors at most cortical and hippocampal synapses are not fully occupied by GABA released from a single vesicle (Frerking et al., 1995; Perrais and Ropert, 1999, 2000; Hajos et al., 2000). In the present study, we asked how changes in synaptic GABA concentration affect postsynaptic responses at hippocampal GABAergic synapses. Quantal parameters (quantal size, q; number of functional release site, NF; release probability, Pr) were derived from multiple probability fluctuation analysis (MPFA) (Silver et al., 1998) of unitary IPSCs (uIPSCs) recorded from CA3 pyramidal cells under different Pr conditions. Subsequent light microscopy (LM) and electron microscopy (EM) were used to determine the structural basis of the recorded connections. Our results revealed a large discrepancy in the functionally (NF = 17.4 ± 3.2; n = 4) and structurally (NEM = 3.7 ± 0.9; n = 4) determined numbers of release sites, indicating that a single EM-defined AZ contains several functional release sites.
Materials and Methods
Slice preparation and electrophysiological recordings.
Acute hippocampal slices were prepared from 15- to 17-d-old male Wistar rats as described previously (Biró et al., 2005). Briefly, horizontal slices were cut with a vibratome and stored in a continuously oxygenated artificial CSF (ACSF) at 30°C. Slices in the recording chamber were perfused with ACSF containing the following (in mm): 126 NaCl, 2.5 KCl, 25 glucose, 1.25 NaH2PO4, 24 NaHCO3, 2 MgCl2, 2 CaCl2, and 3 kynurenic acid (an excitatory amino acid receptor antagonist). Recordings were performed at 31–35°C.
Cholecystokinin (CCK)-immunopositive interneurons were selected according to the location and shape of their somata and their firing patterns (Losonczy et al., 2004) (see Figs. 1 A, 2 B). Their cannabinoid sensitivity was tested by applying a CB1 receptor antagonist/inverse agonist [10 μm AM251 (N-(piperidin-1-yl)-5-(4-iodophenyl)-1-(2,4-dichlorophenyl)-4-methyl-1H-pyrazole-3-carboxamide)] or agonist (100 μl of 10 mm WIN55,212-2 applied directly to the chamber). The presynaptic interneurons were recorded in the whole-cell current-clamp configuration using a K-gluconate-based intracellular solution containing the following (in mm): 130 K-gluconate, 5 KCl, 2 MgCl2, 0.05 EGTA, 10 HEPES, 2 Na-ATP, 0.4 Na-GTP, 10 creatinine-phosphate, and 5.3 biocytin, pH 7.25, osmolarity 270–290 mOsm. Single APs were evoked at 0.33 Hz by injecting 2- to 3-ms-long depolarizing current pulses (1.2–1.5 nA), or trains of APs were evoked at 0.03–0.06 Hz by injecting 40–50 short (3 ms) depolarizing currents at 100 Hz. uIPSCs were recorded in the whole-cell voltage-clamp configuration from postsynaptic pyramidal cells at a holding potential of −80 mV [pipette solution (in mm): 90 K-gluconate, 40 CsCl, 1.2 NaCl, 3.5 KCl, 1.7 MgCl2, 0.05 EGTA, 10 HEPES, 2 Na-ATP, 0.4 Na-GTP, 10 creatinine-phosphate, 1.5 QX-314 [N-(2,6-dimethylphenylcarbamoylmethyl)-triethylammonium bromide], and 5.3 biocytin, pH 7.25, osmolarity 260–290 mOsm]. Recordings were performed with a dual-channel amplifier (Multiclamp 700A; Molecular Devices, Union City, CA) filtered at 3 or 4 kHz (Bessel filter), digitized at 20 kHz, and analyzed with an in-house written software (Evan). All chemicals and drugs were purchased from Sigma (St. Louis, MO), with the exception of AM251 (Tocris Cookson, Bristol, UK).
Figure 1.

Determination of the number of functional release sites and EM identification of the number of boutons for a basket cell– pyramidal cell pair (AB624). A, Membrane potential responses of the interneuron to ±400 pA current injections. B, Trains of presynaptic APs (red) evoke uIPSCs (light blue, individual traces; dark blue, averaged trace) in the postsynaptic pyramidal cell. Main panel, LM reconstruction of the biocytin-labeled presynaptic basket (soma and dendrites are black, axon is red) and postsynaptic pyramidal cell (soma and dendrites are blue, axon is gray). Inset, The location of EM-identified boutons is shown at a higher magnification. EM images illustrate two synaptic contacts between the filled presynaptic axon terminals and the soma of the pyramidal cell. The arrowheads point to synaptic junctions. Scale bar, 0.2 μm. C, Plot of peak amplitude of uIPSCs versus time. The horizontal bars indicate the epochs used for MPFA in E. Arrows indicate the start of washin of different extracellular solutions ([Ca2+] and [Mg2+] are in millimolars). D, Representative traces are shown from epochs indicated by the gray bars in panel C. Individual uIPSCs are light blue; the averaged current traces are dark blue. E, Quantal parameters were derived from the parabola fitted to the variance versus mean current plot. Error bars indicate the theoretical error (σvar) in the variance. The fit was weighted by 1/σvar 2.
Figure 2.
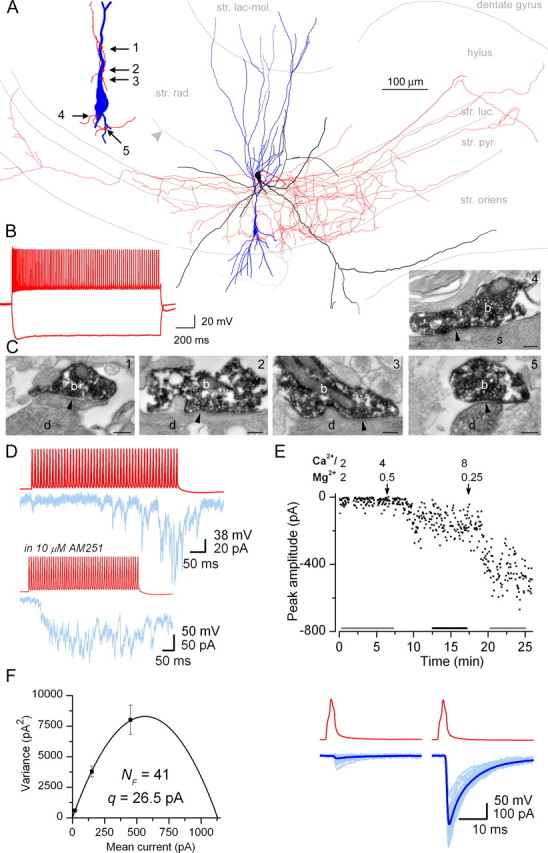
Functional and structural determination of the number of release sites (AB651). A, LM reconstruction of the presynaptic MFA IN (soma and dendrites are black, axonal arbor is red) and the postsynaptic pyramidal cell (soma and dendrites are blue, partial axonal arbor is light gray, arrowhead indicates the Schaffer collateral heading toward the CA1). Inset, The location of the five contact sites at a higher magnification. str. lac. mol., Stratum lacunosum moleculare; str. rad., stratum radiatum; str. luc., stratum lucidum; str. pyr., stratum pyramidale; str. oriens, stratum oriens. B, Responses of the presynaptic interneuron to depolarizing and hyperpolarizing current injections (±400 pA). C1–C5, Electron micrographs illustrate the synaptic junctions (arrowheads) between presynaptic boutons (b) and postsynaptic dendrites (d; numbers 1–3, 5) or soma (s; number 4). Scale bars, 0.2 μm D, Trains of presynaptic APs (red) in the GABAergic interneuron evoked uIPSCs (blue) in a pyramidal cell. In this pair, release only occurred after ∼20 APs. The CB1 receptor antagonist/inverse agonist AM251 (10 μm; shown in inset) effectively increased the initial Pr such that small-amplitude IPSCs are already evoked by the first APs. E, The peak amplitude of single AP-evoked uIPSCs (0.33 Hz in 10 μm AM251) is plotted as a function of time. Horizontal black and gray bars indicate epochs of postsynaptic responses at different Pr conditions used for determination of quantal parameters. Arrows indicate the start of washin of different extracellular solutions; [Ca2+] and [Mg2+] are in millimolars. Bottom, Representative uIPSCs under low- and high-Pr conditions. The gray bars in the top panel indicate the epochs from where 25 individual traces (light blue) and the averaged current traces (dark blue) are shown. F, Parabola fitted to the variance versus mean current plot yielded an NF of 41 and a q of 26.5 pA. Error bars indicate the theoretical error (σvar) in the variance. The fit was weighted by 1/σvar 2. Because of the large discrepancy between NF(mean) (41) and NF(0.025) (6), this cell was not included in our final analysis.
Data analysis.
The following criteria were used to ensure the time independence of our data during the recordings. Series resistance (Rs) and whole-cell capacitance was checked every 2 min in the postsynaptic pyramidal cells. The mean Rs for the first analyzed epochs during the recordings was 15.1 ± 1.5 MΩ, and after 66–85% compensation, it was 3.6 ± 0.2 MΩ (n = 13). If the compensated Rs changed >40% during the recording, the recording was discarded. All recordings were rejected when the Rs became >25 MΩ. Only IPSCs that had their onset within a 2 ms time window starting 3 ms after the onset of the depolarizing current injections in the presynaptic cells (mean uIPSC latency of ∼0.8 ms) were considered unitary postsynaptic events. A minimum of 30 traces was required in each epoch of different Pr conditions to include a cell into the analysis. The stability of peak amplitudes in time throughout an epoch was determined by fitting a regression line to the scatter plot of IPSC amplitudes versus time. The epochs were considered steady state if the slope of the regression line did not differ significantly from zero (p > 0.01, t test). The initial failure rate was determined from responses to the first 10 APs of a 100 Hz train. At least four trains of stimulation were required.
MPFA was performed using a multinomial quantal model (Silver et al., 1998; Silver, 2003; Biró et al., 2005). The peak amplitudes of the IPSCs and the failures were measured at different Pr conditions, and their means and variances were calculated with two different methods. The first method was to calculate an ensemble mean and variance during each epoch (“ensemble mean” method) (Silver et al., 1998; Biró et al., 2005). However, using such a method, the variance may be overestimated because of slight nonstationarities within the epoch. To minimize contamination of the variance from possible nonstationarities or drifts, means and variances can be calculated within small sets of sequential records and averaged subsequently for the whole epoch. The shortest possible set is two consecutive events; therefore, we calculated the mean and variance for each subsequent two responses (“pairwise method,” similar to how running average is calculated) [Scheuss et al. (2002), their Eq. 2]. Then we plotted the variance versus mean obtained with the two different methods (pairwise and ensemble mean) and estimated q and NF with a nonweighted parabolic fit (see below). Because neither q (40.5 ± 7.0 vs 43.8 ± 7.6 pA; n = 8; p = 0.12, paired t test) nor NF (25.0 ± 5.9 vs 20.9 ± 4.8; n = 8 pairs; p = 0.13, paired t test) differed significantly as determined by the two methods, we decided to present our data as calculated by the ensemble mean method. The baseline variance (σ(b) 2) was measured 1–2 ms before the onset of the averaged postsynaptic response and was subtracted. The variance (σ2) can be expressed as a function of mean current (I) using the following relationship: σ2 = σ(b) 2 + (qI − I 2/NF) (1 + CVII 2) + qICVI 2, where CVII and CVI are type II and type I quantal coefficients of variation (CVs), respectively. The variance versus mean plots were fitted with a parabola using Origin 7.0 (OriginLab, Northampton, MA). The contribution of each data point was weighted by 1/σvar 2. The theoretical variance of the variance (σvar 2) was calculated according to Silver (2003; his Eqs. 22–25) and Saviane and Silver (2006; their Eqs. 41–50). Type I or intrasite quantal CV (CVI) was determined in two ways. MPFA predicted only a single release site for cell pair AB643. Thus, in this cell, the SD (5.0 pA) and the mean (28.0 pA) of the successes were measured, and a CV of 0.18 was calculated. In pairs where the Pr is close to 1, an upper limit of CVI can be calculated (Silver, 2003). In three cell pairs with Pr > 0.9 under the highest Pr condition, we measured the variance and divided it by the NF (for the three pairs, NF was 5, 6, and 7). The square root of this value was divided by q (obtained from the parabolic fit using a simple binomial model), resulting in an upper limit of CVI (0.21 ± 0.05). The total quantal variance was calculated from multisite pairs under low-Pr conditions in which the occurrence of simultaneous release from more than one release site was sufficiently low (Silver, 2003). From the failure rate and the NF, the probability of multiple simultaneous release was calculated under the lowest Pr condition (Pf, 0.74 ± 0.02). From this probability and from the number of total successes under this Pr condition, the number of multiquantal events (m) was calculated. Cells were included into the analysis when m was ≤3. In such cells (n = 7), the m largest uIPSCs (assuming that the m largest IPSCs are the multiquantal events) were discarded, and the CV of the remaining events was calculated, providing an estimate of the total quantal CV (CVT, 0.33 ± 0.06). Type II or intersite quantal CV (CVII) was calculated as CVII 2 = CVT 2 − CVI 2. For the single site connection (AB643), CVII was not included into the model.
We also determined the quantal content (NF(phys)) at 2 mm [Ca2+]e and 2 mm [Mg2+]e by dividing the mean IPSC at this Pr condition by q. Because of the limited number of evoked responses (on average 73 uIPSCs) under each Pr condition and as a result of the limited range of the change in Pr (on average from 0.01 to 0.49 for the five pairs with anatomy), the estimated quantal parameters are subject to errors. To approximate the potential error (i.e., to estimate the chance of getting an NF of 22 when the actual NF is only 5), we performed the following simulations. Five different Pr conditions (Pr: 0.01, 0.1, 0.2, 0.35, 0.49) were modeled with a simple binomial model with a binomial N of 5 (our experimentally determined NEM(mean)). Under each Pr condition, 73 postsynaptic responses were generated by selecting quantal sizes from a normal distribution with a mean of 45 pA (mean q) and an SD of 15 pA (corresponds to a CVT of 0.33). The mean and the variance of these 73 responses were calculated and plotted under each Pr condition. Parabolic fit was performed to derive N and q. Such simulations were repeated 49 times, and the deviations from the original N and q values were calculated. The mean of the calculated Ns (6.9) and qs (50.9 pA) were 38% and 13% larger, respectively, than the original values. In 22% of the cases, the model fitting resulted in a correct N value; in 49% of the cases, the error was only ±2; and in the remaining simulations, the error ranged from 3 to 20 (mean error = 9; three largest errors; 15, 20, and 20). Our simulations demonstrated that the error exceeded the difference between NEM(mean) and NF only twice out of the 49 repetitions.
To further test the confidence in the determination of quantal parameters, we have estimated the 95% confidence intervals for NF and q from the error of the weighted parabolic fit. The NF(0.025), NF(0.975), q(0.025) and q(0.975) were calculated as NF ± t(0.025) * SD(NF) and q ± t(0.025) * SD(q), where t(0.025) is the t score at appropriate degrees of freedom for each variance-mean relationship (numbers of different Pr conditions minus two) at 95% confidence level; and SD(NF) and SD(q) are the SDs (square root of the diagonal elements of the var-covar matrix) calculated from the error of the weighted parabolic fit for NF and q, respectively. In some places, we refer to the mean NF values as NF(mean).
Kinetic parameters (10–90% rise time and τw) of uIPSCs were analyzed at low- and high-Pr conditions. The weighted decay time (τw) was calculated from exponential fits as τw = τ1 × A1 + τ2 × (1 − A1), where τ1 and τ2 are the fast and slow decay time constants, respectively, and A 1 is the contribution of the first exponential to the amplitude.
To exclude the possibility that elevating the [Ca2+]e to 8 mm affects the affinity or the conductance of GABAA receptors or the driving force for Cl−, we pressure-applied 0.5 mm GABA to the perisomatic region of whole-cell voltage-clamped CA3 pyramidal cells through a patch pipette. GABA was applied every 20 s for 4 min (10 ± 1 puffs), then the application was ceased for 6 ± 0.5 min, during which time the [Ca2+]e was either left unchanged or was elevated to 8 mm. Pressure application of GABA was then resumed for another 11.5 ± 1 puffs. The charge transfer of the GABA-evoked currents was measured for the control period and for the test period. All data are expressed as mean ± SEM.
Kinetic modeling.
Multicompartmental GABAA receptor kinetic models were implemented in Berkeley Madonna 8.0.1 (written by R. I. Macey and G. F. Oster, University of California Berkeley, Berkeley, CA) to simulate the dependence of GABAA receptor Po on peak [GABA]. Synaptic GABA concentration transients were modeled with an instantaneous rise and monoexponential decay time of either 0.1 ms or 0.3 ms. Kinetic parameters of the GABAA receptor models were adopted from Jones and Westbrook (1995) (J & W model), Mozrzymas et al. (1999) (M & C model), and Haas and Macdonald (1999) (H & M model).
EM identification of the synaptic connections.
After paired recordings, the slices were fixed in a fixative containing 4% paraformaldehyde (PFA), 1.25% glutaraldehyde (GA), and ∼0.2% picric acid in 0.1 m phosphate buffer (PB), pH 7.4, at 4°C. Before processing, the fixative was thoroughly washed out with 0.1 m PB. Slices were then cryoprotected, frozen in liquid N2 and thawed in PB, embedded in gelatin, and resectioned at 60 μm thickness as described previously (Biró et al., 2005). Biocytin was visualized using the avidin–biotin–HRP complex (Vector Laboratories, Burlingame, CA) and 3–3-diaminobenzidine tetrahydrochloride (0.05% solution in Tris buffer, pH 7.4) as a chromogen. Sections were then postfixed in 1% OsO4, stained in 1% uranyl acetate, dehydrated in a graded series of ethanol, and embedded in epoxy resin (Durcupan; Sigma). The axonal and dendritic arbors of each neuron were analyzed at high magnification (100× objective, numerical aperture 1.35) and reconstructed using the Neurolucida system (MicroBrightField Europe, Magdeburg, Germany). All sites where the presynaptic axon made close appositions to the postsynaptic cell were photographed and analyzed after serial EM sectioning. Criteria used to classify the contact as a synaptic junction were described in detail previously (Biró et al., 2005).
Determination of the number of AZs per bouton.
Three postnatal day 16 Wistar rats were perfused with fixatives containing 2% PFA and 1% GA in 0.1 m sodium acetate buffer, pH 6, for 2 min, followed by a 1 h perfusion with 2% PFA and 1% GA in 0.1 m borate buffer, pH 9 (Sloviter et al., 2001). The brains were left in the skull for 24 h at 4°C before removal. Coronal sections (60 μm thick) were cut from the dorsal hippocampus with a vibratome, followed by several washes in PB before treatment with 1% sodium borohydrate in PB for 30 min. Sections were then thoroughly washed in PB and TBS, followed by blocking in TBS containing 10% normal goat serum (NGS) and incubation in mouse anti-CCK antibody (#9303 NIH, CURE/Digestive Disease Research Center, University of California Los Angeles, Los Angeles, CA; diluted 1:1000 in TBS containing 2% NGS and 0.05% Triton X-100) at room temperature overnight. After several washes in TBS, sections were blocked for 30 min with 0.8% bovine serum albumin and 0.1% cold water fish skin gelatin in TBS and incubated in 0.8 nm of gold-coupled goat anti-mouse IgG (1:50; Aurion Immunoresearch, Wageningen, The Netherlands) diluted in blocking solution overnight at 4°C. Gold particles were visualized with the Aurion Immunoresearch EM silver kit as described by the manufacturer. Sections were then postfixed in 0.5% OsO4 for 20 min, stained in 1% uranyl acetate, dehydrated in graded series of ethanol, and embedded into Durcupan.
Blocks containing the strata pyramidale and lucidum of the CA3 area were re-embedded, and long series of ultrathin sections were cut for EM. Digital images of randomly chosen immunopositive boutons contacting either somata or proximal dendrites of CA3 pyramidal cells were taken (MegaviewIII camera; Soft Imaging System, Munster, Germany). Boutons were reconstructed in three dimensions using the Reconstruct software (J. C. Fiala, Boston University, Boston, MA; http://synapses.bu.edu/) from images of serial ultrathin sections, and the volume of the boutons, the number of AZs, and the area of each AZ were measured.
Results
A previous study from our laboratory (Losonczy et al., 2004) has demonstrated that persistently active presynaptic CB1 cannabinoid receptors mute the output of a subpopulation of GABAergic interneurons, the CCK+ mossy fiber-associated interneurons (MFA INs). However, after the application of a CB1 receptor antagonist, large-amplitude, highly variable IPSCs appeared, similar to the postsynaptic responses of CCK+ basket cells (Losonczy et al., 2004). Because of the very high dynamic range of these synapses, in the present study we concentrated on synaptic connections established by cannabinoid-sensitive, CCK+ GABAergic interneurons (both MFA INs and basket cells) on CA3 pyramidal cells.
The functional connectivity of the pairs was first tested by inducing long trains of APs at 100 Hz in the presynaptic interneuron (Losonczy et al., 2004). For the synaptically connected pairs, postsynaptic responses displayed very diverse patterns during the trains, ranging from strong depression (Fig. 1 B) to marked facilitation (Fig. 2 D). Among the connections tested, the initial failure rate ranged from 0.05 to 0.98, predicting a large heterogeneity in Pr or in NF. To directly reveal the mechanism underlying this large heterogeneity, quantal parameters of these synapses were determined by evoking uIPSCs with single APs at 0.33 Hz under different Pr conditions.
Our initial experiments (e.g., pair AB616) revealed that the Pr at these synapses cannot be sufficiently increased by elevating only the [Ca2+]e. Thus, to maximize the Pr and to eliminate the different degrees of presynaptic CB1 receptor activity on different cells (basket cells vs MFA INs), we performed the remaining experiments in the continuous presence of the CB1 receptor antagonist/inverse agonist AM251 (10 μm). The application of AM251 not only turned the “mute” MFA INs to pyramidal cell connections into functional ones but also increased the amplitude of uIPSCs evoked by basket cells. To impose distinct Pr conditions to the synapses, the extracellular concentrations of Ca2+ and Mg2+ were systematically changed during the course of the experiments (Figs. 1 C, 2 E). Changing the [Ca2+]e had a dramatic effect on the amplitude of uIPSCs and on the occurrence of failures. At a [Ca2+]e of 0.5 mm, most APs failed to evoke inward currents, and the amplitude of the successes was in the range of 10–50 pA. Elevating the [Ca2+]e all the way up to 8 mm reduced the failure rate and dramatically increased the amplitude of uIPSCs (up to 400–600 pA). At high [Ca2+]e, even when the mean uIPSC was in the range of 400–600 pA, indicating the synchronous release of ∼20 quanta, there was still a large trial-to-trial variability in the amplitude of the responses in some cells (Fig. 2 E). To estimate the quantal parameters, we calculated the mean and variance of an average of ∼70 uIPSCs under each available Pr condition (from three to six different conditions). Quantal parameters were derived from the weighted parabolic fit to the variance–mean relationship (Silver et al., 1998; Reid and Clements, 1999; Scheuss and Neher, 2001; Saviane and Silver, 2006). Some trial-to-trial variability in q at individual release sites (intrasite or type I quantal variance) and also variability among release sites (intersite or type II quantal variance) are likely to be present at these connections, similar to that found in many other GABAergic synapses (Auger and Marty, 1997, 2000; Nusser et al., 1997; Nusser, 2002). Thus, we calculated the CV I and CV II and included them into our model (Silver, 2003). The CV I was determined with two different methods. In one cell pair (AB643), MPFA estimated the presence of only a single release site; therefore, the CV of successful uIPSCs at this connection (CV I, 0.18) reflects intrasite variability only. In three multisite connections, where the maximum Pr was estimated to be >0.9, an upper limit of CV I of 0.21 ± 0.05 (n = 3) was derived (Silver, 2003). We also estimated the total quantal variance (CV T, 0.33 ± 0.06; n = 7) from multisite connections under low-Pr conditions (see Materials and Methods) from which a CV II of 0.25 was calculated. Taking into account both type I (0.21) and type II (0.25) quantal CVs and using a multinomial quantal model (Silver, 2003), a q of 43.4 ± 6.1 pA (range, 18–96 pA; n = 13) and an NF of 13.0 ± 2.9 (range, 1–41; n = 13) was obtained (Figs. 1 E, 2 F). Because of the limited number of distinct Pr conditions and the limited range in Pr per connection, the quantal parameters as obtained from the parabolic fit are prone to errors (Scheuss and Neher, 2001; Silver, 2003). To estimate such errors, the 95% confidence intervals were calculated for both NF (NF (0.025) = 5.7 ± 1.2; n = 13) and q (q (0.975) = 77.2 ± 16.5 pA; n = 13; for details see Materials and Methods). To exclude the possibility that the mean and range of the quantal parameters are profoundly influenced by values obtained with low confidence, we omitted those pairs in which the NF (0.025)/NF(mean) was <0.4 (3 of 13 cells; e.g., for the cell illustrated in Fig. 2: NF(mean) = 41 and NF (0.025) = 6). For the remaining cells, the range (18–96 pA) and the mean (41.7 ± 7.4 pA; n = 10) (Table 1) of the q were almost identical to those calculated from all cells. Similarly, the average NF was only slightly smaller (10.8 ± 2.3; n = 10) with a similarly large range (1–26; mean ± SEM of N F(0.025) for the 10 cells, 6.4 ± 1.5), indicating that the large range in these quantal parameters is not the consequence of the uncertainty in their determination (Table 1).
Table 1.
The number of release sites between CA3 INs and PCs as determined by quantal analysis and electron microscopy
| Cell identification | Cell type | Initial P f | Ca/Mg | q | N F(mean) | N F(0.025) | Number of boutons | N EM(mean) | N EM(max) | N F(mean)/N EM(mean) | N F(0.025)/N EM(max) |
|---|---|---|---|---|---|---|---|---|---|---|---|
| AB607 | BC | 0.15 | 4/0.5 + AM | 96.2 | 6 | 4 | |||||
| AB616 | MFA | 0.05 | 8/2.25 | 59.8 | 13 | 7 | 2 | 3.1 | 4 | 4.3 | 1.6 |
| AB617 | MFA | 0.54 | 8/0.25 + AM | 24.2 | 18 | 10 | 3 | 4.7 | 6 | 3.8 | 1.7 |
| AB624 | BC | 0.16 | 8/0.25 + AM | 24.1 | 26 | 18 | 2 | 5.4 | 10 | 4.9 | 1.8 |
| AB625 | Bistratif | 0.82 | 8/0.25 + AM | 18.2 | 8 | 6 | |||||
| AB626 | 0.20 | 4/0.5 + AM | 43.7 | 10 | 4 | ||||||
| AB643 | BC | 0.76 | 8/0.25 + AM | 28.0 | 1 | 1 | |||||
| AB648 | 0.98 | 8/0.25 + AM | 44.5 | 8 | 6 | ||||||
| AB649 | 0.98 | 8/0.25 + AM | 49.8 | 6 | 4 | ||||||
| AB650 | MFA | 0.80 | 4/0.5 + AM | 28.6 | 12 | 5 | 1 | 1.6 | 2 | 8.0 | 2.5 |
| AB651 | MFA | 5 (1 + 4) | 8.9 | 13 | |||||||
| Mean | 0.54 | 41.7 | 10.8 | 6.4 | 2.6 | 4.7 | 7.0 | 5.2 | 1.9 | ||
| SEM | 0.12 | 7.4 | 2.3 | 1.5 | 0.7 | 1.2 | 2.0 | 0.9 | 0.2 | ||
| n | 10 | 10 | 10 | 10 | 5 | 5 | 5 | 4 | 4 |
P f, Failure rate; Ca/Mg, the highest [Ca2+]e and lowest [Mg2+]e conditions for a given cell (in micromolars); q, quantal size derived from MPFA; NF (mean), number of functional release sites derived from MPFA; NF, lower limit of the 95% confidence interval of NF; NEM (mean) and NEM (max), mean and maximum number, respectively, of AZs per connection calculated from the number of EM-identified boutons and from the mean and maximum number of AZs per bouton (see Table 2); AM, the presence of 10 μm AM251 during the recording; BC, basket cell; MFA, mossy fiber-associated cell; Bistratif, bistratified cell.
aBold and italics indicate the number of boutons synapsing on dendrites and somata, respectively.
Because our functional analysis resulted in a very large estimate of NF in a substantial fraction of the cell pairs, we next asked whether there are indeed up to 26 synaptic junctions between our recorded cells. After the recordings, the slices were fixed, biocytin was visualized, and the cells were analyzed at the LM level. Both presynaptic and postsynaptic cells were thoroughly checked for completeness. Only those pairs (n = 5) that showed no sign of incomplete filling of the presynaptic axon or the somato-dendritic domain of the pyramidal cell and no truncation occurred during the processing were included in the detailed anatomical analysis. These cell pairs were first reconstructed using the Neurolucida system (Figs. 1, 2). All sites where the axon of the presynaptic cell approached (<1 μm) the dendrites or the soma of the postsynaptic pyramidal cell were photographed, and the existence of synaptic junctions was examined at the EM level. The number of boutons (N EM(boutons) = 2.6 ± 0.7; n = 5; range, 1–5) that established at least one EM-defined synapse on the postsynaptic pyramidal cell could be reliably determined (Figs. 1, 2). However, the strong diaminobenzidine precipitate in the presynaptic and postsynaptic structures precluded the thorough identification of the exact number of AZs made by these physiologically characterized axon terminals (e.g., distinguishing between two AZs vs one U-shaped perforated AZ is impossible). Because there is no quantitative data on the number of AZs per single GABAergic axon terminal in the hippocampal CA3 area, we determined this using three-dimensional EM reconstructions.
Our electrophysiological data demonstrated that all 13 presynaptic INs were cannabinoid ligand sensitive. Because CB1 receptors are strongly expressed by CCK+ GABAergic interneurons in the hippocampus (Katona et al., 1999), we determined the number of AZs per CCK+ bouton. We visualized the CCK immunoreaction with small gold particles and performed the reactions on age-matched tissue with optimal ultrastructural preservation (Fig. 3 A1–A6, B1–B4). To provide an unbiased estimate of the mean and maximum number of AZs per bouton, we reconstructed randomly selected CCK+ boutons making synapses on somata (somatic boutons) and proximal dendrites (dendritic boutons) of CA3 pyramidal cells (Fig. 3 A–C, Table 2). The variability and the range of the volume of the reconstructed CCK+ boutons paralleled those of the recorded pairs (Fig. 3 D), confirming that we sampled the same bouton population. The number of AZs per bouton, the area of individual AZs, and the total AZ area per bouton was measured in three dimensions. Our results revealed that CCK+ somatic and dendritic boutons had similar volumes (0.65 ± 0.08 μm3, n = 16 vs 0.68 ± 0.15 μm3, n = 9; p = 0.85) (Table 2) and total AZ areas per bouton (0.12 ± 0.01 μm2 vs 0.11 ± 0.01 μm2; p = 0.46), but the number of AZs per bouton (somatic, 2.7 ± 0.3 vs dendritic, 1.6 ± 0.2; p < 0.01), and therefore the average AZ area (somatic, 0.047 ± 0.003 μm2 vs dendritic, 0.072 ± 0.009 μm2; p < 0.05), was significantly different between the two populations, demonstrating that somatic and dendritic boutons need to be considered and analyzed separately (Table 2). Interestingly, the area of individual AZs showed a large variability for both somatic (CV, 0.52) and dendritic (CV, 0.49) boutons.
Figure 3.

Morphological characterization of CCK-immunopositive axon terminals. A, Three-dimensional reconstruction of a CCK-positive bouton (corresponds to bouton 2 in Table 2) that establishes four AZs (orange, indicated by numbers) on a pyramidal cell soma. Inset, The bouton from a different angle. A1–A6, Electron micrographs of the CCK-immunopositive (immunogold particles) bouton shown in A. AZs are recognized from the rigid apposition of presynaptic and postsynaptic membranes and from the clusters of vesicles. Arrowheads mark the edges of the AZs, and the numbers correspond to those in A. Numbers in the top right corner represent the number of the sections from the series. B, A representative dendritic bouton (bouton 7 in Table 2) with two release sites. Inset, The bouton from a different angle. B1–B4, Two pairs of consecutive EM images illustrate the two AZs of the bouton shown in B. Arrowheads mark the edges of the AZs. Numbers in the top right corner correspond to the number of sections from the series. C, One of the largest dendritic boutons (bouton 9 in Table 2) contains only a single release site. D, The number of AZs has a positive correlation with the bouton volume for CCK+ axon terminals making somatic synapses (filled triangle), but no correlation was found for boutons synapsing on dendrites (filled circle). Open symbols above the plot represent boutons of the recorded INs synapsing on somata (open triangle) and dendrites (open circle). In LM reconstructions, each side of the cubes is 0.5 μm; EM images are all at the same magnification. Scale bar, 0.2 μm.
Table 2.
Morphological parameters of three-dimensionally reconstructed CCK-immunopositive boutons
| Bouton no. | Bouton volume (μm3) | Number of AZs/bouton | Area of individual AZs (μm2) |
Sum of AZ area (in μm2) | Mean of AZ area (in μm2) | ||||
|---|---|---|---|---|---|---|---|---|---|
| No. 1 | No. 2 | No. 3 | No. 4 | No. 5 | |||||
| Somatic 1 | 0.568 | 2 | 0.083 | 0.039 | 0.122 | 0.061 | |||
| Somatic 2 | 1.285 | 4 | 0.085 | 0.044 | 0.029 | 0.039 | 0.197 | 0.049 | |
| Somatic 3 | 0.230 | 1 | 0.041 | 0.041 | 0.041 | ||||
| Somatic 4 | 0.918 | 2 | 0.067 | 0.041 | 0.109 | 0.054 | |||
| Somatic 5 | 0.706 | 2 | 0.064 | 0.032 | 0.096 | 0.048 | |||
| Somatic 6 | 0.617 | 3 | 0.016 | 0.043 | 0.026 | 0.084 | 0.028 | ||
| Somatic 7 | 0.242 | 1 | 0.071 | 0.071 | 0.071 | ||||
| Somatic 8 | 0.632 | 3 | 0.024 | 0.060 | 0.011 | 0.095 | 0.032 | ||
| Somatic 9 | 0.915 | 5 | 0.045 | 0.043 | 0.046 | 0.066 | 0.009 | 0.208 | 0.042 |
| Somatic 10 | 0.646 | 4 | 0.020 | 0.050 | 0.064 | 0.039 | 0.174 | 0.043 | |
| Somatic 11 | 0.259 | 2 | 0.054 | 0.028 | 0.082 | 0.041 | |||
| Somatic 12 | 0.816 | 3 | 0.040 | 0.118 | 0.016 | 0.173 | 0.058 | ||
| Somatic 13 | 0.793 | 3 | 0.027 | 0.026 | 0.079 | 0.133 | 0.044 | ||
| Somatic 14 | 0.581 | 2 | 0.047 | 0.070 | 0.117 | 0.059 | |||
| Somatic 15 | 0.930 | 5 | 0.065 | 0.021 | 0.036 | 0.026 | 0.017 | 0.165 | 0.033 |
| Somatic 16 | 0.221 | 1 | 0.044 | 0.044 | 0.044 | ||||
| Mean | 0.647 | 2.7** | 0.119 | 0.047* | |||||
| SEM | 0.075 | 0.3 | 0.013 | 0.003 | |||||
| Dendritic 1 | 1.030 | 2 | 0.079 | 0.010 | 0.089 | 0.045 | |||
| Dendritic 2 | 1.496 | 2 | 0.080 | 0.067 | 0.147 | 0.074 | |||
| Dendritic 3 | 0.262 | 1 | 0.095 | 0.095 | 0.095 | ||||
| Dendritic 4 | 0.289 | 2 | 0.023 | 0.072 | 0.096 | 0.048 | |||
| Dendritic 5 | 1.020 | 2 | 0.022 | 0.103 | 0.125 | 0.063 | |||
| Dendritic 6 | 0.248 | 1 | 0.082 | 0.082 | 0.082 | ||||
| Dendritic 7 | 0.646 | 2 | 0.062 | 0.096 | 0.158 | 0.079 | |||
| Dendritic 8 | 0.228 | 1 | 0.038 | 0.038 | 0.038 | ||||
| Dendritic 9 | 0.902 | 1 | 0.124 | 0.124 | 0.124 | ||||
| Mean | 0.680 | 1.6** | 0.106 | 0.072* | |||||
| SEM | 0.152 | 0.2 | 0.012 | 0.009 | |||||
*p < 0.05 and **p < 0.01, two-sample t test with unequal variance.
Given the large range of bouton volume, we asked whether the number of AZs had any correlation with the volume of terminals targeting somata and dendrites. The number of AZs per bouton did not correlate with the bouton volume in the case of dendritic terminals; one or a maximum of two AZs were found in dendritic boutons regardless of the bouton size (Fig. 3 D, Table 2). In contrast, the number of AZs per somatic bouton showed a positive correlation (p < 0.001) with the bouton volume (range, 1–5) (Fig. 3 D), but the number of AZs never exceeded five even in the largest boutons. Each dendritic bouton of the pairs was considered to contain, on average, 1.6 and a maximum of 2 AZs, whereas those of somatic boutons were 2.7 and 5, respectively. From this and from NEM(boutons), we calculated the mean and maximum number of AZs for each pair. The mean AZ number per connection ranges from 2 to 9 (NEM(mean) = 4.7 ± 1.2, n = 5), whereas the estimated maximum AZ number per pair (NEM(max)) ranges from 2 to 13 with a mean of 7.0 ± 2.0 (n = 5). In summary, we have revealed that CCK+ interneurons innervate their postsynaptic pyramidal cells with multiple axon terminals (2.6), which contain a variable number (1–5) of AZs. We estimated the mean and maximum number of AZs per connection to be approximately five and seven, respectively.
Our anatomical and physiological experiments allowed the direct comparison of the structurally and functionally determined number of release sites in five pairs. First, NF was divided by the NEM(mean) in all five pairs, revealing, on average, a 5.1 ± 0.7-fold discrepancy between these values. When only those cells were analyzed where NF (0.025)/NF(mean) was >0.4, the NF(mean) was still 5.2 ± 0.9-fold larger than NEM(mean) (n = 4 pairs) (Table 1). We also calculated the scenario that tended to minimize the discrepancy between the estimated Ns by dividing the lower limit of the 95% confidence interval of N F with the maximum of NEM (NF (0.025)/NEM(max) = 1.9 ± 0.2) (Table 1). The average of approximately fivefold and the minimum of approximately twofold discrepancy between the functionally and structurally determined numbers of release sites clearly indicates that at least one of the basic assumptions of our model is not fulfilled. The most parsimonious explanation of our result is that a single presynaptic AZ consists of several functional release sites and the postsynaptic response at these synapses depends on the Pr. An increased synaptic current may be the consequence of an increased driving force for Cl− (ΔECl), an augmented single-channel conductance (γ) of the postsynaptic receptors, an enhanced affinity of the receptors, or an increased synaptic [GABA]. To distinguish between these possibilities, we performed the following experiments. We applied 0.5 mm GABA to the perisomatic region of CA3 pyramidal cells through a patch pipette with positive pressure in 2 mm [Ca2+]e and 2 mm [Mg2+]e, then the [Ca2+]e was elevated to 8 mm and [Mg2+] was lowered to 0.25 mm. If the ECl, γ, or the affinity of the receptors were altered by the elevation of the [Ca2+]e, then the GABA-evoked currents should reflect such changes. However, the transferred charge of GABA-evoked whole-cell responses showed no significant (p > 0.05, paired t test) alterations after the change of [Ca2+]e from 2 to 8 mm (2.1 ± 0.2 nC vs 1.8 ± 0.2 nC; n = 5), just as no significant (p > 0.05, paired t test) change was observed when puffing was continued for the same period of time (∼14 min) in the presence of 2 mm [Ca2+] (1.3 ± 0.4 nC vs 1.4 ± 0.4 nC; n = 6 cell). These results indicate that the most likely explanation of the increased postsynaptic response was an increased synaptic [GABA].
Next, we addressed how large increase in peak [GABA] could underlie the fivefold enhancement of the postsynaptic responses at each synapse. Unfortunately, we are not aware of any experimental approach allowing the direct measurement of [GABA] in the synaptic cleft, leaving multicompartmental channel modeling the method of choice to address this question (Overstreet et al., 2002). Because of the lack of detailed kinetic models of GABAA receptors underlying uIPSCs evoked by CCK+ interneurons in hippocampal CA3 pyramidal cells, we adopted a strategy of using all the available, well characterized multicompartmental receptor models [J & W (Jones and Westbrook, 1995), M & C (Mozrzymas et al., 1999), and H & M (Haas and Macdonald, 1999) models]. It should be noted that these models were constrained based on recordings from different types of GABAA receptors. The synaptic GABA concentration transient was mimicked with an instantaneous rise to a certain peak value and a monoexponential decay (τGABA) with either a 100 or 300 μs time constant (Fig. 4). We generated peak Po versus peak [GABA] plots for both GABA transients for all three receptor models and estimated the increase in peak [GABA] in the steepest part of the dose–response curve necessary to describe a fivefold increase in Po. The slopes of the dose–response curves were very similar for both GABA transients, indicating a rather similar change in peak [GABA]. The M & C model predicted a 6.3-fold increase in peak [GABA] to achieve a fivefold increase in P o. The J & W model indicated a 6.9-fold increase, whereas the H & M model predicted a 5.1-fold increase in peak [GABA]. Furthermore, our modeling also allowed us to predict the peak [GABA] needed to achieve a peak P o sufficiently low (∼0.1) to allow an approximately fivefold increase without exceeding its maximum value (0.5–0.8). This estimate strongly depends on the GABA clearance rate; with a τGABA of 300 μs, a peak P o of 0.1 is reached with a peak [GABA] of 100–400 μm, whereas with a τGABA of 100 μs, the peak [GABA] has to reach 0.3–1.1 mm.
Figure 4.

Estimating changes in peak GABA concentration underlying a fivefold increase in peak open probability of postsynaptic GABAA receptors. The peak Po of GABAA receptors are plotted against the peak cleft GABA concentration using three kinetic models. Synaptic GABA concentration transients were modeled with an instantaneous rise and single-exponential decay time of 0.1 ms (gray) or 0.3 ms (black). Vertical lines (solid lines for τGABA = 0.3 ms, dashed lines for τGABA = 0.1 ms) delineate the changes in peak [GABA] for which a fivefold increase in the peak Po occurs in the steepest part of the curve. Kinetic parameters of the GABAA receptor models were adopted from Jones and Westbrook (1995; J &W model), Mozrzymas et al. (1999; M & C model), and Haas and Macdonald, (1999; H & M model).
What could be the mechanisms underlying such a large Pr-dependent increase in the peak synaptic [GABA]? Intersynaptic neurotransmitter spillover can be easily excluded, because several dozens of very closely spaced release sites would be needed to increase the peak [GABA] fivefold to sevenfold within a few hundred microseconds. To try to distinguish between incomplete/full vesicle fusion versus UVR/MVR, we performed a kinetic analysis of uIPSCs. Choi et al. (2000) have suggested that the synaptic transmitter concentration transient rises slowly during incomplete or “kiss-and-run” vesicle fusion, imposing a slow rise time of the postsynaptic current. In contrast, the transmitter concentration transient is expected to have a rather similar rising phase during UVR and MVR (provided the vesicles are synchronously released), predicting a similar uIPSC rise time. The 10–90% rise time of uIPSCs showed no significant (p > 0.88) difference under low-Pr (0.70 ± 0.07 ms; n = 13) and high-Pr (0.69 ± 0.06 ms; n = 13) conditions (Fig. 5 A,D), suggesting that MVR is a more likely mechanism responsible for the fivefold to sevenfold increase in peak [GABA]. Despite the lack of change in the rise time, the decay time constant of uIPSCs became significantly slower (p < 0.001) at high-Pr (9.3 ± 0.7 ms; n = 13) than at low-Pr (7.3 ± 0.5 ms; n = 13) conditions (Fig. 5 B,D). The ratios of the weighted decay times at high- versus low-Pr conditions demonstrated that this slowing of the decay was present in all but one cell (Fig. 5 C). We interpreted this 30% slowing of the decay as a potential sign of GABA spillover among AZs of the same bouton.
Figure 5.

Kinetic analysis of uIPSCs. A, The 10–90% rise time of uIPSCs does not change from low- to high-Pr conditions. B, The weighted decay time constant of uIPSCs was larger at high-Pr conditions (open symbols, individual uIPSCs; filled symbols, mean ± SEM). C, Distribution of the ratio of IPSC decay time constants at high- and low-Pr conditions. Only 1 of 13 cells showed acceleration, whereas in the rest of the cells there was a slowing of the decay under the high-Pr condition. D, Representative uIPSCs under low-Pr (gray) and high-Pr (black) conditions (AB607) are normalized to their peak amplitudes. Exponential fits to the decay are superimposed. Inset, Non-peak scaled uIPSCs and the presynaptic AP.
Our results clearly demonstrate a large discrepancy between the functionally and structurally determined numbers of release sites. However, it is important to note that this conclusion was reached using experimental conditions designed to accomplish the highest possible Pr (i.e., in the presence of 8 mm [Ca2+]e). Experimentally imposing the largest possible range of Pr to the synapses (e.g., by changing [Ca2+]e and [Mg2+]e) is essential to obtain a reliable estimate of the quantal parameters but cannot be considered physiologically very relevant. Is there a similar large discrepancy between N F and N EM if the [Ca2+]e and [Mg2+]e are kept in the physiological range? This question was addressed by calculating the mean uIPSC amplitude (I (phys) = 81.9 ± 22.2 pA; n = 10) in the presence of 2 mm [Ca2+]e and 2 mm [Mg2+]e. Dividing I (phys) with q resulted in an estimate of the quantal content or N F(phys) (2.0 ± 0.4; n = 10). For those four pairs in which the number of synapses was also determined anatomically, an N F(phys) of 2.1 ± 0.7 was obtained. These values are clearly less than our anatomical estimate of the number of AZs per cell pair (for these four pairs, N EM(mean) = 3.7 ± 0.9). Comparison of N F(phys) with N EM(mean) in those four pairs in which both could be directly determined revealed a N F(phys)/N EM(mean) of 0.6 ± 0.1 (n = 4). These calculations predict that under physiologically relevant divalent cation concentrations, MVR may not be the dominant mode of operation of CCK+ interneuron synapses after the arrival of a single AP.
Discussion
In the present work, in vitro physiological and anatomical techniques were combined to address how the postsynaptic response at a single synapse of a specific subset of hippocampal inhibitory synapses depends on the Pr. Our main finding is that the functionally determined number of release sites was approximately fivefold larger than our EM estimate of the number of AZs. The most parsimonious explanation of this result is that a single presynaptic AZ consists of a large number of functional release sites. Channel modeling predicted that a fivefold to sevenfold increase in peak [GABA] is required for the fivefold enhancement of the postsynaptic response at a single synapse. Such a large increase in peak [GABA] concentration without any alteration in the rising kinetics of uIPSCs is likely to be attributable to the highly synchronous (maximum of few hundred microseconds jitter) release of several GABA-containing vesicles at each AZ under high-Pr conditions. To our knowledge, this is the first demonstration that single AZs are capable of releasing five to seven vesicles with exceptional synchrony at central GABAergic synapses. Another surprising finding of our work is the very low (∼0.1) postsynaptic GABAA receptor occupancy and P o after the release of a single vesicle at these CCK+ GABAergic synapses. Such a low occupancy permits a faithful translation of alterations in peak synaptic [GABA] into postsynaptic currents. This is in contrast to the general view of a high (∼0.8–1) (Auger and Marty, 1997; Nusser et al., 1997) or intermediate (∼0.6) (Perrais and Ropert, 1999, 2000; Hajos et al., 2000) postsynaptic receptor occupancy at central GABAergic synapses.
What could be the main reason for such a large difference in P o among GABAergic synapses? One possibility is that the size of the synapses and the number of postsynaptic receptors varies enormously; only a few tens of postsynaptic GABAA receptors are present at some synapses (e.g., small synapses on cerebellar stellate/basket cells) (Auger and Marty, 1997; Nusser et al., 1997), whereas at some other synapses, several hundreds of postsynaptic receptors face each presynaptic AZ. Another possibility is that the synaptic GABA concentration transient varies among synapses. If GABA clears from the cleft with a time course of ∼1 ms, peak GABA concentrations in the millimolar range could result in full receptor occupancy, whereas if the GABA clearance is around 100 μs, the same peak [GABA] would produce an order of magnitude lower receptor occupancy. Finally, the properties of postsynaptic GABAA receptors could also differ among synapses. Indeed, there is evidence that the subunit composition of the postsynaptic GABAA receptors at cerebellar interneurons is α1β2γ2 (Nusser et al., 1997), whereas the parvalbumin-negative (CCK+) perisomatic synapses on hippocampal pyramidal cells are populated by α2 subunit-containing receptors (Nyiri et al., 2001). Thus, a slow binding rate of the α2 subunit-containing receptors, together with a very rapid GABA transient and a large number of postsynaptic receptors in CCK+ perisomatic hippocampal synapses, could, in theory, lead to a very low peak occupancy after the fusion of a single vesicle. Regardless of the mechanism, the functional consequence of such widely differing occupancies is immediately apparent when the effect of MVR is compared among these synapses. Auger et al. (1998) have demonstrated MVR at GABAergic synapses on cerebellar stellate/basket cells, but the consequence of the release of more than one vesicle was a very small increase in the peak IPSC amplitude (<10%), whereas in the present study, an ∼420% increase in the postsynaptic response in each synapse is required to account for our results. Interestingly, a high postsynaptic AMPA receptor occupancy is also reported to minimize the effect of MVR on peak EPSC amplitudes at cerebellar climbing fiber to Purkinje cell synapses (Wadiche and Jahr, 2001; Foster et al., 2002; Harrison and Jahr, 2003). Thus, we believe that the key question is not whether MVR occurs or not at central synapses, but whether MVR takes place at synapses where the peak postsynaptic receptor occupancy is sufficiently low to transduce the changes in synaptic neurotransmitter concentration into postsynaptic current; or at synapses where receptors are close to saturation after the release of a single vesicle. It will be interesting to identify the factors contributing to low and high postsynaptic receptor occupancy and to reveal the functional role of the pronounced MVR-dependent increase in the postsynaptic response in the operation of the hippocampal network.
Our GABAA receptor modeling indicated that for most models, the near linear part of the Po versus peak [GABA] curve is not sufficient to describe the necessary fivefold increase in Po. In other words, a more than fivefold increase in peak [GABA] is needed for the fivefold increase in Po. As a consequence, the postsynaptic effect of the first, second, third, etc., released vesicle will be remarkably different (i.e., the q depends on the number of simultaneously released vesicles, which is the function of the Pr). Thus, our results predict a Pr-dependent change in the q at these hippocampal GABAergic synapses. It should be noted that this has an implication on the applicability of the quantal analysis (Silver, 2003) (i.e., the q will correspond to the mean quantal size under low Pr conditions, and depending on whether q increases or decreases as a function of elevated Pr, N will be either overestimated or underestimated, respectively).
In our previous work (Biró et al., 2005), we have applied an identical approach to quantitatively describe glutamatergic transmission between CA1 pyramidal cells and a subpopulation of GABAergic interneurons (the so-called oriens-lacunosum molecular and oriens-bistratified cells). Our studies clearly indicate that this experimental approach is able to reveal, depending on the case, differences between the EM-determined number of AZs and functionally determined release sites or a very similar functional and structural estimate. As discussed in our previous work (Biró et al., 2005), all studies so far that have used paired recordings and consequent anatomical estimations of N to investigate the mechanisms of synaptic transmission in the CNS (Korn et al., 1981, 1982; Gulyas et al., 1993; Silver et al., 2003; Biró et al., 2005) arrived at the conclusion that the transmission can be adequately described by a binomial quantal model without MVR, supporting the “one-release site, one-vesicle” hypothesis (Korn et al., 1994). To some extent, our current study is at odds with these published works. However, as discussed above, under physiologically relevant [Ca2+]e and [Mg2+]e, MVR is not as prevalent as found under the experimentally imposed high-Pr condition.
Footnotes
Z.N. is the recipient of a Wellcome Trust Project grant, a European Commission Integrated Project grant (EUSynapse project; LSHM-CT-2005-019055), and a European Young Investigator Award (www.esf.org/euryi). The financial support from these foundations is gratefully acknowledged. We thank Drs. Angus Silver and Mark Eyre for their comments on this manuscript and Dr. László Kocsis and Mihály Köllo″ for their help with the modeling and statistical analysis.
References
- Abbott LF, Regehr WG. Synaptic computation. Nature. 2004;431:796–803. doi: 10.1038/nature03010. [DOI] [PubMed] [Google Scholar]
- Auger C, Marty A. Heterogeneity of functional synaptic parameters among single release sites. Neuron. 1997;19:139–150. doi: 10.1016/s0896-6273(00)80354-2. [DOI] [PubMed] [Google Scholar]
- Auger C, Marty A. Quantal currents at single-site central synapses. J Physiol (Lond) 2000;526:3–11. doi: 10.1111/j.1469-7793.2000.t01-3-00003.x. [DOI] [PMC free article] [PubMed] [Google Scholar]
- Auger C, Kondo S, Marty A. Multivesicular release at single functional synaptic sites in cerebellar stellate and basket cells. J Neurosci. 1998;18:4532–4547. doi: 10.1523/JNEUROSCI.18-12-04532.1998. [DOI] [PMC free article] [PubMed] [Google Scholar]
- Bergles DE, Diamond JS, Jahr CE. Clearance of glutamate inside the synapse and beyond. Curr Opin Neurobiol. 1999;9:293–298. doi: 10.1016/s0959-4388(99)80043-9. [DOI] [PubMed] [Google Scholar]
- Biró AA, Holderith NB, Nusser Z. Quantal size is independent of the release probability at hippocampal excitatory synapses. J Neurosci. 2005;25:223–232. doi: 10.1523/JNEUROSCI.3688-04.2005. [DOI] [PMC free article] [PubMed] [Google Scholar]
- Choi S, Klingauf J, Tsien RW. Postfusional regulation of cleft glutamate concentration during LTP at “silent synapses.”. Nat Neurosci. 2000;3:330–336. doi: 10.1038/73895. [DOI] [PubMed] [Google Scholar]
- Christie JM, Jahr CE. Multivesicular release at Schaffer collateral–CA1 hippocampal synapses. J Neurosci. 2006;26:210–216. doi: 10.1523/JNEUROSCI.4307-05.2006. [DOI] [PMC free article] [PubMed] [Google Scholar]
- Conti R, Lisman J. The high variance of AMPA receptor- and NMDA receptor-mediated responses at single hippocampal synapses: evidence for multiquantal release. Proc Natl Acad Sci USA. 2003;100:4885–4890. doi: 10.1073/pnas.0630290100. [DOI] [PMC free article] [PubMed] [Google Scholar]
- Foster KA, Kreitzer AC, Regehr WG. Interaction of postsynaptic receptor saturation with presynaptic mechanisms produces a reliable synapse. Neuron. 2002;36:1115–1126. doi: 10.1016/s0896-6273(02)01106-6. [DOI] [PubMed] [Google Scholar]
- Frerking M, Wilson M. Saturation of postsynaptic receptors at central synapses? Curr Opin Neurobiol. 1996;6:395–403. doi: 10.1016/s0959-4388(96)80125-5. [DOI] [PubMed] [Google Scholar]
- Frerking M, Borges S, Wilson M. Variation in GABA mini amplitude is the consequence of variation in transmitter concentration. Neuron. 1995;15:885–895. doi: 10.1016/0896-6273(95)90179-5. [DOI] [PubMed] [Google Scholar]
- Gulyas AI, Miles R, Sik A, Toth K, Tamamaki N, Freund TF. Hippocampal pyramidal cells excite inhibitory neurons through a single release site. Nature. 1993;366:683–687. doi: 10.1038/366683a0. [DOI] [PubMed] [Google Scholar]
- Haas KF, Macdonald RL. GABAA receptor subunit g2 and d subtypes confer unique kinetic properties on recombinant GABAA receptor currents in mouse fibroblasts. J Physiol (Lond) 1999;514:27–45. doi: 10.1111/j.1469-7793.1999.027af.x. [DOI] [PMC free article] [PubMed] [Google Scholar]
- Hajos N, Nusser Z, Rancz EA, Freund TF, Mody I. Cell type- and synapse-specific variability in synaptic GABAA receptor occupancy. Eur J Neurosci. 2000;12:810–818. doi: 10.1046/j.1460-9568.2000.00964.x. [DOI] [PubMed] [Google Scholar]
- Hanse E, Gustafsson B. Quantal variability at glutamatergic synapses in area CA1 of the rat neonatal hippocampus. J Physiol (Lond) 2001;531:467–480. doi: 10.1111/j.1469-7793.2001.0467i.x. [DOI] [PMC free article] [PubMed] [Google Scholar]
- Harrison J, Jahr CE. Receptor occupancy limits synaptic depression at climbing fiber synapses. J Neurosci. 2003;23:377–383. doi: 10.1523/JNEUROSCI.23-02-00377.2003. [DOI] [PMC free article] [PubMed] [Google Scholar]
- Jones MV, Westbrook GL. Desensitized states prolong GABAA channel responses to brief agonist pulses. Neuron. 1995;15:181–191. doi: 10.1016/0896-6273(95)90075-6. [DOI] [PubMed] [Google Scholar]
- Katona I, Sperlagh B, Sik A, Kafalvi A, Vizi ES, Mackie K, Freund TF. Presynaptically located CB1 cannabinoid receptors regulate GABA release from axon terminals of specific hippocampal interneurons. J Neurosci. 1999;19:4544–4558. doi: 10.1523/JNEUROSCI.19-11-04544.1999. [DOI] [PMC free article] [PubMed] [Google Scholar]
- Korn H, Triller A, Mallet A, Faber DS. Fluctuating responses at a central synapse: n of binomial fit predicts number of stained presynaptic boutons. Science. 1981;213:898–901. doi: 10.1126/science.6266015. [DOI] [PubMed] [Google Scholar]
- Korn H, Mallet A, Triller A, Faber DS. Transmission at a central inhibitory synapse. II. quantal description of release, with a physical correlate for binomial n. J Neurophysiol. 1982;48:679–707. doi: 10.1152/jn.1982.48.3.679. [DOI] [PubMed] [Google Scholar]
- Korn H, Sur C, Charpier S, Legendre P, Faber DS. The one-vesicle hypothesis and multivesicular release. New York: Raven; 1994. [DOI] [PubMed] [Google Scholar]
- Lawrence JJ, Grinspan ZM, McBain CJ. Quantal transmission at mossy fibre targets in the CA3 region of the rat hippocampus. J Physiol (Lond) 2004;554:175–193. doi: 10.1113/jphysiol.2003.049551. [DOI] [PMC free article] [PubMed] [Google Scholar]
- Liu GS. Presynaptic control of quantal size: kinetic mechanisms for synaptic transmission and plasticity. Curr Opin Neurobiol. 2003;13:324–331. doi: 10.1016/s0959-4388(03)00078-3. [DOI] [PubMed] [Google Scholar]
- Losonczy A, Biró AA, Nusser Z. Persistently active cannabinoid receptors mute a subpopulation of hippocampal interneurons. Proc Natl Acad Sci USA. 2004;101:1362–1367. doi: 10.1073/pnas.0304752101. [DOI] [PMC free article] [PubMed] [Google Scholar]
- Mozrzymas JW, Barberis A, Michalak K, Cherubini E. Chlorpromazine inhibits miniature GABAergic currents by reducing the binding and by increasing the unbinding rate of GABAA receptors. J Neurosci. 1999;19:2474–2488. doi: 10.1523/JNEUROSCI.19-07-02474.1999. [DOI] [PMC free article] [PubMed] [Google Scholar]
- Murphy GJ, Glickfeld LL, Balsen Z, Isaacson JS. Sensory neuron signaling to the brain: properties of transmitter release from olfactory nerve terminals. J Neurosci. 2004;24:3023–3030. doi: 10.1523/JNEUROSCI.5745-03.2004. [DOI] [PMC free article] [PubMed] [Google Scholar]
- Nusser Z. Release-independent short-term facilitation at GABAergic synapses in the olfactory bulb. Neuropharmacology. 2002;43:573–583. doi: 10.1016/s0028-3908(02)00158-2. [DOI] [PubMed] [Google Scholar]
- Nusser Z, Cull-Candy S, Farrant M. Differences in synaptic GABAA receptor number underlie variation in GABA mini amplitude. Neuron. 1997;19:697–709. doi: 10.1016/s0896-6273(00)80382-7. [DOI] [PubMed] [Google Scholar]
- Nyiri G, Freund TF, Somogyi P. Input-dependent synaptic targeting of a2-subunit-containing GABAA receptors in synapses of hippocampal pyramidal cells of the rat. Eur J Neurosci. 2001;13:428–442. doi: 10.1046/j.1460-9568.2001.01407.x. [DOI] [PubMed] [Google Scholar]
- Oertner TG, Sabatini BL, Nimchinsky EA, Svoboda K. Facilitation at single synapses probed with optical quantal analysis. Nat Neurosci. 2002;5:657–964. doi: 10.1038/nn867. [DOI] [PubMed] [Google Scholar]
- Overstreet LS, Westbrook GL, Jones M V. Measuring and modeling the spatiotemporal profile of GABA at the synapse. In: Quick MW, editor. Transmembrane transporters. Hoboken, NJ: Wiley-Liss; 2002. pp. 259–275. [Google Scholar]
- Perrais D, Ropert N. Effect of zolpidem on miniature IPSCs and occupancy of postsynaptic GABAA receptors in central synapses. J Neurosci. 1999;19:578–588. doi: 10.1523/JNEUROSCI.19-02-00578.1999. [DOI] [PMC free article] [PubMed] [Google Scholar]
- Perrais D, Ropert N. Altering the concentration of GABA in the synaptic cleft potentiates miniature IPSCs in rat occipital cortex. Eur J Neurosci. 2000;12:400–404. doi: 10.1046/j.1460-9568.2000.00957.x. [DOI] [PubMed] [Google Scholar]
- Reid CA, Clements JD. Postsynaptic expression of long-term potentiation in the rat dentate gyrus demonstrated by variance-mean analysis. J Physiol (Lond) 1999;518:121–130. doi: 10.1111/j.1469-7793.1999.0121r.x. [DOI] [PMC free article] [PubMed] [Google Scholar]
- Saviane C, Silver RA. Errors in the estimation of the variance: implications for multiple probability fluctuation analysis. J Neurosci Methods. 2006;153:250–260. doi: 10.1016/j.jneumeth.2005.11.003. [DOI] [PubMed] [Google Scholar]
- Scanziani M, Salin PA, Vogt KE, Malenka RC, Nicoll RA. Use-dependent increases in glutamate concentration activate presynaptic metabotropic glutamate receptors. Nature. 1997;385:630–634. doi: 10.1038/385630a0. [DOI] [PubMed] [Google Scholar]
- Scheuss V, Neher E. Estimating synaptic parameters from mean, variance, and covariance in trains of synaptic responses. Biophys J. 2001;81:1970–1989. doi: 10.1016/S0006-3495(01)75848-1. [DOI] [PMC free article] [PubMed] [Google Scholar]
- Scheuss V, Schneggenburger R, Neher E. Separation of presynaptic and postsynaptic contributions to depression by covariance analysis of successive EPSCs at the calyx of held synapse. J Neurosci. 2002;22:728–739. doi: 10.1523/JNEUROSCI.22-03-00728.2002. [DOI] [PMC free article] [PubMed] [Google Scholar]
- Silver RA. Estimation of nonuniform quantal parameters with multiple-probability fluctuation analysis: theory, application and limitations. J Neurosci Methods. 2003;130:127–141. doi: 10.1016/j.jneumeth.2003.09.030. [DOI] [PubMed] [Google Scholar]
- Silver RA, Cull-Candy SG, Takahashi T. Non-NMDA glutamate receptor occupancy and open probability at a rat cerebellar synapse with single and multiple release sites. J Physiol (Lond) 1996;494:231–250. doi: 10.1113/jphysiol.1996.sp021487. [DOI] [PMC free article] [PubMed] [Google Scholar]
- Silver RA, Momiyama A, Cull-Candy SG. Locus of frequency-dependent depression identified with multiple- probability fluctuation analysis at rat climbing fibre-Purkinje cell synapses. J Physiol (Lond) 1998;510:881–902. doi: 10.1111/j.1469-7793.1998.881bj.x. [DOI] [PMC free article] [PubMed] [Google Scholar]
- Silver RA, Lubke J, Sakmann B, Feldmeyer D. High-probability uniquantal transmission at excitatory synapses in barrel cortex. Science. 2003;302:1981–1984. doi: 10.1126/science.1087160. [DOI] [PubMed] [Google Scholar]
- Sloviter RS, Ali-Akbarian L, Horvath KD, Menkens KA. Substance P receptor expression by inhibitory interneurons of the rat hippocampus: enhanced detection using improved immunocytochemical methods for the preservation and colocalization of GABA and other neuronal markers. J Comp Neurol. 2001;430:283–305. [PubMed] [Google Scholar]
- Tong G, Jahr CE. Multivesicular release from excitatory synapses of cultured hippocampal neurons. Neuron. 1994;12:51–59. doi: 10.1016/0896-6273(94)90151-1. [DOI] [PubMed] [Google Scholar]
- Wadiche JI, Jahr CE. Multivesicular release at climbing fiber-Purkinje cell synapses. Neuron. 2001;32:301–313. doi: 10.1016/s0896-6273(01)00488-3. [DOI] [PubMed] [Google Scholar]
- Watanabe J, Rozov A, Wollmuth LP. Target-specific regulation of synaptic amplitudes in the neocortex. J Neurosci. 2005;25:1024–1033. doi: 10.1523/JNEUROSCI.3951-04.2005. [DOI] [PMC free article] [PubMed] [Google Scholar]
- Zador AM, Dobrunz LE. Dynamic synapses in the cortex. Neuron. 1997;19:1–4. doi: 10.1016/s0896-6273(00)80341-4. [DOI] [PubMed] [Google Scholar]