Abstract
Free-standing and supported films with lateral gradient in composition were prepared using blends of poly(acrylic acid) (PAA)/sodium salt and its copolymers with acrylamide (AAm) in an applied electric field. The gradients were stabilized by complexation of carboxylate groups with metal species. To find the favorable conditions and components for successful blending and interaction with Fe and Ce species, we studied blending of the two PAA samples with molecular weights of 2,000 and 15,000 Da with two copolymers of AA and AAm (with 10 and 70 wt. % of AA units) and interaction of these blends with Fe(III) and Ce(IV) ions. The structure of the hybrid (blend) films was studied using differential scanning calorimetry (DSC), X-ray photoelectron spectroscopy (XPS), UV-vis spectroscopy, X-ray diffraction and optical microscopy. To ensure blend miscibility and efficient interaction with metal ions, the copolymer containing 70 wt.% of AA units has been used. The surface enrichment with metal species was observed at all experimental conditions studied in this work. For lateral gradient film formation, 15,000 Da PAA has been used to avoid uneven distribution of the homopolymer in the film, observed for 2,000 Da PAA. The gradient films were characterized by XPS. The lateral gradient of functionality such as COONa group or Fe content, has been obtained at different strengths of electric field applied during film formation. The use of lower voltage allows one to prevent NaOH formation and creates more favorable conditions for development of a gradient polymer film. The Ce content gradient was not observed due to formation of large Ce oxide particles (≥750 nm), masking the gradient of functionality. For the first time, free-standing films with lateral gradient in composition were prepared using an applied electric field.
1. Introduction
In nature many load-bearing biomaterials with excellent mechanical properties have chemical and morphological interface gradients between hard and soft tissues. Based on recent mussel byssus and polychaete jaw studies it is suggested that these gradient structures minimize interfacial stresses, increase mechanical toughness, reduce fracture and enhance energy dissipation between adjoining stiff and soft tissue, 1,2 The chemistry that nature uses to establish these gradient interface structures is unique and not well understood or utilized in composite material synthesis or processing. In general it is not a layer-by-layer deposition process, but instead involves a continuous modification of composition and structure. In this manuscript polymer electrolyte blending and applied electric fields are used to generate such continuous gradient interfaces.
The byssal threads in mussels are used by mollusks for attachment to hard surfaces in the turbulent intertidal zone. Recently a gradient of Dopa (3,4-dihydroxyphenylalanine) along the length of the foot was found along with closely coupled gradients in Al and Fe distribution.3 Another example of the creation of a gradient intermediate region is the structure of the soft zone separating the bulk dentine and enamel.4 This zone was found to have a gradual change of structure creating a cushioning region which is responsible for durability of the tooth.
Despite the fact that gradients in biomaterials have been investigated only relatively recently, interest in synthesizing gradient materials appeared in the late 1980s and early 1990s. In the majority of cases,5–9 the graded transitions in composition between two dissimilar materials such as a metal and a ceramic were explored in order to redistribute thermal stresses. In general gradient materials can be based on inorganic materials such as metals or ceramics or organic materials such as polymers and copolymers.9,10 It is worth mentioning that sometimes gradient materials based on polymers are called “gradient polymers”,10 although in fact there is no gradient along the polymer chain. It has been only demonstrated recently11,12 that gradient copolymers (with variation of the sequence of units along the chain) can be prepared as well using simultaneous copolymerization of suitable monomers. Here we explore instead the use of applied electric field for preparation of materials with a lateral composition gradient.
Another possible difference in gradient materials is how the gradient is created. Scheme 1 shows two possibilities: a gradient is formed in a lateral dimension (Scheme 1A) or across a film cross-section (Scheme 1B).
Scheme 1.
Schematic representation of gradient films composed of two components: A) Lateral gradient (or gradient along the film surface); B) gradient across the film cross-section.
The morphology with cross-section gradient shown in Scheme 1B is easier to make because many methods normally used for thin film preparation can be easily employed. Diamond/β-SiC gradient composite films, for example, were made by chemical vapor deposition of several precursors with a different flow rate.13 Formation of C-SiC-Si gradient films has been achieved by ion beam assisted deposition of carbon on Si substrate leading to silicon carbide with a gradient composition.14 B-C-N compositional gradient layer with enhanced structural and mechanical properties enabled the deposition of stable cBN coatings by sputtering a boron carbide target.15 Co-sputtering from two independent magnetron sources allowed preparation of gradient polymer-metal nanocomposite films based on polytetrafluoroethylene and Ag.16 The fully polymeric films with a cross-sectional gradient or gradient optical fibers can be prepared by diffusing a guest monomer into semicrystalline or glassy polymers limiting the monomer diffusion, followed by polymerization of a guest monomer.10
Lateral gradient materials shown in Scheme 1A are rarer but can be achieved by applying an external field (electric, magnetic, etc.) to a forming film. The example of such an application of the electric field is a lateral thickness gradient of poly(acrylic acid) (PAA) formed by Zn(II)-catalyzed electropolymerization of acrylic acid in the presence of an in-plane electrochemical potential gradient applied to Au working electrodes.17 A similar approach using both PAA and poly(acrylamide) (PAAm) lateral polymerization followed by further derivatization allowed preparation of functional in-plane gradient materials containing various functionalities or Au nanoparticles.18 A recent paper19 reports the preparation of poly(N-isopropylacrylamide) polymer brushes showing lateral gradients in the patchiness of polymer chains. These gradients were achieved through grafting using an atom transfer radical polymerization and utilizing surfaces on which the spatial profile of the initiator density was designed. These elegant materials, however, could be prepared only as thin (~200 nm) films on a specially designed substrate.
We believe that the use of the electric field for development of lateral gradient materials is a promising and robust approach because it allows formation of both free-standing and thin films on various substrates. In this paper we report the formation of lateral gradient films (both supported and free-standing) using blends of PAA/sodium salt and its copolymers with acrylamide (AAm) in the applied electric field and fixing the gradients formed by complexation of carboxylate functionalities with metal species.
In an electrolytic cell the applied potential drops sharply near the electrodes and in a linear manner across the electrolyte. Cations and anions redistribute (or migrate) in the electrolyte driven by the local potential. Diffusion of charged as well as uncharged species opposes the migration. Carboxylate groups (obtained by ionization of carboxylic acid groups) are attracted to the anode during electrolysis and water loss. The resulting carboxylate group concentration profile, determined by counteracting effects of diffusion and migration, can be controlled by both electric field strength and electrolyte composition. Gradient PAAm-AA/PAA films with lateral variation of carboxylate group concentration, resulting from electrochemical treatment, are stabilized by complexation of carboxylate groups with metal species.
In order to determine the optimal conditions and components for blending and interaction with metal species, we first studied the blending of PAA of two molecular weights with two copolymers of AA and AAm at different pH and interaction of these blends with Fe(III) and Ce(IV) ions. Secondly, we used the optimized material preparation procedure for the preparation of gradient materials under the influence of an applied electric field. We chose multivalent ions for complexation to ensure efficient interaction/crosslinking with carboxylate groups. The structure of the hybrid films and the gradient materials was studied using differential scanning calorimetry (DSC), X-ray photoelectron spectroscopy (XPS), UV-vis spectroscopy (UV-vis), X-ray diffraction (XRD), and optical microscopy.
2. Experimental part
2. 1 Materials
PAA (2,000 Da MW, PAA-1), PAA sodium salt (15,000 Da MW, 35 wt.% solution in water, PAA-2), FeCl3 6H2O, and (NH4)2Ce(NO3)6 were purchased from Aldrich and used as received. Poly(acrylamide-acrylic acid, sodium salt) with 70 wt.% of PAA (200 KDa, PAAm-PAA(70)) and Poly(acrylamide-acrylic acid, sodium salt) with 10 wt.% PAA (200 KDa, PAAm-PAA(10)) were purchased from Polysciences Inc. and used without purification. The 1 M NaOH (Aldrich) and 1.0 N HCl (Sigma) aqueous solutions were used as received. Water was purified with a Milli-Q (Millipore) water purification system (18 μS).
2.2 Methods
The 10 wt.% solutions of PAA-1 and copolymers have been prepared by placing 10 g of a corresponding polymer in 90 mL of deionized water followed by 24 h stirring. To make mixed solutions containing 15 or 30 vol.% of PAA-1, 15 or 30 mL of PAA-1, respectively, were mixed with 85 or 70 mL of a copolymer solution followed by 24 h stirring. PAA-2 (35 wt.% solution in water) was diluted to 10 wt.% concentration and then mixed solutions were prepared using the same procedure as for PAA-1. If the pH of the solution was to be adjusted (see Table 1), 1 M solutions of NaOH and HCl have been used. The hybrid free-standing films with thickness of 150 μm were prepared by evaporation of 1.5 mL of a corresponding mixed solution on a PS Petri dish (3.5 cm in diameter) at 40 °C.
Table 1.
Composition of the Polymer Films Based on the Homopolymer/Copolymer Blends
| Sample notation | PAA molecular weight, Da | PAA fraction in the blend, % | Copolymer type | pH |
|---|---|---|---|---|
| #1–1 | 2,000 | 15 | PAAm-PAA(10) | 4.3 |
| #1–2 | 6.5 | |||
|
| ||||
| #2–1 | 2,000 | 30 | PAAm-PAA(10) | 3.9 |
| #2–2 | 6.5 | |||
|
| ||||
| #3 | 2,000 | 15 | PAAm-PAA(70) | 5.8 |
|
| ||||
| #4 | 2,000 | 30 | PAAm-PAA(70) | 5.2 |
|
| ||||
| #5 | 2,000 | 15 | PAAm-PAA(70) | 6.5 |
|
| ||||
| #6 | 2,000 | 30 | PAAm-PAA(70) | 6.5 |
|
| ||||
| #7–1 | 15,000 | 30 | PAAm-PAA(70) | 8.0 |
| #7–2 | 6.5 | |||
|
| ||||
| #8–1 | 15,000 | 15 | PAAm-PAA(70) | 8.0 |
| #8–2 | 6.0 | |||
| #8–3 | 6.5 | |||
Interaction with metal ions was carried out by placing the polymer films in the methanol or ethanol solutions of the corresponding salt (4 w/v %) and using stirring for the ion exchange time exceeding 1 min. Reaction conditions and the metal content found by XPS measurements are presented in Table 2.
Table 2.
Composition of Metal-containing Films Based on PAA and PAAm-PAA(70).a)
| Sample notation | PAA fraction in the blend, wt.% | Metal type | Ion exchange time | Metal content by XPS, mol.%/wt.% | Metal content by elemental analysis, wt. % | Fe(III)/Fe(II) ratio |
|---|---|---|---|---|---|---|
| #5-Fe-methb)-1 min | 15 | Fe | 1 min | 1.78 | - | 2.2 |
| #5-Fe-meth-5 min | 15 | Fe | 5 min | 1.85/6.30 | 2.20 | 4.0 |
| #5-Fe-meth-10 min | 15 | Fe | 10 min | 1.99 | - | 5.9 |
| #5-Fe-meth-30 min | 15 | Fe | 30 min | 1.95/6.60 | 3.40 | 10.6 |
| #5-Fe-meth-3 h | 15 | Fe | 3 h | 2.03 | - | 11.1 |
| #6-Fe-meth-5 min | 30 | Fe | 5 min | 1.03 | - | 8.9 |
| #6-Fe-meth-30 min | 30 | Fe | 30 min | 1.69 | - | 8.8 |
| #5-Fe-eth-30 minc) | 30 | Fe | 30 min | 0.93 | - | 3.4 |
| #5-Ce-meth-15 sec | 15 | Ce | 15 sec | 1.28/11.06 | 0.40 | - |
| #5-Ce2-meth-15 secd) | 15 | Ce | 15 sec | 1.52 | - | - |
| #5-Ce-meth-30 sec | 15 | Ce | 30 sec | 1.91/16.5 | 0.44 | - |
| #5-Ce-meth-2 min | 15 | Ce | 2 min | 2.20/19.01 | 1.40 | - |
| #5-Ce-meth-30 min | 15 | Ce | 30 min | 2.24/19.35 | 2.19 | - |
| #6-Ce-meth-2 min | 30 | Ce | 2 min | 1.50 | - |
The solvent used for metal salt dissolution is methanol if not indicated otherwise.
Here and further “meth” in the sample notations stands for methanol.
Ethanol was used as a solvent and “eth” stands for ethanol.
Concentration of the Ce salt was doubled (8 wt/v %).
To create a gradient of functionality we used an electric field applied between two platinum electrodes in contact with a mixed solution containing PAA and PAAm-PAA(70). Two major setups have been used. To prepare free-standing films of 155 m, the mixed solution (1.5 mL) was placed into the PS Petri dish between two 2.5 cm wide electrodes parallel to each other and spaced 2 cm apart which were normal to the dish surface. The applied potential difference varied from 3 to 6 V. At this voltage insignificant water electrolysis was observed but bubbling occurred only in the proximity of electrodes and did not disrupt the integrity of the forming film. Film formation occurred during water evaporation at 40 °C. In the second setup, thin supported films were prepared on a rough surface of 1 by 3 inch glass substrates. Rough surface was made by sandblasting glass slides to achieve better film adhesion. Electrode stripes were cut from a Gas Diffusion Electrode loaded with a platinum catalyst (product of E-TEK ELAT, 30% Pt on Vulcan XC-72) and glued to substrates with a double-sided sticky tape. Thin supported films of 1 μm thickness were prepared by placing 100 L of the corresponding solution on the glass slide between the electrodes and by applying a potential difference of 3–5 V at 40 °C.
2.3 Characterization
DSC was performed using a Netzsch DSC 204 calorimeter. Both cyclohexane and indium were used to calibrate transitions. Polymer films were ground with mortar and pestle to form powders. Samples weighing between 6–14 mg were sealed in aluminum pans and heated once from 25 °C to +300 °C at a rate of 10 °C/min. Liquid N2 was used as the coolant.
Fe and Ce contents were determined using X-ray fluorescence measurements performed with a Zeiss Jena VRA-30 spectrometer equipped with a Mo anode, a LiF crystal analyzer, and a SZ detector. Analyses were based on the Fe and Ce Kα lines. A series of standards were prepared by mixing 1 g of polystyrene with 10–20 mg of standard compounds. The time of data acquisition was held at 10 s.
Optical microscopy was carried out with a Nikon Eclipse ME600 optical microscope with reflected and transmitted light.
UV-vis spectra were recorded on an Olis CARY-14 spectrometer in the range 200–800 nm.
X-ray diffraction patterns were collected on a Scintag X2 θ–θ diffractometer with a Cu Kα source (1.54 Å).
Images of the sample surfaces were obtained via Scanning Probe Microscopy (SPM) using a TriboIndenter® (Hysitron, Minneapolis, MN) with a cube corner diamond tip with a contact set-point of 2μN.
High-resolution and survey XPS scans were collected on a Kratos Axis Ultra spectrometer (Kratos Analytical, Manchester, UK). Monochromated Al Kα 1,2 1486.6 eV radiation was used as an excitation source. C 1s and N 1s spectra were collected at 20 eV pass energy. The C and O scans were taken using a channel width of 0.05 volt (50 meV), and the Fe, Ce and N were taken using a channel width of 0.1 volt (100 meV). Survey scans were performed using 160 eV pass energy and 0.5 eV channel width. All spectra were accumulated quickly and in fresh areas of the films to avoid artifacts due to beam damage. All binding energies (BE) were referenced to aliphatic C 1s at 284.9 eV. Measurements were carried out at least three times for each sample or position.
3. Results and Discussion
Before studying formation of lateral gradient films, we needed to establish the optimal composition of hybrid (polymer blend) films and the appropriate conditions for interaction of these films with metal ions. In order to accomplish that, we first studied the blending of PAA of two molecular weights with two copolymers of AA and AAm at different pH and then interaction of these blends with Fe(III) and Ce(IV) ions as described below in Sections 3.1 and 3.2. Formation of gradient films is described in Section 3.3.
3.1. Structure and Appearance of the Hybrid Films
3.1.1. Miscibility
The hybrid films #1–1 and #2–1 based on PAAm-PAA(10) and prepared without pH adjustment (pH 4.3 and 3.9, respectively, Table 1) are fully transparent indicating a lack of macroheterogeneities, i.e., good miscibility of the components. However, after interaction with metal ions the metal content in these films (from the XPS measurements) was negligible, most likely due to a low fraction of the ionized groups (note that pKa of PAA is 4.820). In order to increase the fraction of the carboxylate groups and to facilitate interaction with metal ions by electrostatic interaction, we adjusted the pH of the mixed solution to 6.5 (samples #1–2 and #2–2, Table 1). This, however, resulted in opaque films indicating that the components are not sufficiently miscible and phase separate, despite solutions being quite transparent. This was a surprising result considering that PAAm and PAA may complex due to hydrogen bonding, but the critical pH for this complexation in solutions is 3.0,21,22 which is much lower than the pH 6.5 reported here. Currently we cannot explain this puzzling result.
Alternatively, in the case of PAAm-PAA(70) (samples #3 and #4, Table 1) containing a high fraction of PAA, the hybrid films are fully transparent at all pH values, demonstrating good miscibility of the components of the blend. These observations are confirmed by the DSC data (see the Supporting Information, SI, Figure SI and discussion therein): for the hybrid film demonstrating good miscibility, the DSC profile is different from those of the components, while in the case of poor miscibility, the profile of the hybrid film rather repeats the DSC profile of the component(s).23,24 Because of better miscibility and a higher content of the carboxylate groups, interaction with metal ions (Section 2) and gradient film formation (Section 3) were studied with the hybrid films based on PAAm-PAA(70).
1.2. UV-vis spectroscopy, optical microscopy and XRD
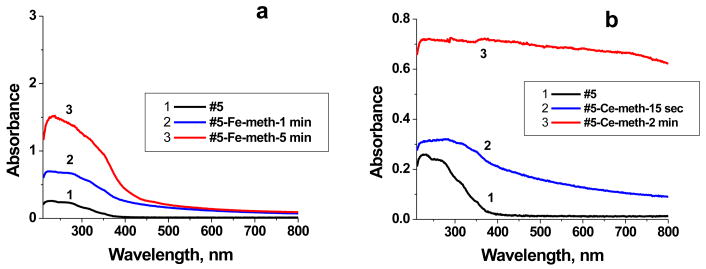
Figure 1 presents UV-vis spectra of the Fe- and Ce-containing films. One can see that the increase of the ion exchange time results in an increase of the optical absorbance (Fig. 1a) below 500 nm, indicating an increase of the Fe content in the film. The shape of the spectra resembles that of Fe oxide or hydroxide species.25,26 The ability of Fe species to form hydroxides or oxides is well-known.27 At pH 6.5 in the PAA/PAAm-PAA(70) polymer blend, Fe(OH)2+ and Fe(OH)3 species can initially form and then transform to FeO(OH).27 This is consistent with the UV-vis data.28 Incorporation of iron does not result in film turbidity, but the appearance strongly changes with ion exchange time. Alternatively, treatment of the #5 film with (NH4)2Ce(NO3)6 solution results in opaque bright yellow films, the opacity of which increases with time. The longer the ion exchange time of the films to the Ce salt solutions, the less transparent they become (Fig. 1b).
Figure 1.
UV-vis spectra of Fe- (a) and Ce-containing (b) films based on the #5 sample (Table 1).
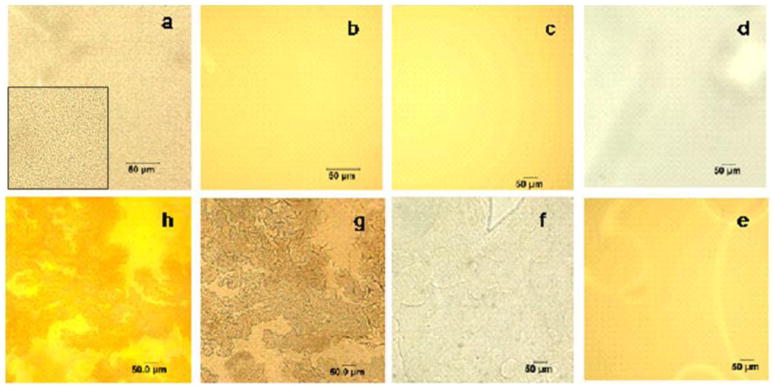
After only 15 sec ion exchange time to the Ce salt solution the hybrid film contains particles of 750 nm in diameter, as seen from the transmitted-light optical microscopy image presented in Figure 2a (see inset for a higher magnification image). At the same time, the reflected-light image of the same film shows equal coloring, and a uniform distribution of the reflecting species on the film surface (Fig. 2b), revealing that the particles are evenly dispersed on the film surface. We believe that the formation of comparatively large particles is the reason for the transparency loss. In the #5-Ce-meth-30sec sample the particle size is 1.2 μm.
Figure 2.
Optical microscopy images of #5-Ce-meth-15sec with transmitted (a) and reflected (b) light, #5-Ce-meth-2min (c, reflected light), #5-Fe-meth-1min with transmitted (d) and reflected (e) light, #5-Fe-meth-5min (f, transmitted light), and #5-Fe-meth-30min with transmitted (g) and reflected (h) light. Inset in (a) shows a higher magnification image. The scale bar is 50 μm.
The longer ion exchange time (2 min) to the (NH4)2Ce(NO3)6 solution leads to fully opaque film (see discussion above), the reflected-light image of which (Fig. 2c) shows a homogeneous distribution of the reflecting species as well. In this case, the particle size cannot be estimated because of the lack of transparency. Because Ce(IV) ions are easily hydrolyzed even in acidic solutions (~pH 2) (although they are also prone to formation of complexes retarding the hydrolysis), it is highly probable that they form multinuclear hydroxide species complexing with methanol (see discussion of XPS data in the SI).27 Considering the solubility product of CeO2, one can suggest that formation of CeO2 species is also possible.
For Fe-containing films, the 1 min ion exchange time with FeCl3×6H2O results in the fully transparent homogeneous film (Fig. 2d, e), while the 5 min ion exchange time leads to the slight, visible heterogeneity of the film (Fig. 2f). Further increase of the ion exchange time results in inhomogeneous film coloring probably due to uneven shrinkage across the film (Fig. 2g). We believe that this shrinkage is due to cross-linking of the film with Fe(III) ions The reflected-light image (Fig. 2h) also shows uneven coloring and the same pattern as the transmitted-light image due to a non-uniform distribution of the reflecting species on the film surface.
1.3. XRD
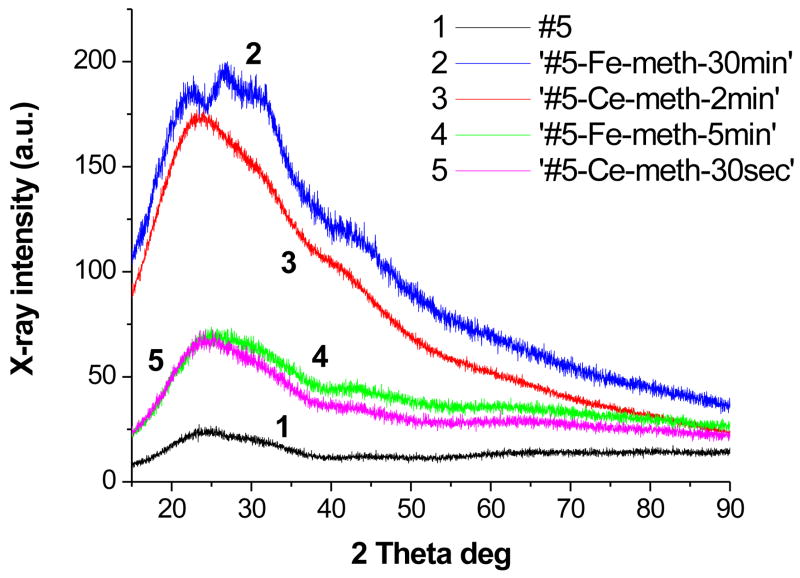
In order to estimate the phase composition of the Fe- and Ce-containing films, we recorded the XRD patterns of the ‘#5-Fe-meth-5min’, ‘#5-Fe-meth-30min’, ‘#5-Ce-meth-30sec’, and ‘#5-Ce-meth-2min’ films (Fig. 3). All the four samples display very broad amorphous halos in the whole two theta range, yet these patterns significantly differ from the more localized amorphous halo of the polymer blend. The increase of the intensity of the XRD patterns for the films obtained at longer ion exchange times corroborates formation of more organized phases. Moreover, appearance of the peaks at ~23 and 28 degrees in two theta in the diffraction pattern of ‘ #5-Fe-meth-30min’ confirms short-range order with d-spacing of 3.8 and 3.2 Å, respectively, which are consistent with α-FeO(OH) and β-FeO(OH).29 Since for the Ce-containing samples, the particles are large (at least 750 nm or larger), the absence of the diffraction peaks unambiguously confirms the amorphous character of the inorganic phase, although some short-range order with d-spacing of 3.6 Å is observed. In the case of the Fe-containing samples, the particles are not visible in the optical microscope so that the XRD patterns can be assigned to a mixture of the amorphous and very small crystalline particles (see peaks in the amorphous halo in ‘#5-Fe-meth-30min’).
Figure 3.
XRD profiles of the hybrid films based on #5 and containing Ce or Fe species.
2. Composition of the Hybrid Films by XPS
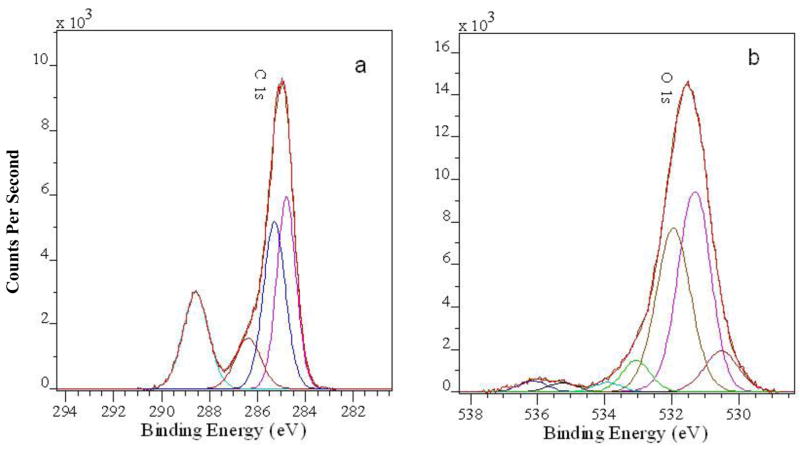
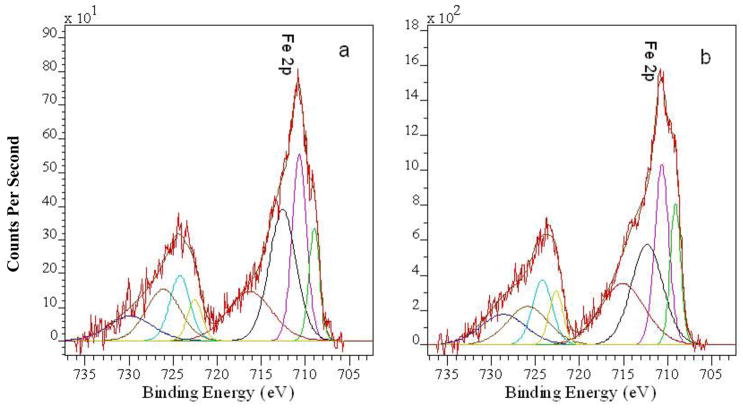
The high resolution XPS spectra in the C 1s and O 1s regions for the mixture of 15% of PAA-1 in PAAm-PAA(70) at pH 6.5 (#5, Table 1) are described in SI (Fig. S2). When Fe(III) ions are incorporated into the #5 film, the only noticeable change in the high resolution C 1s spectra of the Fe-containing samples (see #5-Fe-meth-1min in Fig. 4a) is disappearance of the COOH groups (peak at 289.3 eV). Since interaction with Fe(III) should occur easier with a carboxylate group, it causes the disappearance of the carboxylic acid groups. The O 1s spectra of the iron-containing films (see #5-Fe-meth-1min in Fig. 4b) also show a decrease in the intensity of the peak ascribed to OH of the carboxylic groups (around 532.5 eV) and appearance of a new peak at 530.5–530.8 eV (Fig. 5) which can be assigned to the Fe-O species. The increase of the intensity of this peak is consistent with the increase of the iron species in the films. The position of this peak can be due to oxide –O2− or hydroxide (OH) species. Unfortunately, the complexity of the broad O 1s peaks in these hybrid materials does not allow a more accurate assignment of this peak.
Figure 4.
High resolution XPS spectra of #5-Fe-meth-1min in C 1s (a) and O 1s (b) regions and their deconvolution curves.
Figure 5.
High resolution Fe 2p XPS spectra of #5-Fe-meth-1min (a) and #5-Fe-meth-5min and their deconvolution curves.
The iron contents obtained from the XPS data are shown in Table 2 while the high resolution Fe 2p XPS spectra are presented in Figure 5. The increase of the ion exchange time of the #5 film in the ferric chloride solution does not significantly influence the iron content. (Note that the XPS penetration depth is about 10 nm.) For the #5-Fe-meth-5min sample, this value is 6.3 wt.%, while the elemental analysis data obtained by X-ray fluorescence spectroscopy for this sample gives a value of 2.2 wt.% Fe content in the bulk film (Table 2), revealing surface enrichment with Fe species. Surface enrichment with modifying species compared with bulk content was also observed by others using XPS,30 although XPS in conjunction with X-ray fluorescence analysis is rarely applied.31
Use of a less polar solvent such as ethanol results in a lower Fe content on the film surface most likely due to a lower dissociation degree of the Fe salt in ethanol. One might think that the enrichment of the mixed polymer films with the PAA component (sample #6) should result in an increase of the surface metal content due to an increased fraction of carboxylate groups. However, the XPS data unambiguously show the opposite trend: The Fe content in the #5 films is consistently higher than that in the #6 films. We believe this is owing to burying the larger fraction of PAA within the film volume and the lower fraction of the carboxylate groups on the surface. Enrichment of a film/air interface with more hydrophobic species was reported by others for various polymer blends.32,33
The deconvolution of the high resolution Fe 2p spectra shows that in all cases both Fe(II) (Fe 2p3/2 peak at 709.0 eV) and Fe(III) (Fe 2p3/2 peak at 710.6 eV) are present. We think that methanol serves as a reducing agent for the Fe(III)-to-Fe(II) transition in the iron containing samples, with methanol transforming to oxidation products such as formaldehyde.34,35 Since practically no changes in the C 1s and O 1s spectra of the Fe-containing samples are observed (compared to those of the #5 film), we believe that these oxidation products are not incorporated in the metallated films. The quantification of the deconvoluted peaks shows the gradual increase of Fe(III)/Fe(II) ratio in the film with the increase of the ion exchange time. This may be due to the fact that ion exchange is fast, while the reduction rate is slow, leading to an increase of the Fe(III)/Fe(II) ratio with increased reaction time. When the film is dry, no further oxidation/reduction occurs: the XPS data do not show any changes for the samples examined the next day or a week after preparation.
Ion exchange of the #5 films with (NH4)2Ce(NO3)6 solutions results in sequestering the Ce ions into the films. Immediately after the treatment, the films are bright yellow indicating the presence of the Ce(IV) species. However, in 24 h the films become pale yellow and in three days under the air or next day in the XPS chamber (vacuum) the films turn white indicating transformation of Ce(IV) to Ce(III) (see details in the SI).
3. Gradient Films
Based on the above studies, in the gradient film formation PAAm-PAA(70) was used to provide good miscibility with PAA. However, when the free-standing gradient films were formed from the #5 and #6 solutions based on low molecular weight PAA-1, we observed formation of an “island” of PAA near the anode, indicating a phase separated heterogeneous distribution of the components due to excessive mobility of the short PAA molecules. After PAA-1 was replaced with PAA-2, no “island” formation was observed. However, because the free-standing films based on the #7 samples after interaction with metal ions were very brittle and difficult to handle (partially due to a higher fraction of the lower molecular weight component, PAA-2), the further free-standing film experiments were made with the #8 samples.
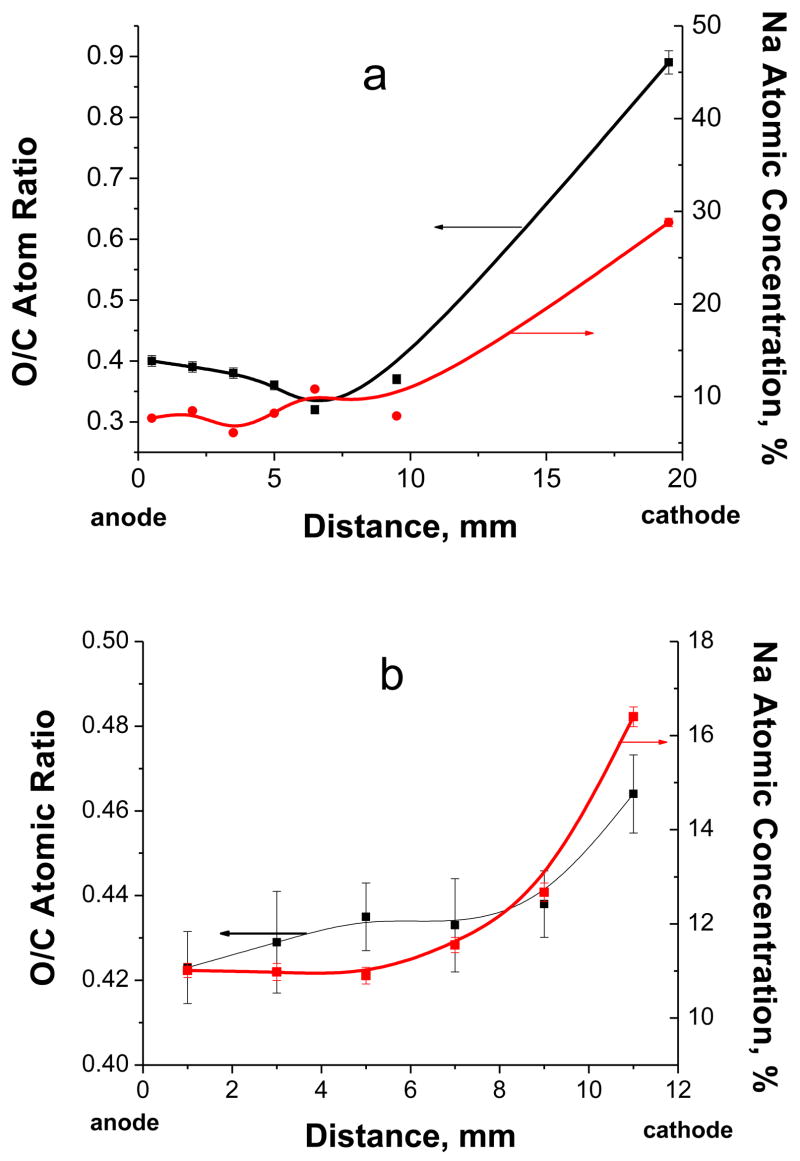
Figure 6 presents composition (extracted from XPS survey scans) of the free-standing film based on #8–1 (pH=8.0, Table 1) and made at 5 V(a) and 3V(b) for several positions between the anode and cathode. Larger potential differences between electrodes result in steeper variation of concentrations with distance. For 5V, the O/C atom ratios at the cathode and anode are 0.89 and 0.41, respectively. It should be noted that for PAA, the O/C atom ratio is 0.67 while for PAAm, it is 0.33. However, the very high content of sodium ions near the cathode (Na/O atom ratio is 0.85) indicates that most likely NaOH is formed during water electrolysis due to local increase of pH when H2 is produced at the cathode. In a similar experiment but carried out at 3 V (Fig. 8b), the O/C ratio near cathode and anode are 0.56 and 0.38, respectively, and the Na/O ratio near cathode is only 0.38 indicating that the majority of the functional species near the cathode should be –COONa, not NaOH. Apparently the lower voltage diminishes rate of electrolysis and decreases the fraction of NaOH formed.
Figure 6.
Dependences of O/C atomic ratio and overall Na contents on the distance from anode to cathode for free-standing films made at 5 V(a) and 3V(b).
Figure 8.
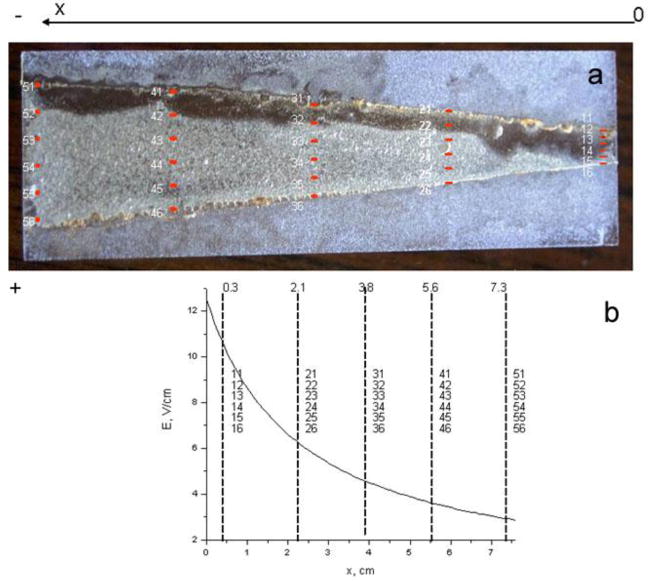
(a) Film appearance after reaction with FeCl3 with mapping of sample positions for XPS. (b) Electric field strength (E = V/d ) as function of distance X.
The free-standing films based on the #8 sample and reacted with Fe(III) ions were less brittle than those based on #7, but still they were easily broken which can be attributed to uneven crosslinking of the film surface creating film stress. Thus, for more sophisticated experiments with a gradient electrochemical potential and for further interactions with metal ions, we used thin films (from #7–2, Table 1) supported on etched glass slides at different applied electric fields.
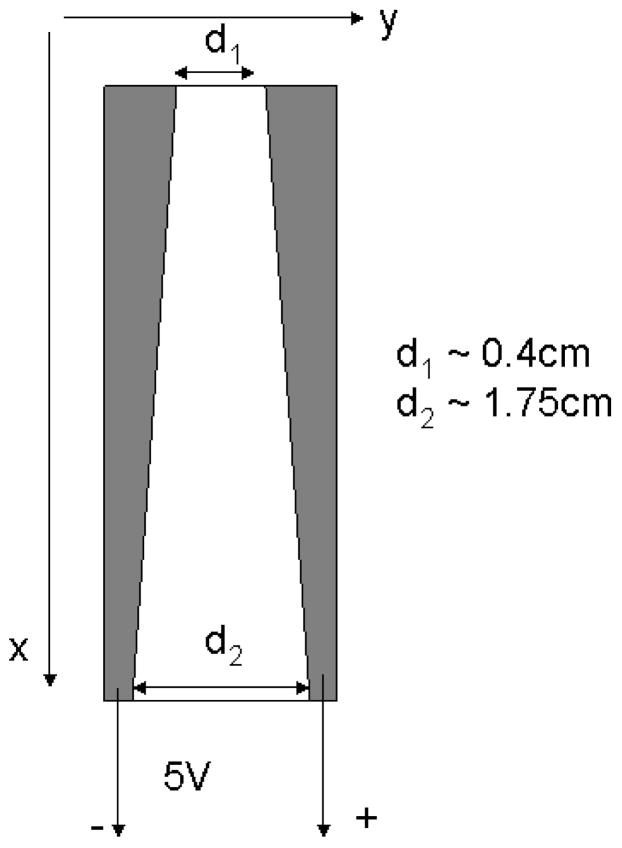
The concentration gradient distribution is a result of competition between ionic group migration, governed by the electric field of strength E, and the diffusion process. Since strength of the electric field is determined as E = V/d, both potential difference V and distance between electrodes d determine electric field strength and can control concentration gradient distribution in the films. In order to study the dependence of the concentration gradient profile on the distance between electrodes, while keeping the potential difference the same, we prepared a thin film sample of a trapezoid shape (Fig.7). Electrodes, made of platinum loaded carbon cloth (ELAT, product of E-TEK Division, BASF) were positioned at the angle of 10 degrees to the long side of substrate, as shown on Figure 7. In such an arrangement, a potential difference applied between electrodes results in different electric field strength along the sample: in higher magnitude (3.5 times for the chosen geometry) at the end of the sample, where the distance between electrodes is shorter (d1), and in lower magnitude at the end, where the distance is larger (d2). The electric field profile along the sample is shown in Figure 8b as a function of a distance.
Figure 7.
Schematic representation of electrode arrangement. Electrodes are colored in grey. The film is between the electrodes and is colored in white. The value d1 is the distance between electrodes at one end and d2 is the distance at the other end. Polarity of the applied voltage and the chosen coordinate system are also shown.
The #7–2 film prepared using the setup shown in Figure 7 and reacted with FeCl3 solution for 1 min is presented in Figure 8a. The darker area along cathode is believed to be due to NaOH deposition.
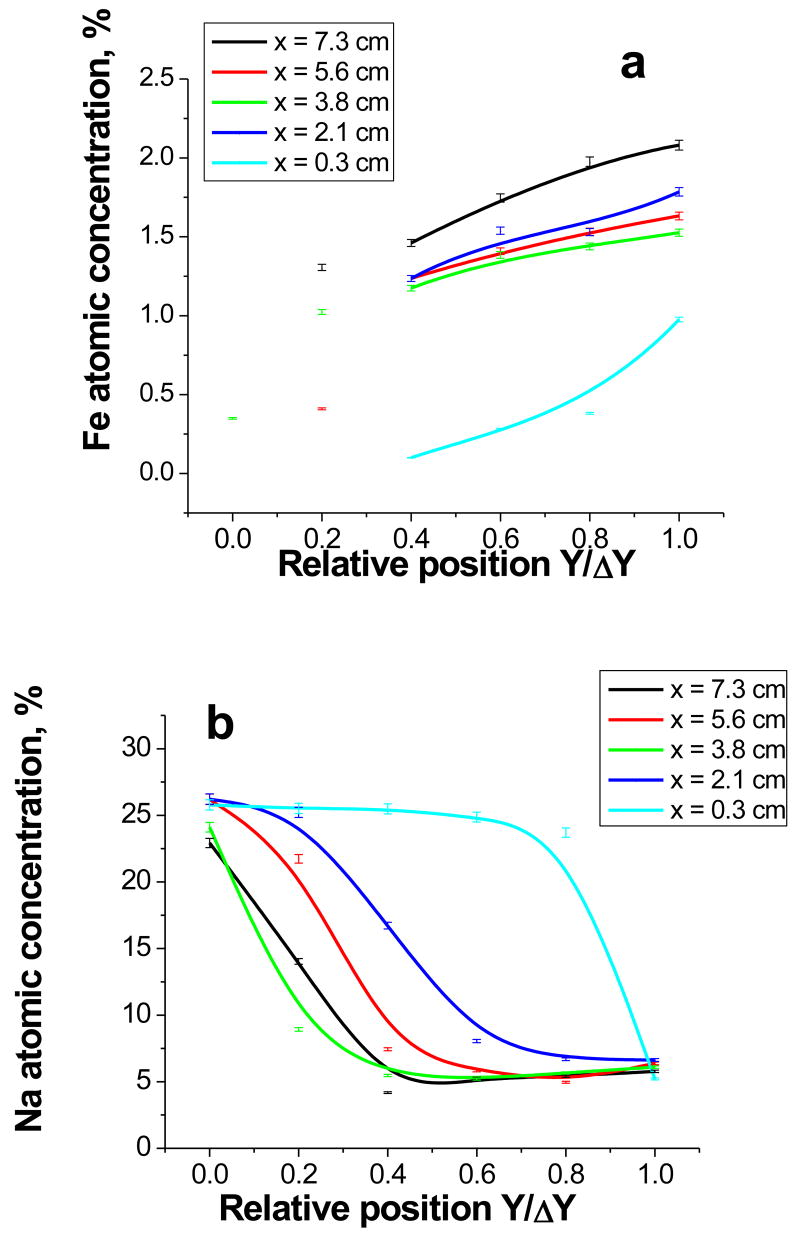
From Figure 9 one can see that for all series there is a gradient in the Fe content suggesting a gradient in the carboxylic group functionality between electrodes. Steeper Fe content concentration variation with the distance is achieved for the sample prepared at higher electric field, as expected. We believe that the low Fe atomic concentration in the vicinity of the anode is due to high Na content (Fig. 9b) (due to water electrolysis and formation of NaOH, see above) and these data points do not reflect a gradient in polymer functionality. The concentrations, measured for X = 0.3 cm should not be trusted as well, as intense NaOH formation masks the functionality gradient. In contrast, concentrations measured at higher X demonstrate a stable gradient in the Fe content. Moreover, a similar gradient is observed for the different electric fields studied.
Figure 9.
Dependences of Fe (a) and Na (b) atomic concentration on the relative position Y/δY (where Y is the distance from anode to the measurement point coordinate and δY is the distance between anode and cathode) for thin supported films in five different distances X indicated in the Figure legends and corresponding to different electric field strength.
Unlike Fe-containing samples, the Ce-containing films do not show any consistent dependence of the Ce content on the position between cathode and anode (see Fig. S6, SI), most likely due to formation of large Ce oxide particles which mask the gradient of polymer functionality in Ce-containing films.
To estimate mechanical properties of supported films, we used nanoindentation on supported films without a gradient (see SI, Table 1 and discussion therein). The hardness and stiffness (modulus) of the hybrid supported films before and after interaction with metal ions are comparable to or higher than those of a number of other polymers or hybrid materials.36–39 Although both hardness and stiffness increase after incorporation of the metal species, the control experiment of the hybrid film exposure to methanol shows an even higher increase of these parameters, revealing that the methanol influence overrides the influence of complexation on film mechanical properties. Based on this finding, no mechanical testing on gradient films was carried out.
Conclusions
Here we demonstrate the proof of concept and limitations for the formation of lateral composition gradient films based on the polyelectrolyte blends (PAA and PAA-AM). The electric field, applied during sample preparation, was used as a driving force to prepare free-standing and thin supported gradient films. We found that the homogeneous gradient films can be obtained using 15,000 Da PAA and PAA-AM copolymer containing 70% of AA units, while for non-gradient hybrid films, 2,000 Da PAA can also be used. The duration of the ion exchange of the films with metal salt solution was found to influence mainly the bulk metal content, while the surface layer is rapidly saturated with metal species. Enhancing electric field strength by either increasing the potential difference or decreasing the distance between electrodes leads to the formation of a steeper concentration vs. distance profile. Free-standing gradient films demonstrate a lateral gradient in C/O ratio, suggesting the gradient in the COONa group content, however, these films are too brittle after interaction with metal ions. Thin supported films are structurally robust and after complexation with the Fe salt they demonstrate a gradient in Fe concentration, indicative of a gradient in carboxylate group content. Upon complexation with Ce, large Ce oxide particles (≥750 nm) were formed, masking the gradient of polymer functionality in Ce-containing films.
Supplementary Material
DSC, XPS, and nanoindentation data. This material is available free of charge via the Internet at http://pubs.acs.org.
Acknowledgments
The authors thank Public Health Service/NIH R01 DE 014572 for financial support of this work. This work made also use of MRL Central Facilities supported by the MRSEC Program of the National Science Foundation under award No. DMR05-20415.
References
- 1.Qin XX, Waite JH. Proc Nat Acad Sci. 1998;95:10517–10522. doi: 10.1073/pnas.95.18.10517. [DOI] [PMC free article] [PubMed] [Google Scholar]
- 2.Waite JH, Lichtenegger HC, Stucky GD, Hansma P. Biochemistry. 2004;43:7653–7662. doi: 10.1021/bi049380h. [DOI] [PMC free article] [PubMed] [Google Scholar]
- 3.Sun CJ, Waite JH. J Bilog Chem. 2005;280:39332–39336. doi: 10.1074/jbc.M508674200. [DOI] [PubMed] [Google Scholar]
- 4.Zaslansky P, Friesem AA, Weiner S. J Struct Biol. 2006;153:188–199. doi: 10.1016/j.jsb.2005.10.010. [DOI] [PubMed] [Google Scholar]
- 5.Kieback B, Neubrand A, Riedel H. Mater Sci Eng A. 2003;A362:81–106. [Google Scholar]
- 6.Li S, Zhou Y, Duan H, Qiu J, Zhang Y. J Mater Sci. 2003;38:4065–4070. [Google Scholar]
- 7.Lis J, Kata D, Chlubny L, Lopacinski M, Zientara D. Annales de Chimie. 2003;28:S115–S122. [Google Scholar]
- 8.Chung TJ, Neubrand A, Rodel J. Key Eng Mater. 2002;206–213:965–968. [Google Scholar]
- 9.Suresh S. Science. 2001;292:2447–2451. doi: 10.1126/science.1059716. [DOI] [PubMed] [Google Scholar]
- 10.Kryszewski M. Polym Adv Technol. 1998;9:244–259. [Google Scholar]
- 11.Qin S, Saget J, Pyun J, Jia S, Kowalewski T, Matyjaszewski K. Macromolecules. 2003;36:8969–8977. [Google Scholar]
- 12.Hotta A, Diamanti S, Khanna V, Bazan GC, Fredrickson GH, Kramer EJ. Polym Preprints. 2005;46:1084–1085. [Google Scholar]
- 13.Shi Y, Tan M, Jiang X. J Mater Res. 2002;17:1241–1243. [Google Scholar]
- 14.Volz K, Kiuchi M, Okumura M, Ensinger W. Surf Coat Techn. 2000;128–129:274–279. [Google Scholar]
- 15.Yamamoto K, Keunecke M, Bewilogua K. Thin Solid Films. 2000;377–378:331–339. [Google Scholar]
- 16.Schuermann U, Hartung W, Takele H, Zaporojtchenko V, Faupel F. Nanotechnology. 2005;16:1078–1082. [Google Scholar]
- 17.Wang X, Bohn PW. J Amer Chem Soc. 2004;126:6825–6832. doi: 10.1021/ja0400436. [DOI] [PubMed] [Google Scholar]
- 18.Wang X, Haasch RT, Bohn PW. Langmuir. 2005;21:8452–8459. doi: 10.1021/la0580053. [DOI] [PubMed] [Google Scholar]
- 19.Wang X, Tu H, Braun PV, Bohn PW. Langmuir. 2006;22:817–823. doi: 10.1021/la052741p. [DOI] [PubMed] [Google Scholar]
- 20.Arguelles-Monal W, Peniche-Covas C. Makromol Chemie, Rapid Comm. 1988;9:693–697. [Google Scholar]
- 21.Mun GA, Nurkeeva ZS, Khutoryanskiy VV, Sarybayeva GS, Dubolazov AV. Eur Polym J. 2003;39:1687–1691. [Google Scholar]
- 22.Khutoryanskiy VV, Mun GA, Nurkeeva ZS, Dubolazov AV. Polym Int. 2004;53:1382–1387. [Google Scholar]
- 23.Kaczmarek H, Szalla A. J Photochem Photobiol A. 2006;180:46–53. [Google Scholar]
- 24.Guo Q, Wang K, Chen L, Zheng S, Halley PJ. J Polym Sci B. 2006;44:975–985. [Google Scholar]
- 25.Kustrowski P, Chmielarz L, Surman J, Bidzinska E, Dziembaj R, Cool P, Vansant E. J Phys Chem A. 2005;109:9808–9815. doi: 10.1021/jp0535442. [DOI] [PubMed] [Google Scholar]
- 26.Perera WN, Hefter G. Inorg Chem. 2003;42:5917–5923. doi: 10.1021/ic034087b. [DOI] [PubMed] [Google Scholar]
- 27.Baes CF, Jr, Mesmer RE. The Hydrolysis of Cations. Wiley-Interscience; New York, N. Y: 1976. [Google Scholar]
- 28.Li S, Zhang H, Wu J, Ma X, Yang D. Crystal Growth & Design. 2006;6:351–353. [Google Scholar]
- 29.Walker JD, Tannenbaum R. Chem Mater. 2006;18:4793–4801. [Google Scholar]
- 30.Bretos I, Jimenez R, Rodriguez-Castellon E, Garcia-Lopez J, Calzada ML. Chem Mater. 2008;20:1443–1450. [Google Scholar]
- 31.Gros-Jean M, Herino R, Lincot D. J Electrochem Soc. 1998;145:2448–2452. [Google Scholar]
- 32.Amalvy JI, Percy MJ, Armes SP, Wiese H. Langmuir. 2001;17:4770–4778. [Google Scholar]
- 33.Borkar S, Sen A, Shallenberger JR. J Polym Sci A. 2006;44:1225–1232. [Google Scholar]
- 34.Novakova J, Jiru P, Zavadil V. J Catal. 1971;21:143–148. [Google Scholar]
- 35.Reichgott DW, Rose NJ. J Amer Chem Soc. 1977;99:1813–1818. [Google Scholar]
- 36.Tekin E, Egbe DAM, Kranenburg JM, Ulbricht C, Rathgeber S, Birckner E, Rehmann N, Meerholz K, Schubert US. Chem Mater. 2008;20:2727–2735. [Google Scholar]
- 37.Ferchichi A, Calas-Etienne S, Smaihi M, Etienne P. J Non-Cryst Solids. 2008;354:712–716. [Google Scholar]
- 38.Xiang Y, Chen X, Tsui TY, Jang JI, Vlassak JJ. J Mater Res. 2006;21:386–395. [Google Scholar]
- 39.Ni H, Li X, Gao H, Nguyen TP. Nanotechnology. 2005;16:1746–1753. [Google Scholar]
Associated Data
This section collects any data citations, data availability statements, or supplementary materials included in this article.
Supplementary Materials
DSC, XPS, and nanoindentation data. This material is available free of charge via the Internet at http://pubs.acs.org.


