

Abstract
ZnuA is the periplasmic Zn2+-binding protein associated with the high-affinity ATP-binding cassette ZnuABC transporter from Escherichia coli. Although several structures of ZnuA and its homologs have been determined, details regarding metal ion stoichiometry, affinity, and specificity as well as the mechanism of metal uptake and transfer remain unclear. The crystal structures of E. coli ZnuA (Eco-ZnuA) in the apo, Zn2+-bound, and Co2+-bound forms have been determined. ZnZnuA binds at least two metal ions. The first, observed previously in other structures, is coordinated tetrahedrally by Glu59, His60, His143, and His207. Replacement of Zn2+ with Co2+ results in almost identical coordination geometry at this site. The second metal binding site involves His224 and several yet to be identified residues from the His-rich loop that is unique to Zn2+ periplasmic metal binding receptors. Electron paramagnetic resonance and X-ray absorption spectroscopic data on CoZnuA provide additional insight into possible residues involved in this second site. The second site is also detected by metal analysis and circular dichroism (CD) titrations. Eco-ZnuA binds Zn2+ (estimated Kd < 20 nM), Co2+, Ni2+, Cu2+, Cu+, and Cd2+, but not Mn2+. Finally, conformational changes upon metal binding observed in the crystal structures together with fluorescence and CD data indicate that only Zn2+ substantially stabilizes ZnuA and might facilitate recognition of ZnuB and subsequent metal transfer.
Keywords: ZnuA, Zinc-specific uptake system, Zinc binding, ATP binding cassette transporter
Introduction
Zinc serves as an essential cofactor for many enzymes involved in diverse biological processes but can be toxic at high concentrations. Cells regulate the uptake, distribution, and excretion of zinc through several systems, including the Zn2+-specific uptake system (Znu). Znu, first identified in Escherichia coli, belongs to the ATP-binding cassette (ABC) transporter family [1, 2]. Expressed under low extracellular zinc concentrations in both prokaryotes and eukaryotes, ZnuABC includes three components: the ZnuA periplasmic Zn2+-binding protein, the ZnuB integral membrane transporter responsible for Zn2+ transport across the cytoplasmic membrane, and the ZnuC ATPase that couples ATP hydrolysis to the transport process. In E. coli, cells with mutations in the genes encoding ZnuA and ZnuB exhibit a growth defect when grown on Zn2+-depleted medium, which is compensated by the addition of Zn2+. In addition, these cells are unable to take up 65Zn2+ [3]. Mutants deficient in the expression of ZnuABC in pathogens such as Hemophilus influenzae and Brucella abortus exhibit decreased virulence as well as retarded transformation and growth rates [4, 5]. Thus, ZnuABC might play an important role in bacterial survival during host infection.
The extended family of bacterial periplasmic ligand-binding proteins (PLBPs) is divided into nine clusters on the basis of sequence homology and ligand identity. The ZnuA protein from E. coli (Eco-ZnuA) together with 47 other putative metal-binding receptors (MBRs) belongs to the newly defined cluster 9. This cluster comprises two MBR families with primary specificities for Zn2+ and Mn2+ [6]. PLBPs from other clusters transport ions, amino acids, oligopeptides, and sugars. Fourteen MBRs that belong to the proposed Zn2+-binding subcluster contain a charged loop rich in acidic and His residues (His-rich loop), located near the metal binding site in the Synechocystis PCC sp. 6803 ZnuA (Syn-ZnuA) crystal structure [7]. This loop, which is not found in the Mn2+-specific MBRs, is proposed to play a role in periplasmic metal acquisition [7], in regulation of the ABC permease activity through zinc sensing [8], and/or in ZnuA/ZnuB interactions [6]. There are limited experimental data to support these hypotheses, however. Notably, a number of Zn2+/Cd2+ P1B-type ATPases such as E. coli ZntA and Anabaena PCC sp. 7120 AztA [9] contain a similar loop, implying a common role for this motif in Zn2+ transport.
Metal-bound structures of Syn-ZnuA [7], Streptococcus pneumoniae PsaA (Spn-PsaA) [10], Treponema pallidum TroA (Tpa-TroA) [11], Synechocystis PCC sp. 6803 MntC (Syn-MntC) [12], and Eco-ZnuA [13, 14] as well as the metal-free (apo) structures of Tpa-TroA [15] and mutant Syn-ZnuA (without the His-rich loop) [8] have been determined by X-ray crystallography. The overall architecture of these MBRs is similar to that of other PLBPs from ABC transporter systems. A substrate binding cleft is located between two domains connected by a flexible hinge region. PLBPs are proposed to function by a “Venus-flytrap” mechanism with an open, solvent-accessible ligand-free state and a closed ligand-bound state that are in kinetic equilibrium. Binding of the substrate shifts the equilibrium toward the closed conformation [16–18]. In the cluster 9 MBRs, the hinge region is replaced by a long α-helix that restricts domain motion upon metal exchange. In principle, this α-helix could function as a hinge since only a slight conformational change might be required for the binding of a zinc ion. The structural characterization of apo Tpa-TroA reveals a more closed structure than the Zn2+-loaded form, however, with two loops at the C-terminus collapsed into the Zn2+-binding pocket, reducing its volume twofold [15]. On the basis of this structure, apo Tpa-TroA was proposed to adopt two states, a nonpermissive form that prevents binding of Zn2+ and a hydrated form that is geometrically poised for Zn2+ coordination. It is unclear whether this mechanism might be generally applicable to metal binding by all cluster 9 MBRs.
Despite the availability of crystallographic data, detailed biochemical characterization of cluster 9 MBRs has not been reported. Although the structures of Spn-PsaA [10] and Tpa-TroA [11] both contain Zn2+, the physiological ligand for these proteins is likely Mn2+ [2]. The in vitro metal binding affinities of Tpa-TroA for Zn2+ and Mn2+ are similar, with Kd values of 1.27 and 0.95 μM, respectively [19]; that of Syn-ZnuA is substantially higher, approximately 10 nM [8]. Metal binding affinities of other MBRs have not been measured. The stoichiometry of metal binding is also unresolved. For example, H. influenzae Pzp1 (Hin-Pzp1) can bind up to five Zn2+ ions per molecule [4] and Syn-ZnuA up to eight, whereas the various crystal structures only show one metal binding site. To extend our understanding of metal binding and transport by and specificity of cluster 9 MBRs, we have determined the crystal structures of the apo, Zn2+-loaded, and Co2+-loaded forms of Eco-ZnuA and have characterized its metal binding properties by circular dichroism (CD), optical, electron paramagnetic resonance (EPR), and X-ray absorption spectroscopies. We have also investigated the effect of Zn2+ binding on Eco-ZnuA stability and have estimated its Zn2+ binding affinity.
Materials and methods
Cloning, expression, and purification of Eco-ZnuA
The E. coli znuA gene was amplified from genomic DNA (strain W3110) using the forward primer 5′-AAAAAAACATATGTTACATAAAAAAACGCTT-3′ and the reverse primer 5′-AAAAAGCTTAATCTCCTTTCAGGCAGC-3′, which introduce unique NdeI and HindIII restriction sites flanking the znuA gene. The 930-bp PCR product was digested with NdeI and HindIII and ligated into the pET26b vector (Novagen). The correct sequence was confirmed by DNA sequencing. The plasmid was then transformed into E. coli BL21(DE3) cells.
The transformants were cultured at 310 K to an optical density at 600 nm of 0.8–1.0 in Luria–Bertani medium supplemented with 25 μg mL−1 kanamycin, and protein production was induced with 0.25 mM isopropyl-β-d-thiogalactopyranoside. Cells were harvested 3 h after induction by centrifugation for 15 min at 8,000g, resuspended in 40 mL of cold 30 mM tris(hydroxymethyl) aminomethane (Tris), pH 7.0, containing 1 mM EDTA and 1 mM phenylmethylsulfonyl fluoride, and lysed by passage through a French press three times at 18,000 lb in−2. Cell debris was removed by centrifugation at 125,000g for 25 min, and the supernatant was applied to a Q-Sepharose column (16 × 20 mm) preequilibrated with 30 mM Tris, pH 7.0. Eco-ZnuA was eluted with a linear gradient at approximately 200–400 mM NaCl. Fractions containing Eco-ZnuA were concentrated and treated with 10 mM EDTA for 2 h or more. EDTA and protein impurities were removed by gel filtration on a Superdex 75 column (HiLoad 16/60 prep grade, Pharmacia). The absence of metal in apoZnuA was confirmed by inductively coupled plasma atomic emission spectroscopy (ICP-AES; Varian). To prepare metallated ZnuA for crystallization, apo protein was treated with 0.5 mM zinc acetate (ZnZnuA) or 0.5 mM cobalt(II) chloride (CoZnuA). Excess metal was removed on a Superdex 75 column or by extensive dialysis. The protein concentration was determined using an extinction coefficient at 280 nm of 24,750 M−1 cm−1 obtained by amino acid analysis. CoZnuA was light pink in color.
Eco-ZnuA crystallization and structure determination
The purified proteins were concentrated to 2.5–10 mg mL−1 and exchanged into 20 mM 3-(N-morpholino)propanesulfonic acid (MOPS), pH 7.0 containing 20 mM NaCl and 5% glycerol. Eco-ZnuA was crystallized using both hanging-drop and sitting-drop vapor diffusion methods. ZnZnuA crystallized in two different crystal forms. ZnZnuA crystals belonging to the space group P212121 (form I) were obtained at 293 K from a precipitant solution containing 30% (w/v) poly(ethylene glycol) (PEG) 4000, 5% 2-propanol, 0.1 M succinate, pH 4.9, mixed 1:1 with 10 mg mL−1 ZnZnuA or 1:2 with 2.5 mg mL−1 ZnZnuA. Block-shaped crystals with average dimensions of 0.05 × 0.1 × 0.2 mm3 appeared after 4 h and grew for the next 3 days. For data collection, crystals were transferred to a cryosolution containing 25% (w/v) PEG 4000, 3.5% 2-propanol, 0.1 M N-(2-hydroxyethyl)piperazine-N′-ethanesulfonic acid (HEPES), pH 7.5, 15% glycerol and were flash-cooled in liquid nitrogen. ZnZnuA crystals that belong to the space group C2 (form II) grew from 30% (w/v) PEG 4000, 5% 2-propanol, 0.1 M HEPES, pH 7.5 and were flash-cooled using the same cryoprotectant. For crystallization of apoZnuA, 5 mg mL−1 protein in 20 mM MOPS, pH 7.0, 5 mM EDTA, 20 mM NaCl, 5% glycerol was mixed 1:1 with a cryoprotectant solution containing 35.5% (w/v) PEG 4000, 0.2 M ammonium acetate, 9% glycerol, 0.1 M sodium acetate, pH 4.6. These crystals belong to the space group P212121. Finally, 7.25 mg mL−1 CoZnuA in buffer H (50 mM HEPES, pH 7.5, 200 mM NaCl) was mixed 1:1 with 25% (w/v) PEG 4000, 3.5% 2-propanol, 0.1 M HEPES, pH 7.5. Light pink crystals of CoZnuA belonging to the space group P21212 were obtained and were flash-cooled using the same cryoprotectant as mentioned above.
Data sets were collected at 100 K at the Advanced Photon Source (Argonne National Laboratory) beamlines 5ID, 19ID, and 23ID, which are operated by DND-CAT, SBC-CAT, and GM/CA-CAT, respectively. X-ray fluorescence was used to verify the presence of zinc in ZnZnuA and cobalt in CoZnuA as well as the absence of metals in apoZnuA. All data were integrated using HKL2000 and scaled with SCALEPACK [20]. Each crystal form contains two molecules in the asymmetric unit. The initial phases were determined by single anomalous dispersion using data collected on crystal form I at a wavelength of 1.2828 Å (Table 1) in 10° segments by the inverse beam technique. Two zinc positions were identified with SHELX [21] and HySS [22], and were refined using SHARP [23]. Solvent flattening yielded an excellent map into which most of the protein was automatically modeled using ARP/wARP [24].
Table 1.
Crystallographic statistics
| Data collection | ApoZnuA | ZnZnuA (form I) | ZnZnuA (form II) | CoZnuA |
|---|---|---|---|---|
| Wavelength (Å) | 0.9793 | 1.2828 | 0.9792 | 0.9793 |
| Resolution range (Å) | 60.00–2.45 (2.54–2.45) | 45.00–2.00 (2.07–2.00) | 86.00–1.70 (1.76–1.70) | 50.00–2.15 (2.23–2.15) |
| Space group | P212121 | P212121 | C2 | P21212 |
| Unit cell | a = 68.88 | a = 73.44 | a = 91.38 | a = 91.07 |
| b = 89.84 | b = 86.27 | b = 78.07 | b = 78.02 | |
| c = 91.56 | c = 88.15 | c = 86.37 | c = 85.89 | |
| β = 91.37° | ||||
| Total reflections | 136,143 | 262,168 | 235,145 | 210,028 |
| Unique reflections | 20,560 | 38,461 | 64,618 | 32,326 |
| Completeness (%)a | 98.7 (90.4) | 99.8 (98.4) | 97.2 (85.5) | 95.4 (78.6) |
| Redundancya | 6.6 (4.4) | 6.8 (5.8) | 3.6 (3.1) | 6.5 (4.7) |
| % > 3σ(I)a | 81.0 (48.9) | 81.0 (49.3) | 77.8 (44.7) | 70.1 (48.3) |
| Rsyma,b | 0.084 (0.300) | 0.082 (0.289) | 0.053 (0.323) | 0.086 (0.371) |
| Refinement | ||||
| Rwork (%)c | 23.96 | 19.88 | 21.30 | 23.51 |
| Rfree (%)d | 30.25 | 25.00 | 25.05 | 29.60 |
| Molecules in a.u. | 2 | 2 | 2 | 2 |
| Total atoms | 4,115 | 4,489 | 4,616 | 4,368 |
| RMS deviation from ideality | ||||
| Bond distance (Å) | 0.011 | 0.009 | 0.009 | 0.010 |
| Angle (°) | 1.341 | 1.188 | 1.220 | 1.267 |
| Average B factor | 58.3 | 28.9 | 32.5 | 39.4 |
| Main chain (Å2) | 57.9 | 27.3 | 30.8 | 38.7 |
| Side chain (Å2) | 58.8 | 28.8 | 32.4 | 39.5 |
| Solvent (Å2) | 55.9 | 37.9 | 40.8 | 43.9 |
| Metal ion (Å2) | – | 35.9 | 29.1 | 33.3 |
| RMS ΔB main chain bond (Å2) | 0.53 | 0.51 | 0.57 | 0.53 |
| RMS ΔB side chain bond (Å2) | 0.98 | 1.23 | 1.30 | 1.11 |
a.u. asymmetric unit
Values in parentheses refer to the highest-resolution shell
Rsym = Σ|Iobs − Iav|/ΣFobs, where the summation is over all reflections
Rwork = Σ|Fobs − Fcalc|/ΣFobs
For calculation of Rfree, 5% of the reflections were reserved
Model refinement
The initial model of ZnZnuA form I was built using XtalView [25] and Coot-0.1 [26]. Refinement of the structure was initiated with CNS [27] and completed with Refmac5 [28]. The two ZnZnuA molecules in the form I asymmetric unit are designated molecules A and B. The side chains of residues Asn74, Glu164 and Asn228 in molecule A and of Gln90, Glu181, and Ser186 in molecule B were visible in two conformations, which were modeled appropriately at half occupancy. Two metal sites were identified in each molecule by strong peaks in the anomalous difference Fourier and Fo − Fc difference maps. The main zinc site was fully occupied, whereas the second zinc site was refined to an occupancy of 0.35 in each molecule. The His-rich loop, residues 117–137, is disordered in the crystal and was partially modeled. The final form I ZnZ-nuA model consists of residues 27–117 and 138–310 for molecule A and residues 27–118 and 139–309 for molecule B, four zinc ions, and 394 water molecules. A Ramachandran plot calculated with PROCHECK [29] indicates that 93.6% of the residues are within the most favorable regions, with the remainder in additionally allowed regions.
The structures of ZnZnuA form II, CoZnuA, and apoZnuA were solved by molecular replacement with Phaser [30] using ZnZnuA form I without metal as a search model. The two molecules in the asymmetric unit are assigned as molecules C and D for ZnZnuA form II, molecules E and F for CoZnuA, and molecules G and H for apoZnuA. The final model of ZnZnuA form II includes residues 27–116 and 138–310 for molecule C and residues 27–118 and 139–310 for molecule D, three zinc ions, 444 water molecules, and one molecule of 2-propanol. Two zinc sites were identified in molecule C (occupancies of 1.0 and 0.35) and one fully occupied metal site was identified in molecule D. Residues Val69, Ser186, Val273, Met275, Asn284, Ile285, and Lys286 from molecule C and residues Gln101, Arg152, Glu164, Gln183, Thr220, Val253, Met275, and Leu299 from molecule D were modeled in two conformations, each at half occupancy. A Ramachandran plot calculated with PROCHECK [29] shows that 94.0% of the residues are within the most favorable regions, with 5.8% in additionally allowed regions and 0.2% in generously allowed regions.
The final model of CoZnuA consists of residues 27–118 and 139–309 for molecule E and residues 27–120 and 139–309 for molecule F, two cobalt ions, and 291 water molecules. One cobalt site was identified in each molecule. The side chains of residues Gln258 and Lys286 from molecule E were modeled in two half-occupied conformations. A Ramachandran plot shows that 93.2% of residues are within the most favorable regions, with the remainder in additionally allowed regions and one amino acid in the disallowed region. The final model of apoZnuA consists of residues 27–117 and 137–310 for molecule G and residues 27–117 and 138–310 for molecule H, and 49 water molecules. A Ramachandran analysis calculated with PROCHECK [29] indicates that 89.4% of the residues are within the most favorable regions, 10.4% in additional allowed regions, and 0.2% in generously allowed regions. RMS deviations (RMSD) for superposition of different structures were calculated with LSQMAN [31] using the brute force function (fragment length 10, fragment function 2). The coordinates of Eco-ZnuA have been deposited in the Protein Data Bank (PDB) with accession codes 2PS0, 2PRS, 2PS9, and 2PS3 for ZnZnuA form I, ZnZnuA form II, CoZnuA, and apoZnuA, respectively.
Sample preparation for spectroscopic studies
All buffers and water were treated with Chelex 100 and tested for metal impurities by ICP-AES. Before each set of experiments, Eco-ZnuA protein samples were incubated with 10 mM EDTA on ice for more than 2 h followed by removal of EDTA via gel filtration chromatography on a Superdex 75 column or multiple rounds of dilution/concentration. The metal content of samples treated in this way was below the detection limit of ICP-AES. Glassware was soaked for more than 24 h with trace metal grade sulfuric acid and thoroughly rinsed with Chelex-treated water. Between measurements, cuvettes were soaked in 0.2 M EDTA for 10–30 min or in trace metal grade sulfuric acid overnight to prevent metal cross-contamination.
CD spectroscopy
For CD experiments, apoZnuA was exchanged into 20 mM potassium phosphate, pH 7.5, 20 mM NaF buffer and adjusted to approximately 5 μM final protein concentration. CD spectra were recorded for apoZnuA alone and in the presence of various metal ions (Zn2+, Mn2+, Cd2+, and Co2+) at room temperature using a JASCO J-715 spectropolarimeter with a 10-nm band width, 50 nm min−1 scan speed, and 1-nm step in a 0.2-cm cell. All spectra were corrected for a buffer background absorbance and converted to mean residue ellipticity. Thermal denaturation of 1.4 μM ZnuA in the apo form and in the presence of 10 μM Zn2+, Cu2+, Cu+, Ni2+, Co2+, and Mn2+ was followed by monitoring the CD absorbance at 222 nm (far-UV) in 20 mM potassium phosphate, pH 7.5, 20 mM NaF buffer in a 1-cm cell. The spectropolarimeter was equipped with a Peltier heating unit (single, RTEon). The accuracy of the internal temperature probe was ±0.2 K, and the heating rate was 1 K min−1 in the temperature range 285–363 K. CD spectra were collected between 190 and 280 nm before and after the temperature scan to determine the reversibility of the denaturation process. In most cases, 90% or more of the protein remained folded after the temperature scan. The data analysis [32] yielded the transition temperature, Tm, the enthalpy of unfolding, ΔH, and the free energy of unfolding at room temperature, ΔGu(298 K). Fits were performed assuming a two-state equilibrium between the native and the unfolded state and constant ΔH (ΔCp = 0). Fits improved slightly upon including a nonzero ΔCp.
Spectroscopic analysis of Zn2+ binding to Eco-ZnuA
Zinc-binding experiments were conducted in the presence of the indicator Mag-Fura-2 (MF) (Molecular Probes, Eugene, OR, USA) according to reported procedures [33–36]. Absorption spectra were collected from 250 to 800 nm with a Hewlett-Packard 8452A spectrophotometer at ambient temperature. The spectrometer was blanked against buffer H. ApoZnuA was added to buffer H to a final concentration of 20–30 μM, and a reference spectrum was collected. Freshly prepared MF was then added to a final concentration of approximately 16 μM. The actual concentration of MF was calculated from its absorbance at 366 nm using the extinction coefficient of 29,900 M−1 cm−1. Aliquots (4 μL) of 1 mM Zn2+ prepared from the zinc atomic absorption standard (Aldrich, 1,008 μg mL−1) in buffer H were added, mixed well, incubated for 2 min, and spectra were collected. Equilibrium was established within 1–1.5 min after addition of the metal. The absorbance of apoZnuA was subtracted from each spectrum. Data reduction was performed following reported procedures [33–36], and data fitting was performed with the program DynaFit [37]. Each spectrum was corrected for dilution and absorbance at 800 nm.
To estimate the relative affinity of ZnuA and MF for Zn2+, competition experiments between fully metallated ZnZnuA and metal-free MF were conducted. First, apoZnuA was incubated overnight with 8–10 equiv of zinc acetate. Excess metal was removed by five successive rounds of concentration/dilution using Amicon Ultra-15 centrifuge filter units with Ultracel-10 membranes. The filter was preequilibrated with thoroughly demetallated buffer H (the zinc content of the buffer was below the detection limit of ICP-AES). In each round, the sample was concentrated to 2 mL and subsequently diluted to 15 mL with buffer H. ZnZnuA was then mixed with increasing concentrations of MF (1–16 equiv) and incubated for 1 h. ZnuA/MF mixtures were separated by gel filtration on Superdex 75 preequilibrated with chelexed buffer H. In all cases, the protein concentration was measured by the bicinchoninic acid assay [38, 39] and the zinc concentration was measured by ICP-AES.
Spectroscopic studies of Co2+-substituted Eco-ZnuA
ApoZnuA was prepared by treating the protein with 10 mM EDTA followed by two cycles of dialysis against 30 mM Tris, pH 7.0 for 12 h, and then by two more cycles of dialysis against 30 mM Tris, pH 6.9 for 12 h. The pH was maintained below 7.0 to slow air oxidation of Co2+, which is faster at alkaline pH. The residual Zn2+ content was below the detection limit of ICP-AES. Co2+-substituted ZnuA was prepared by the direct addition of 1 or 2 equiv of CoCl2, turning the protein light pink. Spectra were collected at room temperature using an Agilent 8453 UV/vis spectrophotometer. EPR spectroscopy was carried out at 5–13 K, 9.63 GHz, and 2–50-mW microwave power with a Bruker EleXsys E500 spectrometer equipped with an ER4116DM TE102/TE012 cavity and an Oxford Instruments ESR900 helium-flow cryostat, using 100-kHz magnetic field modulation with 12-G (1.2-mT) modulation amplitude. Simulations were performed using XSophe (Bruker), explicitly taking S = 3/2.
Extended X-ray absorption fine structure studies of Zn2+- and Zn2+Co2+-substituted Eco-ZnuA
Samples for extended X-ray absorption fine structure (EXAFS) studies (1–2 mM) were prepared with 20% (v/v) glycerol as a cryoprotectant, preloaded into Lucite cuvettes with 6-μm polypropylene windows, and frozen rapidly in liquid nitrogen. X-ray absorption spectroscopic data were measured at the National Synchrotron Light Source, beamline X3B, using a Si(111) double-crystal monochromator and a bickel focusing mirror for harmonic rejection. Data collection and reduction were performed according to published procedures [40]. X-ray absorption spectra for ZnuA loaded with 1 equiv of Zn2+ were measured on two individually prepared samples (approximately eight scans per sample). Since both datasets gave comparable results, they were averaged, and the average is presented here. All other datasets represent single measurements, eight scans each.
The resulting χ(k) EXAFS data were fit (approximately 11 degrees of freedom for single-scattering and 37 for multiple-scattering fits) using the nonlinear least-squares algorithm contained in the program IFEFFIT, interfaced with SixPack (available free of charge from http://www-ssrl.slac.stanford.edu/∼swebb/index.htm). In all fits, the coordination number was varied in integer steps, while the scale factor, Sc, and ΔE0, were held fixed at calibrated values (for Zn, ΔE0 = −21 eV, SZn–N = 0.78; for Co, ΔE0 = −16 eV, SCo–N = 0.74), allowing only the distance (Ras) and the Debye–Waller factor to float. The fits presented in Fig. 10 were generated for Fourier-filtered data; fits to unfiltered data gave similar results (Figs. S4, S5, Table 3).
Fig. 10.
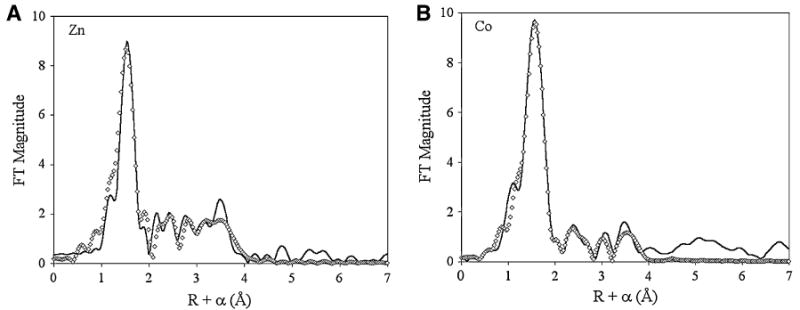
Extended X-ray absorption fine structure (EXAFS) data. Fourier transforms (FT) of k3-weighted EXAFS for a 1-ZnZnuA and b Co2+ in the second site in ZnCoZnuA. Solid lines represent raw data, while diamonds represent the best fits [fit 1–2 (Zn) and fit 2–4 (Co), Table 3]
Table 3.
Extended X-ray absorption fine structure curve-fitting results for 1-ZnZnuA and CoZnZnuA
| Model | M–O | M–N | M–Hisa | Rfb | Ru | ||
|---|---|---|---|---|---|---|---|
| 1-ZnZnuA (M is Zn) | |||||||
| 1–1 4 N/O | 1.98 (3.0) | 34 | 250 | ||||
| 1–2 4 N/O (3 His) | 1.98 (4.5) | 2.93 (10), 3.18 (8.5) | 37 | 109 | |||
| 4.03 (11), 4.30 (12) | |||||||
| CoZnZnuA (M is Zn) | 1.98 (5.8) | 2.94 (12), 3.19 (11) | 76 | 106 | |||
| 4.05 (12), 4.32 (14) | |||||||
| CoZnZnuA (M is Co) | |||||||
| 2–1 6 N/O | 2.08 (8.8) | 46 | 301 | ||||
| 2–2 4 O + 2 N | 2.04 (2.5) | 2.17 (4.2) | 26 | 182 | |||
| 2–3 4 N/O + 2 N (2 His) | 2.04 (3.0) | 2.17 (3.4) | 2.92 (3.8), 3.21 (7.5) | 61 | 112 | ||
| 4.00 (16), 4.24 (10) | |||||||
| 2–4 4 N/O + 2 N (2 His) + 2 | 2.02 (3.0) | 2.19 (1.4) | 2.90 (3.6), 3.25 (9.5) | 2.66 (5.0) | 40 | 105 | |
| 3.97 (12), 4.25 (13) |
Distances (angstroms) and disorder parameters [in parentheses, σ2 (10−3 Å2)] shown derive from integer or half-integer coordination number fits to filtered EXAFS data [k = 1–14 Å−1; single scattering, R = 0.7–2.1 Å (fits 1–1, 2–1, and 2–2); multiple scattering, R = 0.3–4.3 Å (fits 1–2, 2–3, and 2–4)]
Multiple scattering paths represent combined paths, as described previously (see “Materials and methods”)
Goodness of fit (Rf for fits to filtered data, Ru for fits to unfiltered data) defined as , where N is the number of data points
Multiple-scattering contributions from His ligands were approximated by fitting FEFF calculated paths to the experimental EXAFS, as described previously [40, 41]. Briefly, the imidazolate ring outer-shell scattering is approximated using the four most prominent scattering paths derived from the structure of Zn(imidazole)4, as calculated by FEFF [42]. The coordination number employed for a given path is adjusted to reflect the total number of scattering paths of similar length. These four “combined” paths are refined independently (varying only Ras and σas), and the number of coordinated imidazolates is estimated on the basis of the lowest fit residual in an incremental series of fits. The uncertainty in the number of imidazolate ligands determined in this way is estimated to be ±0.5.
Fluorescence with 8-anilino-1-naphthalenesulfonic acid
Conformational changes of Eco-ZnuA upon addition of various metal ions were investigated using the fluorescent dye 8-anilino-1-naphthalenesulfonic acid (ANS; Sigma). A mixture of 0.5 mM ANS and 5 μM apoZnuA in buffer H (initial total volume 800 μL) was placed in a 1.2-mL cuvette (1-cm pathlength). Fluorescence spectra were collected at 296 K using an excitation wavelength of 380 nm (slit width of 8 nm) and an emission wavelength of 420–660 nm (slit width of 8 nm), with ten iterations and a 2-nm step size with an ISS PC1 photon counting spectrofluorometer. The excitation wavelength was determined by collecting an excitation spectrum between 300 and 450 nm with a detected emission at 510 nm. Stock solutions of metals (10 and 1 mM Zn2+, Cd2+, Co2+, Ca2+, Mn2+, Ni2+, Cu2+, and Cu+) were prepared from atomic absorption standards (Aldrich) diluted with buffer H (estimated final concentration of HNO3 is 0.6% by weight). For Cu1+, the oxidation state was maintained by the addition of 20 mM ascorbic acid (1:2 Cu-to-ascorbate ratio). Two sets of experiments were conducted. In the first, metal ions were added to the mixture of 0.5 mM ANS and 5 μM apoZnuA from the stock solutions to 5 and 10 μM final concentrations. In the second set of experiments, the metal ions were added to 0.1, 0.5, and 1.0 mM final concentrations. Fluorescence spectra were collected after each addition. Each initial addition of a new metal ion was followed by a 10-min time scan. Since the time scans showed no significant changes in the emission spectra, all spectra were acquired immediately upon metal addition after thorough mixing. All the data were corrected for dilution.
In addition, the following control experiments were performed. First, stock metal solutions were added to 0.5 mM ANS alone under conditions identical to those described above. No change in ANS fluorescence was observed, indicating the specificity of fluorescence response in the presence of ZnuA. Second, to ensure that dilution of the protein sample with 0.6% HNO3 in buffer H during metal addition had no effect on protein conformation, the experiments were repeated with additions of buffer volumes that corresponded to the volumes of metal solutions. For Cu+, two additional control experiments were performed to ensure that ascorbate had no effect on ANS fluorescence either directly (Cu/ascorbate mixture was added to ANS alone) or by altering the protein conformation (ascorbate was added to the ANS/protein mixture). In both cases, ANS fluorescence was not affected by the presence of ascorbate.
Results
Overall structure of Eco-ZnuA
The crystal structure of Eco-ZnuA has been solved in the apo, Zn2+-bound (forms I and II), and Co2+-bound forms to 2.45-, 2.00-, 1.70-, and 2.15-Å resolution, respectively (Table 1). While this work was in progress, two other crystal structures of Eco-ZnuA were reported [13, 14] and are virtually identical in fold to the structure of ZnZnuA form I (Fig. 1). The first 26 N-terminal amino acids are not present in any Eco-ZnuA structure [13, 14] and are believed to comprise a signal peptide. The His-rich loop (residues 116–138) located in the N-terminal domain between β4 and α4 (Fig. 1) has weak electron density and was modeled only partially. In Syn-ZnuA [7] and the other Eco-ZnuA [13, 14] structures, this loop is also disordered. In all the Eco-ZnuA structures, Cys252 and Cys306 form a disulfide bond that might be important for maintaining the integrity of Eco-ZnuA structure or in regulation of Zn2+ binding as was suggested for MntC [12]. There are two molecules of Eco-ZnuA in the asymmetric unit of all crystal forms, yielding eight independent views: molecules A and B in ZnZnuA form I, C and D in ZnZnuA form II, E and F in CoZnuA, and G and H in apoZnuA. Whereas the two reported Eco-ZnuA structures have a single metal binding site per molecule [13, 14], molecules A, B, and C have two distinct metal binding sites occupied, molecules D, E, and F have only one metal binding site occupied, and molecules G and H contain no metal ions. The RMSD values between ZnZnuA molecule A and the other chains are 0.42 and 0.47 Å for ZnZnuA molecules B and C, respectively, and 0.74–0.91 Å for molecules D, E, F, G, and H. The N-terminal domain and the connecting α helix (αC) are almost identical in all structures (Fig. 2a). Significant differences are observed in the C-terminus, however (Fig. 2b). The loop between β6 and α6 (β6α6 loop) can adopt both open (position 1, molecules D, E, F, G, and H) and closed (position 2, molecules A, B, and C) conformations, resulting in two different positions of the neighboring helices α6 and α7 (Fig. 2b). The flexibility of this region is manifested by higher B factors. For example, the overall B factor for ZnZnuA molecule C, is 31.6 Å2, whereas the average B factor for the region spanning residues 219–253 is 48.3 Å2.
Fig. 1.
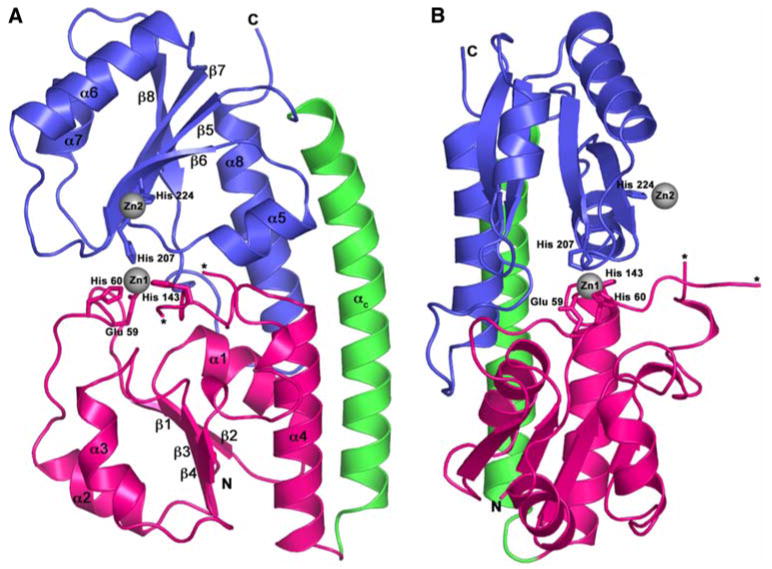
Structure of ZnZnuA. a Ribbon diagram of crystal form I showing the N-terminal domain in pink, the C-terminal domain in blue, and the connecting α-helix (αc) in green. The zinc ions are represented as gray spheres. The ends of the disordered His-rich loop are indicated by asterisks. b Viewed approximately 90° around the vertical axis from the orientation in a
Fig. 2.
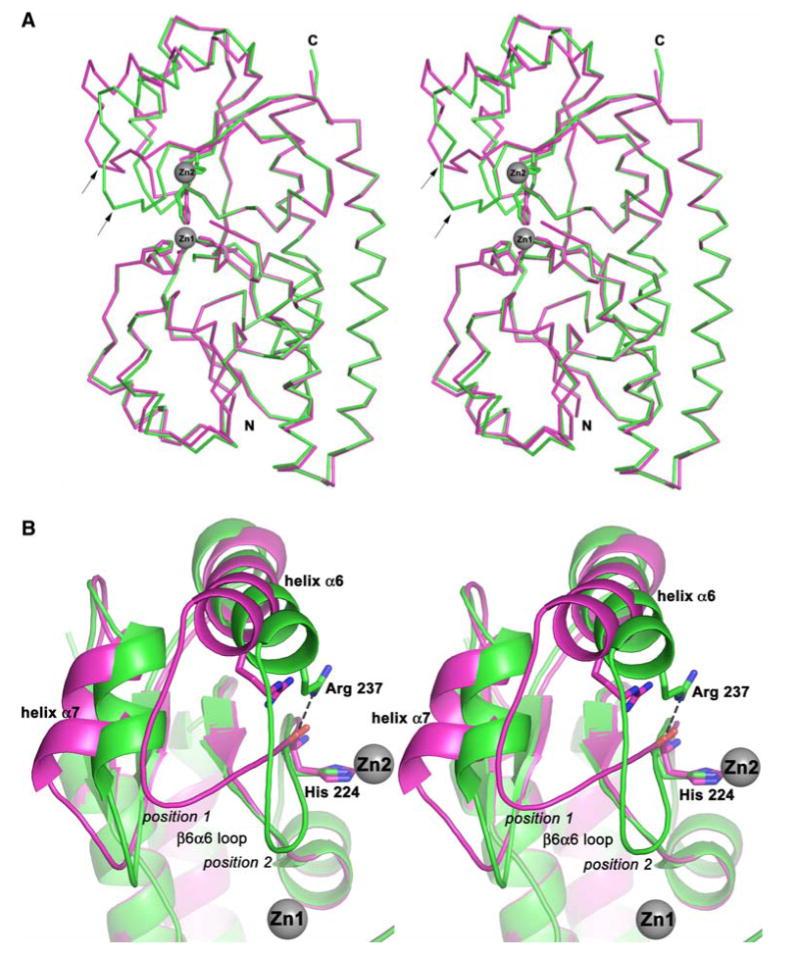
Structural comparison between ZnuA protein from Escherichia coli (Eco-ZnuA) with both metal binding sites occupied (ZnZnuA, molecule A, green) and Eco-ZnuA with one metal binding site occupied (CoZnuA, molecule E, magenta). a Stereo superposition of the Cα atoms. The β6α6 loop is labeled with arrows. b Closeup view of the conformational changes in the C-terminal domain. Residues His224 and Arg237 are shown as stick representations, and the Zn2+ ions are shown as gray spheres. The position of the Co2+ site is identical to that of Zn1
The primary metal binding site
The main metal binding site was identified by a strong peak in an anomalous Fourier map (Fig. 3a). Its position and coordination are identical to those reported by Li and Jogl [14]. The Zn2+ ion is coordinated by His60, His143, His207, and Glu59 in an almost ideal tetrahedral geometry (Table S1). In the structure reported by Chandra et al. [13], coordinating residue Glu59 is replaced with water, resulting in a site more similar to that in Syn-ZnuA [7]. In all four ZnZnuA molecules in the form I and form II structures, the coordination geometry and Zn–N/O distances are within the experimental error of one another (Table S2) and agree well with the average Zn–N His and Zn–O Glu distances reported for tetrahedral binding sites in other proteins [43]. A superposition of molecules A, B, C, and D indicates that the positions of Glu59 and His143 are strictly maintained, the position of His60 varies somewhat (by approximately 0.3–0.8 Å), and His207 clearly occupies two distinct positions related to conformational variation in the β6α6 loop and helices α6 and α7 (Fig. 3b). Secondary sphere interactions involving the His δ nitrogen atoms and the uncoordinated side chain oxygen of Glu59 are similar to those described for the other Eco-ZnuA structures [13, 14] and observed for Syn-ZnuA [7] and presumably fine-tune the primary ligand sphere for efficient Zn2+ binding [44]. The secondary-sphere carboxylate residues may also act as proton acceptors for the Zn2+-bound His residues if the metal binding site is solvent-inaccessible [43], as is the case for Eco-ZnuA.
Fig. 3.
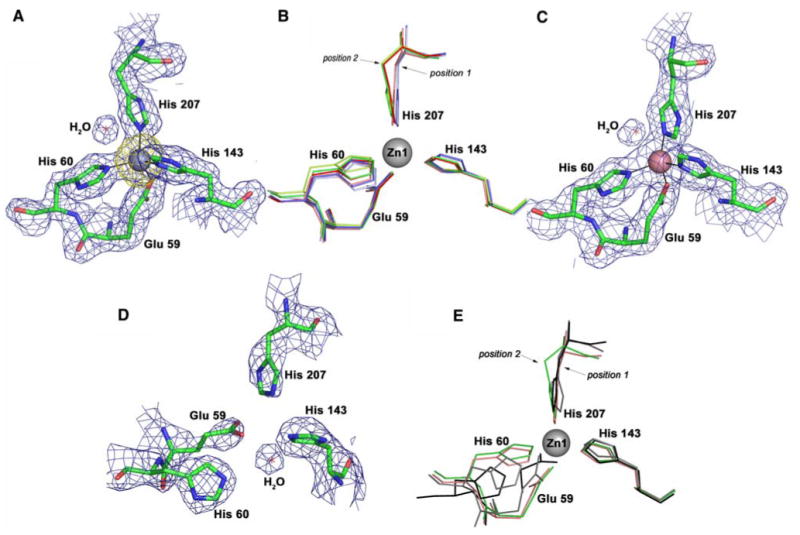
The primary metal binding site in Eco-ZnuA. a ZnZnuA molecule A, final 2.0-Å resolution 2Fo – Fc electron density map (blue, contoured at 1.2σ) superimposed on an anomalous difference Fourier map calculated using data collected near the zinc absorption edge (yellow, contoured at 5σ). b Superposition of the metal binding sites in ZnZnuA molecules A, B, C, and D (shown in green, light green, red, and dark salmon, respectively) and CoZnuA molecules E and F (shown in blue and light blue, respectively). c CoZnuA molecule A, final 2.15-Å resolution 2Fo – Fc electron density map (blue, contoured at 1.2σ). d ApoZnuA molecule H, final 2.45-Å resolution 2Fo – Fc electron density map (contoured at 1.2σ). The water molecule is not observed in molecule G. e Superposition of the metal binding sites in apoZnuA, molecules G and H (shown in gray and black, respectively) and in ZnZnuA, with one (molecule D, dark salmon) and two (molecule A, green) occupied metal binding sites
The primary metal binding site can also be loaded with Co2+. The overall protein fold and details of metal binding (Fig. 3c) are the same as in the ZnZnuA structure. Ligand His207 occupies position 1 (Fig. 3b), similar to molecule D in the ZnZnuA form II structure. Different orientations of His207 in molecules D, E, and F from those in molecules A, B, and C result in a slight lengthening of the bond between the metal ion and the His207 ε nitrogen from 1.93–1.97 to 2.03–2.12 Å (Table S1). Interestingly, a water molecule is found adjacent to the metal ion in the structures in which His207 occupies position 1 and may account for the altered position of His207. In CoZnuA molecules E and F, this water molecule is 3.11–3.21 Å away from the Co2+ ion and in ZnZnuA, molecule D, it is 3.66 Å away from the Zn2+ ion. By contrast, two water molecules present in the metal-binding pocket of ZnZnuA molecules A, B, and C are substantially further from the metal center, with distances of 4.28–4.45 Å. A search of the PDB reveals a large number of Co2+-containing protein structures with water molecules approximately 3 Å from the Co2+ ion. The only changes in the metal coordination geometry that can be assigned to the substitution of Co2+ for Zn2+ are the lengthening of the distance from the metal to the ε nitrogen atom of His143 from 2.02–2.08 to 2.19–2.21 Å and small changes in the dihedral angles (Table S1). The almost complete conservation of metal coordination geometry between ZnZnuA and CoZnuA indicates that spectroscopic studies of Co2+-substituted MBRs are an appropriate approach to obtain information about Zn2+ binding sites in the absence of crystallographic data.
The apoZnuA structure is completely devoid of metal ions (Fig. 3d). Ligand His143 occupies a similar position, which is somewhat surprising since this residue is only five amino acids from the disordered His-rich loop. Residue His207 in apoZnuA occupies position 1, and His60 and Glu59 are flexible, adopting conformations in the two apoZnuA molecules that differ from one another as well as from their conformations in the metal-loaded ZnuA structures (Fig. 3e). In the apo Tpa-TroA structure [15], the residue corresponding to Eco-ZnuA His60 flips its position and hydrogen-bonds to a directly preceding Asp residue in a DPH motif that is conserved in Syn-ZnuA and Spn-PsaA. Since His60 is preceded by Ser and Glu residues and does not undergo a similar shift in apoZnuA, the DPH motif is not critical to the metal binding site. This conclusion is supported by the recent mutant Syn-ZnuA structures where zinc release was not accompanied by hydrogen-bond formation in the DPH motif [8]. The secondary-sphere hydrogen-bonding interactions observed in ZnZnuA remain intact in apoZnuA, and additional interactions between the side chain of Glu59 and the side chains of both His143 and His207 are formed.
The second metal binding site
In contrast to the other Eco-ZnuA structures [13, 14], a second metal binding site is clearly present in our structures. Purified, recombinant Eco-ZnuA contains 0.99 ± 0.12 equiv of Zn2+. However, the addition of excess Zn2+ (approximately 5 equiv) followed by extensive dialysis or gel filtration results in 1.85 ± 0.26 Zn2+ ions per Eco-ZnuA molecule, suggesting the presence of a second metal binding site. This site, located approximately 12 Å from the main metal binding site, was identified in anomalous difference Fourier maps of ZnZnuA molecules A, B, and C (Fig. 4a). It is partially occupied with refined occupancies of 0.35 for all three molecules. Since this site is not fully occupied and can be partially or completely depleted during purification, its affinity for Zn2+ is likely lower than that of the primary site. The only visible ligand to this second Zn2+ ion is His224, which coordinates via its ε nitrogen atom (Fig. 4a). The Zn–N distances are 2.35, 2.16, and 2.10 Å in molecules A, B, and C, respectively. The δ nitrogen atom and backbone NH group of His224 interact with water molecules (distances 2.75–3.18 Å), and the carbonyl oxygen of His224 interacts with the amino group of Arg237 (distances 3.01–3.13 Å). When the second metal binding site is empty and/or the β6α6 loop occupies position 1 (Fig. 4b), Arg 237 is too far away for this interaction to occur. The position of His224 differs only slightly between the apo and holo Eco-ZnuA structures, which is surprising since His224 is only one residue away from the flexible β6α6 loop (Fig. 4b). Besides His224, some additional electron density is visible around the second Zn2+ ion (Fig. 4a), although it is not possible to identify specific residues. These residues likely derive from the His-rich loop, however. The His-rich loop is on the same face of the protein as the second Zn2+ ion (Fig. 1b), and contains multiple His, Asp, and Glu residues, any of which would be candidate ligands. At least one additional ligand may be a His residue because density for His119 from the His-rich loop is observed in the apoZnuA structure in close proximity to His224. EXAFS studies also support the presence of His ligands (vide infra).
Fig. 4.
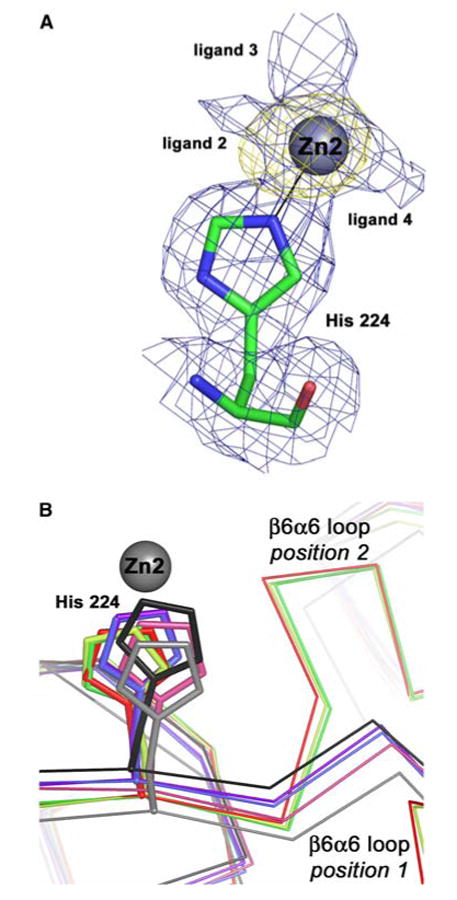
The second metal binding site in Eco-ZnuA. a Final 2.0-Å resolution 2Fo – Fc electron density map (blue, contoured at 0.7σ) superimposed on the anomalous difference Fourier map calculated using data collected near the zinc absorption edge (yellow, contoured at 5σ). The unidentified ligands are labeled ligand 2, ligand 3, and ligand 4. b Superposition of all the His224 residues with ZnZnuA molecules A, B, C, and D shown in green, light green, red, and dark salmon, respectively, CoZnuA molecules E and F shown in blue and light blue, respectively, and apoZnuA molecules G and H shown in gray and black, respectively. The two different positions of the β6α6 loop are clear
CD spectroscopy
The metal binding properties of ZnuA were investigated by CD spectroscopy. The far-UV CD spectra of Eco-ZnuA at pH 7.5 titrated with increasing amounts of Zn2+ are shown in Fig. 5. Spectral changes occur with the addition of up to 2 equiv of Zn2+, indicating a 2:1 zinc-to-protein stoichiometry. This finding is in agreement with the presence of two metal binding sites in the crystal structures as well as with the measured metal stoichiometry of 1.85 ± 0.26. However, it is possible that the binding of additional metal ions occurs without further spectral changes. Addition of Cd2+ and Co2+ results in spectral changes similar to those observed upon Zn2+ addition (Fig. S1a, c), suggesting that Zn2+, Co2+, and Cd2+ bind similarly. Addition of Mn2+ does not affect the CD spectrum (Fig. S1b).
Fig. 5.
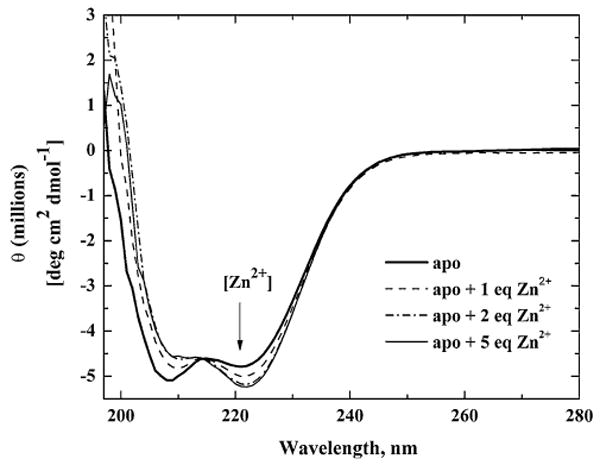
Far-UV circular dichroism (CD) spectra of Eco-ZnuA. The spectra were acquired for 5.4 μM apoZnuA (bold solid line), with 1 equiv of Zn2+ (dashed line), with 2 equiv of Zn2+ (dotted line), and with 5 equiv of Zn2+ (thin solid line) in 20 mM potassium phosphate, pH 7.5, 20 mM NaF
CD was also used to study the thermal stability of Eco-ZnuA in the presence of various metal ions (apo, Zn2+, Cu2+, Cu+, Ni2+, Co2+, and Mn2+). In a typical experiment, 90% or more of the protein remains folded immediately following the temperature scan (after cooling the sample to room temperature). This amount drops to approximately 60% in the case of Cu+. Owing to the reversibility of the thermal unfolding process, the data could be fit very well to a simple two-state model of an equilibrium between native folded and unfolded states (Fig. 6, Table 2). In all cases but Cu+, the thermal unfolding curves have relatively sharp transition regions. The much broader transition region of the Cu+-loaded ZnuA could be related to some irreversibility of the thermal unfolding process. Addition of Zn2+, Co2+, Ni2+, and Cu2+, but not Cu+ and Mn2+, stabilizes ZnuA against thermal unfolding, which agrees with the presence (Zn2+ and Co2+) or absence (Mn2+) of CD spectroscopic changes (Figs. 5, S1). Notably, addition of Zn2+ stabilizes Eco-ZnuA the most significantly as judged by a substantial increase in the Tm value (ΔTm = 12.5 K) and in ΔGu [ΔΔGu(298 K) = 31.8 kJ mol−1]. Including nonzero ΔCp in the fits resulted in a slight improvement of the fit quality (as assessed by an increase in the correlation coefficient R, and a decrease in χ2/DOF, where DOF is the number of degrees of freedom).
Fig. 6.
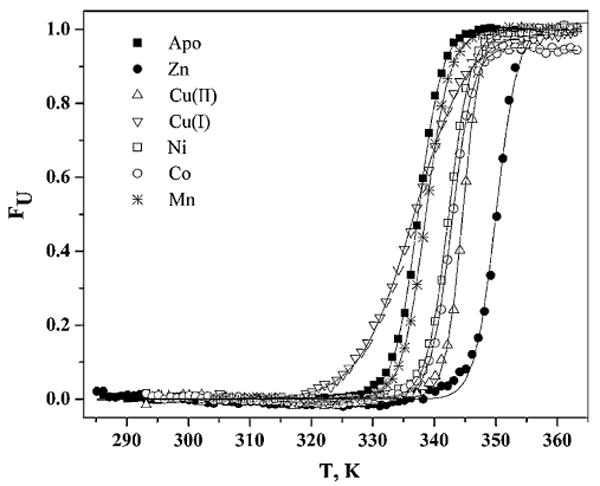
Thermal denaturation of Eco-ZnuA monitored by CD spectroscopy at 222 nm. Data for 1.4 μM apoZnuA (filled squares), and ZnuA in the presence of 10 μM Zn2+ (filled circles), Cu2+(up triangles), Cu+(inverted triangles), Ni2+ (open squares), Co2+(open circles), and Mn2+ (asterisks) were fit to the two-state model (equilibrium between the native and the unfolded state) assuming zero ΔCP (solid line) or nonzero ΔCP (not shown). Buffer, 20 mM potassium phosphate, pH 7.5, 20 mM NaF
Table 2.
Thermodynamic parameters for ZnuA folding (1.4 μM protein, 10 μM metals, in 20 mM phosphate, pH 7.5, 20 mM NaF buffer)
| ΔCp = 0 | ΔCp ≠ 0 | ||||||
|---|---|---|---|---|---|---|---|
| ZnuA | ΔH (kJ mol−1 | Tm (K) | ΔGu (kJ mol−1) | ΔH (kJ mol−1) | Tm (K) | ΔGu (kJ mol−1) | ΔCp (kJ mol−1 K−1) |
| Apo | 499.9 ± 5.6 | 337.5 ± 0.1 | 58.5 | 495.7 ± 4.2 | 337.4 ± 0.1 | 57.9 | 15.7 ± 0.2 |
| Zn2+ | 607.9 ± 21.0 | 350.0 ± 0.1 | 90.3 | 645.1 ± 30.4 | 349.6 ± 0.1 | 95.2 | 19.6 ± 0.9 |
| Cu2+ | 709.3 ± 19.5 | 344.6 ± 0.1 | 95.9 | 711.7 ± 18.1 | 344.6 ± 0.1 | 96.2 | 22.3 ± 3.2 |
| Cu+ | 215.9 ± 3.4 | 336.7 ± 0.1 | 24.8 | 198.2 ± 3.7 | 335.9 ± 0.1 | 22.4 | 8.1 ± 0.2 |
| Ni2+ | 555.0 ± 10.1 | 342.3 ± 0.1 | 71.8 | 565.1 ± 7.8 | 342.3 ± 0.1 | 73.1 | 19.2 ± 0.3 |
| Co2+ | 570.8 ± 11.0 | 342.9 ± 0.1 | 74.7 | 580.5 ± 9.6 | 342.9 ± 0.1 | 76.0 | 19.6 ± 0.4 |
| Mn2+ | 497.6 ± 5.2 | 338.6 ± 0.1 | 59.7 | 500.2 ± 5.0 | 338.6 ± 0.1 | 60.9 | 10.7 ± 3.1 |
ΔGu is calculated for 298 K
Zn2+ binding affinity of Eco-ZnuA
Because Zn2+ is spectroscopically silent and addition of Co2+ produces only small changes in the visible spectrum (Fig. 8, εCoZnuA ≈ 80 M−1 cm−1), the Zn2+ binding affinity of Eco-ZnuA was measured by competition experiments with the chromophoric Zn2+ chelator MF [33–36, 45]. MF forms a 1:1 complex with Zn2+ (Zn-MF, Kd = 20 nM, pH 7.0, 298 K [46]) and is widely used to study metal centers with micromolar to nanomolar binding affinities. The 366 nm absorption maximum of MF shifts to 325 nm upon Zn2+ binding, and the extinction coefficient at 366 nm decreases significantly from 29,900 M−1 cm−1 (MF) to 1,880 M−1 cm−1 (Zn-MF). In titrations of an apoZnuA/MF mixture with increasing concentrations of Zn2+ ions, the decrease in absorbance at 366 nm is quite slow until approximately 2 equiv of Zn2+ is added (Fig. 7). These data indicate that the affinity of Eco-ZnuA for both Zn2+ ions is higher than that of MF (Kd < 20 nM). We also estimated the relative affinities of Eco-ZnuA and MF toward Zn2+ by monitoring metal transfer between fully loaded ZnZnuA and increasing concentrations of apoMF. The fact that even 16-fold excess of MF relative to ZnZ-nuA was not capable of removing the second Zn2+ ion (Fig. S2) indicates that the affinity of ZnuA for both Zn2+ ions is indeed higher than that of MF. This result is in agreement with the isothermal titration calorimetric studies of Syn-ZnuA, in which Kd ∼ 10 nM was measured [8].
Fig. 8.
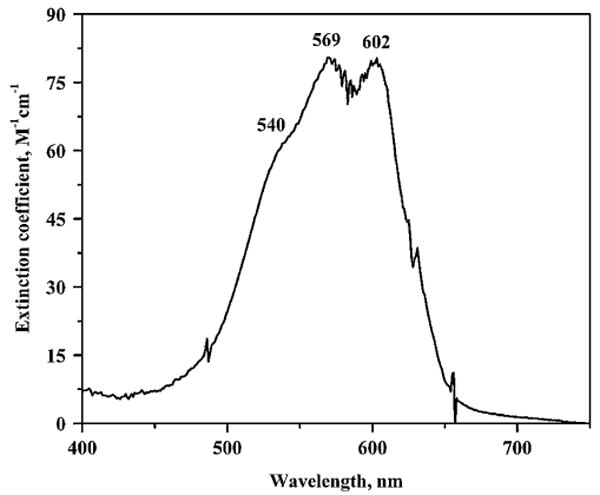
UV/vis spectrum of CoZnuA loaded with 1 equiv of Co2+
Fig. 7.
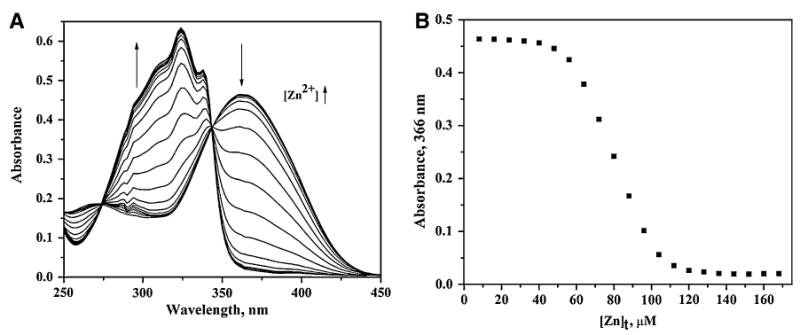
Titration of Eco-ZnuA/Mag-Fura-2 (MF) with Zn2+. a Representative UV/vis spectra obtained during titration of 15.5 μM MF and 21.9 μM Eco-ZnuA with 4-μL aliquots of 1 mM Zn2+ in 50 mM N-(2-hydroxyethyl)piperazine-N′-ethanesulfonic acid (HEPES), pH 7.5, 200 mM NaCl at room temperature. Arrows indicate the direction of the absorbance changes as increasing concentrations of Zn2+ are added. b Absorbance change at 366 nm of Eco-ZnuA/MF mixture as a function of added Zn2+
Spectroscopic studies of CoZnuA
The UV/vis difference spectrum of CoZnuA (spectrum of CoZnuA loaded with 1 equiv of Co2+, 1-CoZnuA, minus that of apoZnuA) exhibits peaks at 569 nm (ε = 80 M-1 cm-1) and 602 nm (ε = 80 M−1 cm−1) and a shoulder at 540 nm (Fig. 8). An extinction coefficient between 50 and 250 M−1 cm−1 is consistent with five-coordinate Co2+ and agrees well with the crystal structure of CoZnuA, in which Co2+ in the main metal binding site is coordinated by three His, a Glu, and a water molecule (Fig. 3c). The UV/vis spectrum of CoZnuA containing 2 equiv of Co2+, 2-CoZnuA, is similar in appearance to that of 1-CoZnuA. The difference spectrum (spectrum of 2-CoZnuA minus that of 1-CoZnuA; Fig. S3) exhibits a very weak broad peak at approximately 506 nm with an extinction coefficient of approximately 10 M−1 cm−1, suggestive of six-coordinate Co2+ in the second metal binding site.
CoZnuA was also studied by EPR spectroscopy to gain further insight into the Co2+ coordination environment (Fig. 9). The EPR spectrum of 1-CoZnuA (Fig. 9, spectrum B) recorded under nonsaturating conditions (13 K, 2 mW) was simulated (Fig. 9, spectrum C) as a single species with the following parameters: S = 3/2, MS = |±1/2〉, D ≫ gβBS (50 cm−1 was used), E/D = 0.04, g⊥ = 2.25, and g‖ = 2.38, where D is the axial component of the zero-field splitting and E is the rhombic distortion of the axial zero-field splitting. These parameters and the broad lines are entirely consistent with a five-coordinate Co2+ ion with one or more water ligands, as observed in the crystal structure and deduced from UV/vis analysis. The spectrum of 2-CoZnuA (Fig. 9, spectrum G) yielded a second, distinct Co2+ signal (Fig. 9, spectrum D) upon subtraction of the signal from that for 1-CoZnuA. This second signal was also simulated (Fig. 9, spectrum E) as a single chemical species, with parameters consistent with five- or six-coordinate Co2+ [S = 3/2, MS = |±1/2〉, D ≫ gβBS (50 cm−1 was used), E/D = 0.11, g⊥ = 2.25 and g‖ = 2.36]. Although the coordination of the native Zn2+ ion in the second metal binding site is not clear from the crystal structure, the broad lines of the EPR spectrum suggest that the coordination of Co2+ in this metal binding site may be increased by one or more water molecules. Addition of the two simulations (Fig. 9, spectrum H) matches the experimental spectrum of 2-CoZnuA recorded under nonsaturating conditions. The signal from either 2-CoZnuA or 1-CoZnuA recorded at 5 K, 50 mW (Fig. 9, spectra A, F) provided no evidence for an MS = |±3/2〉 signal from tetrahedral Co2+. The invariance of the signal attributed to the first Co2+ ion upon binding a second Co2+ ion and the lack of any features or intensity changes that could be assigned to spin-spin coupling indicate that the metal ions do not interact with one another, consistent with the Zn–Zn distances of 12.2–12.4 Å in ZnZnuA structures.
Fig. 9.
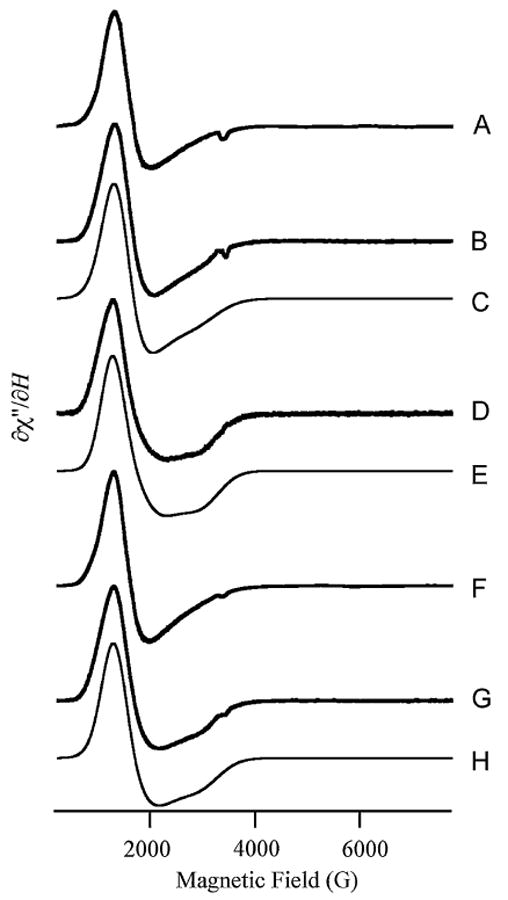
Electron paramagnetic resonance (EPR) spectra of CoZnuA. Traces A, B, F, and G are experimental EPR spectra of ZnuA with 1 equiv of Co2+ (A, B) or 2 equiv of Co2+ (F, G). Spectra A and F were recorded at 5 K, 50-mW microwave power, and spectra B and G were recorded at 13 K, 2-mW microwave power. Spectra F and G are shown with twofold reduced amplitude compared to spectra A and B, respectively. Trace D is the difference spectrum obtained by subtraction of trace B from trace G (prior to amplitude reduction of trace G). Trace C is a simulation of trace B assuming a spin Hamiltonian H = βg·B·S + S·D·S, where S = 3/2, and parameters D = 50 cm−1 (i.e., D ≫ gβBS, MS = |±1/2〉), E/D = 0.04, g⊥ = 2.25, and g‖ = 2.38. Trace E is a simulation of trace D with parameters D = 50 cm−1 (i.e., D ≫ gβBS, MS = |±1/2〉), E/D = 0.11, g⊥ = 2.25, and g‖ = 2.36. Trace H is the sum of traces C and E, shown with twofold reduced amplitude
EXAFS studies of Zn- and ZnCo-substituted Eco-ZnuA
To better define the coordination environments of the two distinct metal sites, X-ray absorption spectroscopy experiments were performed. Examination of the main binding site (1-ZnZnuA, Figs. 10a, S4) shows a fairly symmetric first shell exclusively composed of Zn2+–N/O scattering and significant outer-shell scattering. Fourier-filtered first-shell fits are consistent with a tetracoordinate metal ion, with four N/O ligands at an average distance of 1.98 Å (Table 3). Separate contributions from nitrogen and oxygen scatterers could not be resolved. Multiple-scattering fits further indicate the presence of three histidyl imidazole ligands, in agreement with the crystal structures.
The structure of the second metal binding site was probed by preparing a mixed-metal derivative, with 1 equiv of Zn2+ added first, followed by addition of 1 equiv of Co2+. Zinc K-edge EXAFS of the mixed-metal derivative (Fig. S4, Table 3) gave the same results as 1-ZnZnuA, indicating that Zn2+ populates exclusively the main binding site. EX-AFS of the Co2+ in the auxiliary site shows an increase in Fourier transform magnitude, suggestive of higher coordination (Figs. 10b, S5). The best fits indicate asymmetric coordination (four O and two N donors) (Table 3). The distance difference of 0.13 Å is within the resolution of the data (0.12 Å). Multiple-scattering fits indicate the presence of two His ligands. Inclusion of an additional shell of two carbon scatterers at 2.66 Å, representative of carboxylate coordination, improves the Fourier-filtered fit by approximately 34% (while modestly increasing the number of variable parameters from 12 to 14), although it only minimally affects the unfiltered fit residual. Therefore, the predicted coordination of the second metal binding site based on EXAFS data is consistent with two His, two Asp/Glu, and two water molecules. These results are fully consistent with the crystallographic and EPR data.
Metal specificity of ZnuA monitored by ANS fluorescence
ANS is a useful hydrophobic fluorescent probe to study protein conformational changes, hydrophobic sites in native proteins, and protein/substrate interactions. The ANS fluorescence in aqueous solutions is low and increases substantially and blueshifts when ANS is associated with hydrophobic protein surfaces or nonpolar environments. The addition of 1 and 2 mol equiv of transition metals (Zn2+, Co2+, Mn2+, Ni2+, Cd2+, Cu+, and Cu2+) to a ZnuA/ANS mixture causes a decrease in the ANS fluorescence, indicating that each metal ion induces conformational changes that decrease exposed hydrophobic surfaces on ZnuA (Fig. 11a). However, selectivity for different metal ions is observed at higher metal concentrations (0.1–1.0 mM). At these concentrations, Zn2+, Cd2+, and Cu+ cause a substantial increase in ANS fluorescence (Fig. 11b). When Co2+ was added to the same mixture, the fluorescence intensity immediately decreased to the level of ANS fluorescence in the absence of protein. It is not clear why different results are obtained for ANS fluorescence in the presence of Co2+ as compared with Zn2+ given that both bind in the same site in the structures. A possible explanation lies in the different positions of the β6α6 loop in the Zn2+ and Co2+ structures. In three of four ZnZnuA molecules (A, B, and C), this loop is in the closed position, whereas in both CoZnuA molecules (E and F), the loop remains open (Fig. 2), suggesting Co2+ binding may not lead to the same conformational changes as Zn2+ binding. A similar decrease in ANS fluorescence upon initial metal addition was observed for Ni2+, Mn2+, and Cu2+. Addition of higher concentrations of these metals increased the observed fluorescence of the mixture, but not as much as with Zn2+, Cd2+, and Cu+. Minimal change in fluorescence was observed upon addition of Ca2+. In control experiments, the addition of buffer H containing 0.6% HNO3 to the ZnuA/ANS mixture or the addition of metal solutions (Zn2+, Cd2+, Co2+, Ca2+, Mn2+, Ni2+ Cu2+, and Cu+) to ANS alone resulted in minimal if any change in fluorescence (Fig. S6). These data suggest that Zn2+, Cd2+, and Cu+ have the greatest effect on the Eco-ZnuA conformation, whereas Co2+, Mn2+, Ni2+, and Cu2+ either do not bind ZnuA as efficiently or do not induce substantial conformational changes.
Fig. 11.
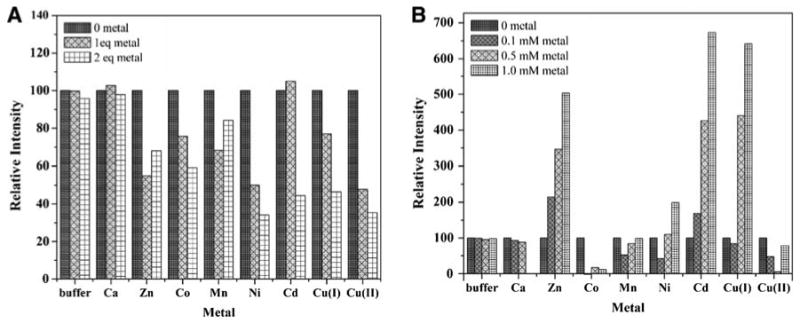
8-Anilino-1-naphthalenesulfonic acid (ANS) fluorescence data. Changes in ANS fluorescence intensity at 510 nm of 5 μM apoZnuA, 0.5 mM ANS solution upon addition of a various metal ions to 5 and 10 μM final concentration, and b to 0.1, 0.5, and 1.0 mM final concentration (note the different scales for relative intensity). The columns labeled buffer correspond to the fluorescence of 5 μM apoZnuA, 0.5 mM ANS solution diluted with metal-free buffer H (50 mM HEPES, pH 7.5, 200 mM NaCl) containing 0.6% HNO3. The volume of buffer H, 0.6 % HNO3 corresponds to the volume of metal aliquots added to the protein/ANS solution. All the spectra were corrected for the fluorescence of ANS alone by subtracting the fluorescence of ANS solution of equivalent volume and concentration from the fluorescence of all the spectra. Experimental conditions as follows: λex = 380 nm, λem = 510 nm, 296 K, buffer 50 mM HEPES, pH 7.5, 200 mM NaCl
Discussion
Metal specificity
According to the CD data, the addition of Zn2+, Co2+, and Cd2+, but not Mn2+, induces conformational changes in Eco-ZnuA (Figs. 5, S1). In agreement with this result, Zn2+, Co2+, Ni2+, and Cu2+, but not Mn2+ or Cu+, stabilize Eco-ZnuA against thermal denaturation, with Zn2+ having the highest stabilization effect (ΔTm = 12.5 K). ANS fluorescence data using low metal concentrations (1–2 mol equiv) indicate that a broad range of metal ions affect the conformation of Eco-ZnuA. When excess metal ions are added, Zn2+, Cd2+, and Cu+ have a much stronger effect (Fig. 11b). For Cu+, the conformational changes may lead to decreased stability (Fig. 6). Although ZnuA interacts with various divalent transition metals, only Zn2+ is capable of substantially improving its structural stability. This finding, combined with the high affinity of ZnuA for Zn2+ (Kd < 20 nM) and the observation that Zn2+ and Cd2+ most significantly affect the conformation as monitored by ANS fluorescence, suggests that Zn2+ is the physiological substrate.
A comparison of the primary metal binding site in all of the structurally characterized cluster 9 MBRs provides insight into how metal ion specificity is conferred by the protein scaffold. Syn-ZnuA, Eco-ZnuA, Spn-PsaA, and Tpa-TroA were crystallized with Zn2+ in the metal binding site, although Spn-PsaA is predicted to bind Mn2+ [2]. The specificity of Tpa-TroA is more controversial, with Mn2+, Zn2+, and Fe2+ as possible substrates [19, 47]. Syn-MntC is the only MBR crystallized with Mn2+, its natural substrate [12]. In all the structures, the main metal binding site has a similar location and ligand composition. Two ligands, His60 and His143 (Eco-ZnuA numbering), are strictly conserved. Beyond these similarities, three structural features can be correlated with metal specificity. The first determinant is the identity of the third ligand at position 207 with His (Syn-ZnuA, Eco-ZnuA, Tpa-TroA) specifying Zn2+ and Glu (Spn-PsaA and Syn-MntC) specifying Mn2+ or Fe2+, which prefer a higher coordination number [11]. However, the Glu residue in this position adopts monodentate coordination in all the reported structures. The second determinant is the role of the conserved Asp residue at position 279 [7]. In the Mn2+-binding proteins, Asp279 coordinates the metal ion, whereas in the Zn2+-binding proteins, it points away from the metal binding site. Asp279 is monodentate in Spn-PsaA and Syn-MntC and bidentate in Tpa-TroA. The fourth ligand in ZnuA is either water [7, 13] or nonconserved Glu59 as described here and elsewhere [14]. The biological significance of interchanging Glu59 and water is not clear but could significantly modulate the Zn2+ binding affinity [48]. The third structural feature linked to specificity is the presence of the His-rich loop in the Zn2+ binding proteins [1, 2]. Although the presence of His at position 207 in Tpa-TroA suggests Zn2+ specificity, ligation by Asp279 and the absence of the His-rich loop indicate Mn2+ specificity. Thus, Tpa-TroA might transport both Zn2+ and Mn2+, which would be consistent with its similar binding affinities for the two metal ions [19]. It may be that nature has built flexibility into these proteins to handle different metal ions in response to availability and need. In particular, the use of carboxylate ligands opens up the possibility of monodentate or bidentate coordination depending on the metal ion.
Metal stoichiometry
Metal analysis, spectroscopic, and crystallographic data clearly indicate that Eco-ZnuA binds at least two metal ions, of which only one was detected in the previous ZnuA structures [13, 14]. This finding is consistent with the reported stoichiometry of 1.6–1.9 Zn2+ ions per molecule of the ZnuA homolog Hin-Pzp1 [4], which is 49.2% identical to Eco-ZnuA. In the present Eco-ZnuA structures, the second Zn2+ ion is coordinated by His224 and at least three additional ligands, presumably provided by the His-rich loop. The His-rich loop was suggested to play a role in metal acquisition [7] or in periplasmic zinc sensing [8] in Syn-ZnuA, but only a single Zn2+ ion was found to bind to this protein in the crystal structures. Of the other cluster 9 MBRs, His224 is only conserved in Vibrio cholerae ZnuA. The additional Zn2+ ligands at this site have not been identified, but the structures of ZnZnuA and spectroscopic data for CoZnuA suggest the involvement of His119, two carboxylate residues, and perhaps two water molecules. Coordinating water molecules are likely since the second metal binding site is solvent-exposed. It may be that the presence of multiple His, Asp, and Glu residues in the His-rich loop provides multiple options for Zn2+ binding, thus increasing the probability of metal acquisition.
Mechanistic implications
The structural and biochemical data presented here combined with previous reports [7, 10, 11, 15, 19] provide insight into the mechanism of metal acquisition and transport by Eco-ZnuA. The binding of Zn2+ in the main metal binding site of apoZnuA probably results in local conformational changes in the loop that houses ligands Glu59 and His60 (Fig. 3e). The rest of Eco-ZnuA, including the long connecting helix, is unaltered. Therefore, Eco-ZnuA does not function by the “Venus-flytrap” mechanism proposed for PLBPs from other clusters. Similar conclusions were drawn from the structures of apo and Zn2+-loaded Tpa-TroA [11, 15] and mutant Syn-ZnuA [8, 13] and are consistent with the idea that cluster 9 MBRs constitute an evolutionary distant group of ABC-type PLBPs [10]. The conservation of secondary-sphere interactions between apoZnuA and ZnZnuA suggests that the metal binding site is largely preformed prior to Zn2+ binding. In the two apoZnuA molecules, the β6α6 loop occupies position 1, whereas in three of the four ZnZnuA molecules, the loop is closed (position 2). The binding of the first Zn2+ is thus probably followed by a shift of the β6α6 loop from open position 1 to closed position 2 (Fig. 2b), shielding the metal site from solvent. The loop movement is accompanied by shifts in helices α6 and α7 (Fig. 2b) and subtle alterations in the main metal binding site such as the shift of His207 from position 1 to position 2 (Fig. 3b) and the movement of a water molecule away from the metal ion. These proposed conformational changes are consistent with the CD (Fig. 5) and ANS fluorescence (Fig. 11) data and might be necessary for interaction with ZnuB and subsequent metal release.
The role of the second metal binding site in Eco-ZnuA function is not clear. In the structures, the occupancy of this site is correlated with the closed position of the β6α6 loop. The orientation of α6 in the closed-loop position allows for the interaction between the side chain of Arg237 and the carbonyl oxygen of His224, the only visible ligand to the second Zn2+ ion, and may stabilize the second site. This site may only be filled after Zn2+ binds in the primary site, and its reduced occupancy in the structures implies a somewhat lower affinity for Zn2+. It is not known whether the second site needs to be occupied for delivery to ZnuB, but it seems unlikely since α6 and the β6α6 loop in Syn-ZnuA, Spn-PsaA, and Tpa-TroA with a single Zn2+ ion adopt conformations very similar to those in Eco-ZnuA with two bound Zn2+ ions (Fig. S7). It may be that the second site functions as a scavenger or chaperone, sequestering Zn2+ when periplasmic concentrations are limited. Biochemical and mutagenesis studies targeting the His-rich loop and its individual residues should further elucidate the functional importance of the second metal binding site.
In sum, the crystal structures of ZnZnuA reveal a second weakly occupied metal binding site not detected in the recent structures of Eco-ZnuA [13, 14]. This site, the existence of which is confirmed by metal analysis and spectroscopic data, likely involves the His-rich loop. Binding of Zn2+ stabilizes ZnuA, and the Zn2+ dissociation constant, Kd, is estimated to be less than 20 nM. Eco-ZnuA interacts with Co2+, Ni2+, Cu2+, Cu+, and Cd2+, but not Mn2+. Several structural changes in the C-terminal domain of Eco-ZnuA occur upon binding of the initial Zn2+ ion. Replacement of Zn2+ with Co2+ results in almost identical coordination geometry at the primary site. Although the second site is not occupied in the CoZnuA structure, EPR and EXAFS data on samples with Co2+ in the second site provide additional insight into possible ligands to the second site. Finally, fluorescence and CD data provide insight into metal ion specificity and conformational changes upon metal binding. Since homologs of Eco-ZnuA are found in numerous pathogens [1], a detailed understanding of its mechanism could impact the development of new antimicrobials.
Supplementary Material
The online version of this article (doi:10.1007/s00775-007-0320-0) contains supplementary material, which is available to authorized users.
Acknowledgments
This work was supported by National Institutes of Health Grants GM079411 (to M.W.C.), AI056231 and EB001980 (to B. B.), P20RR-16480 (to D.L.T.), and GM58518 (to A.C.R.). Use of the Advanced Photon Source was supported by the US Department of Energy, Office of Science, Office of Basic Energy Sciences under contract no. DE-AC02-06CH11357. We thank the staff at the APS DND-CAT, SBC-CAT, and GM/CA-CAT beamlines for assistance with data collection, P. Focia for preliminary data collection, the Northwestern Keck facility for use of the fluorimeter and UV/vis spectrometer, and J. Argüello, E. Eren, B. Mitra, and M. Golynskiy for valuable discussions.
Abbreviations
- ABC
ATP-binding cassette
- ANS
8-Anilino-1-naphthalenesulfonic acid
- apoZnuA
Apo form of ZnuA protein from Escherichia coli
- CD
Circular dichroism
- CoZnuA
Co2+-loaded form of ZnuA protein from Escherichia coli
- Eco-ZnuA
ZnuA protein from Escherichia coli
- EPR
Electron paramagnetic resonance
- EXAFS
Extended X-ray absorption fine structure
- HEPES
N-(2-Hydroxyethyl)piperazine-N′-ethanesulfonic acid
- Hin-Pzp1
Zn2+-binding protein from Haemophilus influenzae
- ICP-AES
Inductively coupled plasma atomic emission spectroscopy
- MBR
Metal-binding receptor
- MF
Mag-Fura-2
- MOPS
3-(N-Morpholino)propanesulfonic acid
- PDB
Protein Data Bank
- PEG
Poly(ethylene glycol)
- PLBP
Periplasmic ligand-binding proteins
- RMSD
RMS deviation
- Spn-PsaA
Mn2+-binding protein from Streptococcus pneumoniae
- Syn-MntC
Mn2+-binding protein from Synechocystis PCC sp. 6803
- Syn-ZnuA
Zn2+-binding protein from Synechocystis PCC sp. 6803
- Tpa-TroA
Mn2+-binding protein from Treponema pallidum
- Tris
Tris(hydroxymethly)aminomethane
- Znu
Zn2+-specific uptake system
- ZnZnuA
Zn2+-loaded form of ZnuA protein from Escherichia coli
Contributor Information
Liliya A. Yatsunyk, Departments of Biochemistry, Molecular Biology, and Cell Biology and of Chemistry, Northwestern University, Evanston, IL 60208, USA
J. Allen Easton, Department of Chemistry and Biochemistry, Miami University, Oxford, OH 45056, USA.
Lydia R. Kim, Departments of Biochemistry, Molecular Biology, and Cell Biology and of Chemistry, Northwestern University, Evanston, IL 60208, USA
Stacy A. Sugarbaker, Department of Chemistry and Biochemistry, Miami University, Oxford, OH 45056, USA
Brian Bennett, National Biomedical EPR Center, Department of Biophysics, Medical College of Wisconsin, Milwaukee, WI 53226, USA.
Robert M. Breece, Department of Chemistry and Chemical Biology, University of New Mexico, Albuquerque, NM 87131, USA
Ivan I. Vorontsov, Department of Molecular Pharmacology and Biological Chemistry, Northwestern University Feinberg School of Medicine, Chicago, IL 60611, USA
David L. Tierney, Department of Chemistry and Chemical Biology, University of New Mexico, Albuquerque, NM 87131, USA
Michael W. Crowder, Department of Chemistry and Biochemistry, Miami University, Oxford, OH 45056, USA, e-mail: crowdemw@muohio.edu
Amy C. Rosenzweig, Departments of Biochemistry, Molecular Biology, and Cell Biology and of Chemistry, Northwestern University, Evanston, IL 60208, USA, e-mail: amyr@northwestern.edu
References
- 1.Hantke K. Biometals. 2001;14:239–249. doi: 10.1023/a:1012984713391. [DOI] [PubMed] [Google Scholar]
- 2.Hantke K. Curr Opin Microbiol. 2005;8:196–202. doi: 10.1016/j.mib.2005.02.001. [DOI] [PubMed] [Google Scholar]
- 3.Patzer SI, Hantke K. Mol Microbiol. 1998;28:1199–1210. doi: 10.1046/j.1365-2958.1998.00883.x. [DOI] [PubMed] [Google Scholar]
- 4.Lu D, Boyd B, Lingwood CA. J Biol Chem. 1997;272:29033–29038. doi: 10.1074/jbc.272.46.29033. [DOI] [PubMed] [Google Scholar]
- 5.Kim S, Watanabe K, Shirahata T, Watarai M. J Vet Med Sci. 2004;66:1059–1063. doi: 10.1292/jvms.66.1059. [DOI] [PubMed] [Google Scholar]
- 6.Claverys JP. Res Microbiol. 2001;152:231–243. doi: 10.1016/s0923-2508(01)01195-0. [DOI] [PubMed] [Google Scholar]
- 7.Banerjee S, Wei B, Bhattacharyya-Pakrasi M, Pakrasi HD, Smith T. J Mol Biol. 2003;333:1061–1069. doi: 10.1016/j.jmb.2003.09.008. [DOI] [PubMed] [Google Scholar]
- 8.Wei B, Randich AM, Bhattacharyya-Pakrasi M, Pakrasi HB, Smith TJ. Biochemistry. 2007;46:8734–8743. doi: 10.1021/bi700763w. [DOI] [PubMed] [Google Scholar]
- 9.Tong L, Golden JW, Giedroc DP. Biochemistry. 2005;44:8673–8683. doi: 10.1021/bi050450+. [DOI] [PubMed] [Google Scholar]
- 10.Lawrence MC, Pilling PA, Epa VC, Berry AM, Ogunniyi AD, Paton JC. Structure. 1998;6:1553–1561. doi: 10.1016/s0969-2126(98)00153-1. [DOI] [PubMed] [Google Scholar]
- 11.Lee YH, Deka RK, Norgard MV, Radolf JD, Hasemann CA. Nat Struct Biol. 1999;6:628–633. doi: 10.1038/10677. [DOI] [PubMed] [Google Scholar]
- 12.Rukhman V, Anati M, Melamed-Frank M, Adir N. J Mol Biol. 2005;348:961–969. doi: 10.1016/j.jmb.2005.03.006. [DOI] [PubMed] [Google Scholar]
- 13.Chandra BR, Yogavel M, Sharma A. J Mol Biol. 2007;367:970–982. doi: 10.1016/j.jmb.2007.01.041. [DOI] [PMC free article] [PubMed] [Google Scholar]
- 14.Li H, Jogl G. J Mol Biol. 2007;368:1358–1366. doi: 10.1016/j.jmb.2007.02.107. [DOI] [PubMed] [Google Scholar]
- 15.Lee YH, Dorwart MR, Hazlett KR, Deka RK, Norgard MV, Radolf JD, Hasemann CA. J Bacteriol. 2002;184:2300–2304. doi: 10.1128/JB.184.8.2300-2304.2002. [DOI] [PMC free article] [PubMed] [Google Scholar]
- 16.Ledvina PS, Tsai AL, Wang Z, Koehl E, Quiocho FA. Protein Sci. 1998;7:2550–2559. doi: 10.1002/pro.5560071208. [DOI] [PMC free article] [PubMed] [Google Scholar]
- 17.Mao B, Pear MR, McCammon JA, Quiocho FA. J Biol Chem. 1982;257:1131–1133. [PubMed] [Google Scholar]
- 18.Sharff AJ, Rodseth LE, Spurlino JC, Quiocho FA. Biochemistry. 1992;31:10657–10663. doi: 10.1021/bi00159a003. [DOI] [PubMed] [Google Scholar]
- 19.Hazlett KRO, Rusnak F, Kehres DG, Bearden SW, La Vake CJ, La Vake ME, Maguire ME, Perry RD, Radolf JD. J Biol Chem. 2003;278:20687–20694. doi: 10.1074/jbc.M300781200. [DOI] [PubMed] [Google Scholar]
- 20.Otwinowski Z, Minor W. Methods Enzymol. 1997;276:307–326. doi: 10.1016/S0076-6879(97)76066-X. [DOI] [PubMed] [Google Scholar]
- 21.Sheldrick G, Schneider T. Methods Enzymol. 1997;277:319–343. [PubMed] [Google Scholar]
- 22.Grosse-Kunstleve RW, Adams PD. Acta Crystallogr Sect D. 2003;59:1966–1973. doi: 10.1107/s0907444903018043. [DOI] [PubMed] [Google Scholar]
- 23.de La Fortelle E, Bricogne G. Methods Enzymol. 1997;276:472–494. doi: 10.1016/S0076-6879(97)76073-7. [DOI] [PubMed] [Google Scholar]
- 24.Perrakis A, Morris R, Lamzin VS. Nat Struct Biol. 1999;6:458–463. doi: 10.1038/8263. [DOI] [PubMed] [Google Scholar]
- 25.McRee DE. J Struct Biol. 1999;125:156–165. doi: 10.1006/jsbi.1999.4094. [DOI] [PubMed] [Google Scholar]
- 26.Emsley PKC. Acta Crystallogr Sect D. 2004;60:2126–2132. doi: 10.1107/S0907444904019158. [DOI] [PubMed] [Google Scholar]
- 27.Brünger AT, Adams PD, Clore GM, Delano WL, Gros P, Grosse-Kunstleve RW, Jiang JS, Kuszewski J, Nilges N, Pannu NS, Read RJ, Rice LM, Simonson T, Warren GL. Acta Crystallogr Sect D. 1998;54:905–921. doi: 10.1107/s0907444998003254. [DOI] [PubMed] [Google Scholar]
- 28.4 CCPN. Acta Crystallogr Sect D. 1994;50:760–763. [Google Scholar]
- 29.Laskowski RA, MacArthur MW, Moss DS, Thornton JM. J Appl Crystallogr. 1993;26:283–291. [Google Scholar]
- 30.Storoni LC, McCoy AJ, Read RJ. Acta Crystallogr Sect D. 2004;60:432–438. doi: 10.1107/S0907444903028956. [DOI] [PubMed] [Google Scholar]
- 31.Kleywegt GJ, Jones TA. CCP4/ESF-EACBM Newsl Protein Crystallogr. 1994;31:9–14. [Google Scholar]
- 32.Ramsay GD, Eftink M. Methods Enzymol. 1994;240:615–645. doi: 10.1016/s0076-6879(94)40066-0. [DOI] [PubMed] [Google Scholar]
- 33.Liu J, Stemmler AJ, Fatima J, Mitra B. Biochemistry. 2005;44:5159–5167. doi: 10.1021/bi0476275. [DOI] [PubMed] [Google Scholar]
- 34.Liu J, Dutta SJ, Stemmler AJ, Mitra B. Biochemistry. 2006;45:763–772. doi: 10.1021/bi051836n. [DOI] [PubMed] [Google Scholar]
- 35.Dutta SJ, Liu J, Hou Z, Mitra B. Biochemistry. 2006;45:5923–5931. doi: 10.1021/bi0523456. [DOI] [PubMed] [Google Scholar]
- 36.Walkup GK, Imperiali B. J Am Chem Soc. 1997;119:3443–3450. [Google Scholar]
- 37.Kuzmic P. Anal Biochem. 1996;237:260–273. doi: 10.1006/abio.1996.0238. [DOI] [PubMed] [Google Scholar]
- 38.Brenner AJ, Harris ED. Anal Biochem. 1995;226:80–84. doi: 10.1006/abio.1995.1194. [DOI] [PubMed] [Google Scholar]
- 39.Smith PK, Krohn RI, Hermanson GT, Mallia AK, Gartner FH, Provenzano MD, Fujimoto EK, Goeke NM, Olson BJ, Klenk DC. Anal Biochem. 1985;150:76–85. doi: 10.1016/0003-2697(85)90442-7. [DOI] [PubMed] [Google Scholar]
- 40.Costello AL, Periyannan G, Yang KW, Crowder MW, Tierney DL. J Biol Inorg Chem. 2006;11:351–358. doi: 10.1007/s00775-006-0083-z. [DOI] [PubMed] [Google Scholar]
- 41.Thomas PW, Stone EM, Costello AL, Tierney DL, Fast W. Biochemistry. 2005;44:7559–7565. doi: 10.1021/bi050050m. [DOI] [PubMed] [Google Scholar]
- 42.Ankudinov AL, Ravel B, Rehr JJ, Conradson SD. Phys Rev B. 1998;58:7565–7576. [Google Scholar]
- 43.Dudev T, Lim C. Chem Rev. 2003;103:773–787. doi: 10.1021/cr020467n. [DOI] [PubMed] [Google Scholar]
- 44.Auld DS. Biometals. 2001;14:271–313. doi: 10.1023/a:1012976615056. [DOI] [PubMed] [Google Scholar]
- 45.Seny D, Heinz U, Wommer S, Kiefer M, Meyer-Klaucke W, Galleni M, Frere JM, Bauer R, Adolph HW. J Biol Chem. 2001;276:45065–45078. doi: 10.1074/jbc.M106447200. [DOI] [PubMed] [Google Scholar]
- 46.Simons TJ. J Biochem Biophys Methods. 1993;27:25–37. doi: 10.1016/0165-022x(93)90065-v. [DOI] [PubMed] [Google Scholar]
- 47.Dintlhac A, Alloing G, Granadel C, Claverys JP. Mol Microbiol. 1997;25:727–739. doi: 10.1046/j.1365-2958.1997.5111879.x. [DOI] [PubMed] [Google Scholar]
- 48.Ippolito JA, Baird TT, McGee SA, Christianson DW, Fierke CA. Proc Natl Acad Sci USA. 1995;92:5017–5021. doi: 10.1073/pnas.92.11.5017. [DOI] [PMC free article] [PubMed] [Google Scholar]
Associated Data
This section collects any data citations, data availability statements, or supplementary materials included in this article.
Supplementary Materials
The online version of this article (doi:10.1007/s00775-007-0320-0) contains supplementary material, which is available to authorized users.