

Abstract
In the United States, about 25% of infant formula sold is based on soy protein, which is an important source of estrogenic isoflavones in the human food supply. Nevertheless, few studies report isoflavones levels in infants. We did a partly cross-sectional, partly longitudinal pilot study to examine children’s exposure to isoflavones from different feeding methods. One hundred sixty-six full term infants between birth and 1 year of age were recruited into soy formula, cow milk formula or breast milk regimens according to their feeding histories. Three hundred eighty-one urine, 361 saliva and 88 blood samples were collected at 382 visits. We used automated online SPE coupled to HPLC-MS/MS for measuring three isoflavones (daidzein, genistein, and equol) in urine, and use similar LC/MS/MS techniques for saliva and blood spots . Concentrations of daidzein and genistein were undetectable in most blood or saliva samples from children fed breast milk or cow-milk formula. The proportion of non-detectable values was somewhat lower in urine than the other matrices. Concentrations of equol were detectable in only a few urine samples. For both daidzein and genistein, urine contained the highest median concentrations, followed by blood, and then saliva. Urinary concentrations of genistein and daidzein were about 500 times higher in the soy-formula-fed infants than in the cow-milk-formula-fed infants. The correlations between matrices for either analyte were strikingly lower than the correlation between the two analytes in any single matrix. We did not find significant correlations between isoflavone concentrations and the levels of certain hormones in children fed soy formula. Our results, based on much larger numbers of infants, strongly confirm previous reports, but whether the phytoestrogens in soy formula are biologically active in infants is still an open question. We plan further longitudinal studies focusing on physical and developmental findings reflecting the effects of estrogen exposure.
Keywords: phytoestrogen, isoflavone, genistein, daidzein, infant feeding, soy formula
Introduction
Compounds in plants that have estrogenic activity are called phytoestrogens. The main phytoestrogens in the human food supply are isoflavones, along with some lignans and coumestans.(Kurzer & Xu, 1997) Isoflavones are based on tricyclic polyphenols; the “flavone” designation is due to the yellow color of some compounds. Soybeans are the most concentrated source of isoflavones that humans commonly consume, and the isoflavones in them at highest concentration are genistein and daidzein. Genistein in particular has been well studied for estrogen-like properties, including occupancy of the human estrogen receptors (mostly β). Although genistein is 4-5 orders of magnitude less potent than estradiol(Welshons et al., 1990; Mayr et al., 1992; Thomas, 1997), it occurs at sufficiently high concentrations that soy foods are used as a source of natural replacement estrogen by some perimenopausal women(Balk et al., 2005).
Adults rarely exceed 25% of their total calories from soy protein(Cook, 1981), but infants fed soy formula get 100%. In the United States, about 25% of infant formula sold is based on soy protein.(American Academy of Pediatrics. Committee on Nutrition, 1998) Soy formula is generally thought to be safe, and for more than 60 years of use in the United States it has not been associated with illness except for goiter, a problem resolved by re-formulation.(Klein, 1998; Miniello et al., 2003; Merritt & Jenks, 2004) The estimated daily estrogenic exposure from a diet consisting exclusively of soy formula, however, ranges from 0.01 to more than one modern hormonal contraceptive pill per day on a dose per kg basis, depending on the potency estimate used.(Setchell et al., 1997; Irvine et al., 1998)
Infants absorb and excrete the estrogenic isoflavones in soy formula. Irvine et al. reported that infants as young as four weeks old can digest, absorb, and excrete genistein and daidzein from soy-based infant formulas as effectively as do adults consuming soy products.(Irvine et al., 1998) Most data from infants consist of urine concentrations, which may not reflect concentrations at the site of action. We wished to estimate children’s exposure to these compounds from soy formula and also to investigate the degree to which urinary concentration reflected blood or saliva concentration. These latter matrices may follow concentration at the site of action more closely than urine does. We thus did a pilot study in which we collected samples of urine, whole blood, and saliva with methods developed for use in a clinical research setting. Our primary aims were to document that our sample collection methods worked and were feasible, to confirm the large difference in isoflavone excretion between soy-fed and any other infants, and to assess the relation of the isoflavone concentrations among the three biological matrices.
This study is part of a larger study that includes physical examination of a sample of the infants on whom we have isoflavone measurements, and hormone measurement on the same samples on which we have isoflavone measures. A secondary aim of this study was to assess possible relationships between isoflavone concentrations and concentrations of sex hormones and gonadotropins.
Materials and Methods
Design and Subjects
The Soy Estrogen and Development (SEAD) specimen collection study was a pilot study carried out at the Children’s Hospital of Philadelphia (CHOP) and its affiliated clinics, with the laboratory assays done at the Division of Laboratory Sciences of the Centers for Disease Control and Prevention (CDC) in Atlanta, GA and at the National Center for Toxicological Research (NTCR) of the Food and Drug Administration (FDA) in Jefferson, AR. The entire study was cleared by the institutional review boards at CHOP and at the National Institute of Environmental Health Sciences (NIEHS). The involvement of the CDC and FDA laboratories was limited and it was determined that it did not constitute engagement in human subjects research.
Although the data we wanted were longitudinal in nature, we opted for a less precise but much less time-consuming partly cross-sectional design, with up to four visits allowed per child. SEAD had 31 examination age intervals (<48 hours; weekly for six months; then monthly to one year) each of which included 6 boys and 6 girls. Eligibility bands for age intervals were tighter at the younger ages and then relaxed (Table 1).
Table 1.
Scheduled age intervals and number of infants recruited in each.
| Scheduled age | Acceptance range | Breast fed | Cow milk fed | Soy fed | Total | |||
|---|---|---|---|---|---|---|---|---|
| Boy | Girl | Boy | Girl | Boy | Girl | |||
| <48 hour (<2 d) | <2 d | 2 | 2 | 3 | 2 | 2 | 3 | 14 |
| 1 wk (7 d) | 2 < age ≤10 d | 2 | 3 | 3 | 2 | 2 | 2 | 14 |
| 2 wk (14 d) | 10< age≤17 d | 2 | 2 | 2 | 2 | 2 | 2 | 12 |
| 3 wk (21 d) | 17<age≤24 d | 2 | 2 | 2 | 2 | 2 | 2 | 12 |
| 4 wk (28 d, 1 mo) | 24<age≤31 d | 2 | 2 | 2 | 3 | 2 | 2 | 13 |
| 5 wk (35 d) | 31<age≤38 d | 2 | 2 | 2 | 2 | 2 | 2 | 12 |
| 6 wk (42 d) | 38<age≤45 d | 2 | 2 | 2 | 2 | 2 | 2 | 12 |
| 7 wk (49 d) | 45<age≤52 d | 4 | 2 | 2 | 2 | 2 | 2 | 14 |
| 8 wk (56 d, 2 mo) | 52<age≤59 d | 2 | 2 | 2 | 2 | 2 | 2 | 12 |
| 9 wk (63 d) | 59<age≤66 d | 2 | 2 | 2 | 2 | 2 | 2 | 12 |
| 10 wk (70 d) | 66<age≤73 d | 2 | 3 | 2 | 2 | 2 | 2 | 13 |
| 11 wk (77 d) | 73<age≤80 d | 2 | 2 | 2 | 2 | 2 | 2 | 12 |
| 12 wk (84 d, 3 mo) | 80<age≤87 d | 2 | 2 | 2 | 2 | 2 | 2 | 12 |
| 13 wk (91 d) | 87<age≤94 d | 2 | 2 | 2 | 2 | 2 | 2 | 12 |
| 14 wk (98 d) | 94<age≤101 d | 2 | 2 | 2 | 2 | 2 | 2 | 12 |
| 15 wk (105 d) | 101<age≤108 d | 2 | 2 | 2 | 2 | 2 | 2 | 12 |
| 16 wk (112 d, 4 mo) | 108<age≤115 d | 2 | 2 | 2 | 2 | 2 | 2 | 12 |
| 17 wk (119 d) | 115<age≤122 d | 2 | 2 | 2 | 3 | 2 | 2 | 13 |
| 18 wk (126 d) | 122<age≤129 d | 2 | 2 | 2 | 2 | 2 | 2 | 12 |
| 19 wk (133 d) | 129<age≤136 d | 2 | 2 | 2 | 2 | 2 | 2 | 12 |
| 20 wk (140 d, 5 mo) | 136<age≤143 d | 3 | 2 | 2 | 2 | 2 | 2 | 13 |
| 21 wk (147 d) | 143<age≤150 d | 2 | 2 | 2 | 2 | 2 | 2 | 12 |
| 22 wk (154 d) | 150<age≤157 d | 2 | 2 | 2 | 2 | 2 | 2 | 12 |
| 23 wk (161 d) | 157<age≤164 d | 2 | 2 | 2 | 2 | 2 | 2 | 12 |
| 24 wk (168 d, 6 mo) | 164<age≤182 d | 2 | 2 | 2 | 2 | 2 | 2 | 12 |
| 28 wk (196 d, 7 mo) | 26<age≤30 wk (182<age≤210 d) | 2 | 2 | 2 | 2 | 2 | 2 | 12 |
| 32 wk (224 d, 8 mo) | 30<age≤34 wk (210<age≤238 d) | 2 | 2 | 2 | 2 | 2 | 2 | 12 |
| 36 wk (252 d, 9 mo) | 34<age≤38 wk (238<age≤266 d) | 2 | 2 | 2 | 2 | 2 | 2 | 12 |
| 40 wk (280 d, 10 mo) | 38<age≤42 wk (266<age≤294 d) | 2 | 2 | 2 | 2 | 2 | 2 | 12 |
| 44 wk (308 d, 11 mo) | 42<age≤46 wk (294<age≤322 d) | 2 | 2 | 2 | 2 | 2 | 2 | 12 |
| 48 wk (336 d, 12 mo) | 46<age≤54 wk (322<age≤378 d) | 2 | 2 | 2 | 2 | 2 | 2 | 12 |
| Total | 65 | 64 | 64 | 64 | 62 | 63 | 382 | |
Children were recruited from the catchments of the Hospital of the University of Pennsylvania newborn nursery, the clinics at CHOP, and several CHOP satellite clinics. Eligibility requirements for children included: born between 37 weeks and 41 weeks gestation, birth weight between 2500 and 4500 grams, and free of any major illness or birth defects that might interfere with growth, development, or feeding. In addition, males were required to have palpable testes. We used flyers, word of mouth including information sessions conducted by the site investigator and targeted at the clinic staff, and a computer-generated inquiry directed at the physician at the time he/she was logging on to a patient’s record. It reminded the physician that the child might be eligible for this research study. We obtained informed consent from at least one parent. Families were compensated for meal and travel expenses and given coupons for local food stores.
In order to prevent the pilot from consisting of nearly all breast-fed newborns and all cow-milk-formula-fed older children, we required that one-third of the children seen at each age interval be fed breast milk, cow-milk formula, or soy-formula. Since we anticipated that older infants who had never had anything but soy formula or breast milk would be rare, we allowed pre-determined, arbitrary but relatively small amounts of other feedings that would allow an older child to remain in a category (Table 2). Study staff knew what the infant was being fed, since recruitment was partly based on feeding status.
Table 2.
Feeding Category Definitions
| Milk source: | Age at exam: | Note: |
|---|---|---|
| Breast-milk category | ||
| Breast milk exclusively | 0 – 48 hrs | Restriction: Babies in the Breast milk category are not allowed to have had any soy foods including soy formula and solid foods containing soy in their lifetime. |
| Breast milk exclusively | 49 hrs – 3 months | |
| Breast milk exclusively OR | > 3 months | |
| Breast milk and Cow-milk formula | ||
| Cow-milk-formula category | ||
| Cow-milk formula exclusively | 0 – 48 hrs | Exception: If a baby was breastfed in the nursery, the baby must have gone home on cow-milk formula and have been on cow-milk formula exclusively ever since. Such a child cannot participate until s/he has been fed exclusively cow-milk formula for at least 2 weeks. Restriction: Babies in the cow-milk-formula category are not allowed to have had any soy foods including soy formula and solid foods containing soy in their lifetime. |
| Cow-milk formula exclusively | 49 hrs – 3 months | |
| Cow-milk formula exclusively | > 3 months | |
| Soy-formula category | ||
| Soy formula exclusively | 0 – 48 hrs | |
| Soy formula exclusively | 49 hrs – 3 months | Exception: If a baby was fed something other than soy formula in the nursery, the baby must have gone home on soy and been on soy exclusively ever since. Such a child cannot participate until s/he has been fed exclusively soy formula for at least 2 weeks. |
| 2/3 of lifetime on soy formula exclusively & continuously, and including the two weeks up to the exam | > 3 months |
Sample collection
Samples were collected at 382 visits (10 more than planned, because of some inadvertent extra scheduling); urine was collected at 381 and saliva at 359 visits. The laboratory received duplicate saliva samples for two visits for a total of 361 saliva samples analyzed. For the duplicates, we used the data from the one with the most detectable values. We collected 88 blood samples on Guthrie cards in total. Of these, 62 came as originally planned from one boy and one girl in each examination interval; 26 extra samples accrued because we substituted a blood sample for a saliva sample in some of the youngest infants (birth to week 12), who tended to have less saliva. Specimens were collected in the following order: blood, urine and then saliva. We initially thought that saliva was going to be the most traumatic collection and so left it until the end of the visit.
We collected urine using two methods. The first was an absorbent cotton diaper, which was sent to the family before the study visit with instructions to put it on the child the morning of their clinic visit about 30 minutes after the first morning feeding. Parents brought the diaper to the clinic visit. At the clinic, the study nurse cut away the wet parts, avoiding any soiled areas, and put them into a 60 cc syringe. The pieces were compressed and the urine collected in 5.0 ml aliquots. If the diaper was soiled such that no clean but wet spot would yield 5 ml, another diaper (girls) or urine bag (boys) was placed on the child. We required a minimum of 5.0 ml. Urine bags were used on all newborn infants and at the discretion of the parents for infants coming to clinic with no previously collected urine samples. All urine samples were frozen to -70°C. Urine that could not be frozen immediately (because the visit was in a satellite clinic) was stored in a cooler at 4°C until it could be frozen.
We collected saliva at least one hour after feeding. We used a custom vacuum saliva collection device, developed and fabricated at the Clinical Center of the NIH.(Wolff et al., 1997) We swabbed the mouth to remove any remaining formula, placed the collecting tube on the side of the infant’s mouth being careful not to touch the inside of the cheek, and applied gentle suction (Figure 1). This device was used for up to 30 minutes or until 2 ml of saliva was collected. We believed that saliva could readily be collected from all infants. However, the youngest breast-fed infants tended to have relatively dry mouths, and collection from them was often prolonged and sometimes traumatic. Blood collection, however, with the ultra sharp lancets and P.O. sucrose solution provoked little or no evidence of discomfort. As a result, the protocol was modified to collect blood from children from whom little or no saliva could be obtained after 30 minutes of trying.
Figure 1.

Saliva collection device
Each blood sample was collected onto two Guthrie Cards. The child’s heel or great toe was warmed using a commercially available foot warmer, wiped with an alcohol prep pad, dried with a sterile gauze pad, and pricked with an ultra-sharp lancet. Blood was dropped onto the Guthrie card until 4 of the circles were filled on each card. Blood cards were placed in a sealed bag with a desiccant and stored at room temperature. For younger infants, a P.O. sucrose solution applied to a finger tip was put in the child’s mouth to suck during the heel prick and blood collection.
Isoflavone analysis
Urine
CDC researchers, who had no access to participant data, conducted the urinary measurements. The volume used for urine analysis was 0.5 mL. The methodology used automated online solid-phase extraction (SPE) coupled to isotope dilution–high-performance liquid chromatography–tandem mass spectrometry (HPLC-MS/MS) for measuring three isoflavones (daidzein, genistein, and equol) in urine. Briefly, the conjugated species of the isoflavones in urine were enzymatically hydrolyzed using β-glucuronidase/sulfatase (Helix pomatia, H1). After hydrolysis, the analytes of interest were preconcentrated by online SPE, separated by reversed-phase HPLC, and detected by isotope-dilution atmospheric pressure chemical ionization–MS/MS. The SPE recoveries were 83–94%, and coefficients of variation were 4–12%. Limits of detection were 1.6, 0.8, and 3.3 ng/ml for daidzein, genistein, and equol, respectively. To ensure the quality of the data, quality control materials and two reagent blanks with each batch of SEAD samples were analyzed. No any isoflavone conjugates in the reagent blanks (which included the enzyme spiking solution) was detected. Details of the analytical method and its validation are reported elsewhere.(Kuklenyik et al., 2004)
Blood and saliva
NCTR researchers, who had no access to participant data, conducted the blood and saliva isoflavone measurements by using liquid chromatography-electrospray tandem mass spectrometry with isotope dilution from labeled internal standards. Dried blood spot samples on filter paper were analyzed for total genistein, daidzein, and equol following glucuronidase/sulfatase hydrolysis. The cored blood spot was placed into a borosilicate tube (12 × 75 mm) and 1 ml of citrate buffer was added (25 mM, pH 5.0 containing 100 μg Helix pomatia glucuronidase/sulfatase and the labeled internal standards) and incubated for 4 h at 37 °C. The solution was then extracted three times with 1.0 ml of ethyl acetate, the combined extracts were evaporated and finally reconstituted in 100 μl of 50% aqueous methanol from which 90 μl were injected using LC and MS parameters previously published (Twaddle et al., 2002). The method was validated for volume contained in a ¼ inch diameter whole blood spot (5.3 μl) cored from within the whole spot by comparing with the LC/MS/MS responses for genistein and daidzein from a whole known volume spot (10 μl) of plasma obtained from a volunteer who had consumed a soy dietary supplement. The accuracy of measurement for genisten, daidzein, and equol was determined by adding internal standards to replicate blood spots (n = 4) before and after extraction (91-104% with precision of 4-6% relative standard deviation). The precision for within spot (n = 3) and between spot (n = 4) analyses were determined for genistein and daidzein to be 4-9% and 5-14%, respectively, using blood spots from two volunteers after consuming a soy dietary supplement. Detection limits for blood spot analysis, estimated to yield a signal/noise ratio of 3, of genistein, daidzein, and equol were 27, 10, and 12 ng/ml. The values obtained from analysis of blood spots represent the concentration in whole blood and need correction for hematocrit in order to compare with serum or plasma values from other studies. Saliva samples (50 μl) were analyzed by using the same procedure reported for total plasma isoflavones (Twaddle et al., 2002). The accuracy for analysis of genistein, daidzein, and equol added to blank saliva were determined to be greater than 90% and the precision was determined to be <10% relative standard deviation. The corresponding detection limits for genistein, daidzein, and equol were approximately 1.4, 0.8, and 3.6 ng/ml.
Statistical Methods and Data Analysis
Our data analysis had two primary goals. First, we wanted to characterize the concentrations of the three isoflavones in infants from the three feeding groups as determined from each matrix and to examine whether isoflavone concentrations varied with the age of the child. Second, we wanted to examine the correlation between the concentrations of the three analytes in the various matrices. Concentrations of isoflavones can be low in infants, particularly those not fed soy formula; consequently, a high proportion of the data can be censored, that is, samples can have isoflavones concentrations below the method’s limits of detection. An additional feature is the partly cross-sectional, partly longitudinal nature of our study design: calculation of standard errors and p values should take into account possible correlations among several samples from the same subject. Although well-established statistical approaches are available for dealing separately with either censoring or within-subject correlations, approaches for dealing with these two features simultaneously are limited. Thus, we restricted our analyses primarily to graphical displays and descriptive statistics that are straightforward to compute and make a minimum of distributional assumptions.
To describe the concentrations of each analyte, we computed the 25th, 50th (median), and 75th percentiles of the sample values. These calculations are based on the ranks of the data and so allow for censoring. Because these calculations do not account for possible within-subject correlations, they do not provide appropriate p-values for testing differences between feeding methods. We looked for age trends in isoflavone concentrations within each feeding group using mixed-model analyses that account for within-subject correlations. We arbitrarily substituted half the limit of detection for censored values. These mixed-model analyses do not properly account for censoring but are a satisfactory approximation as long as the proportion of non-detectable values is small.(Lubin et al., 2004) In an attempt to screen for trend estimates subject to bias from excessive censoring, we also used regression methods that are appropriate for left-censored data but that fail to account for within-subject correlation.(Lubin et al., 2004) Neither of these approaches is fully satisfactory for data with both censoring and within-subject correlations, so we regard our results on age trends cautiously whenever censoring exceeds 5%. All analyte concentrations were more symmetrically distributed after log transformation, so we used log-transformed values for our trend analyses that assume normally distributed errors. To examine correlations between analytes or between matrices, we used the non-parametric Kendall’s tau-b correlation coefficient (ktau-b), which makes no assumption of linearity between variables and accommodates multiply-censored data. (Helsel, 2004) Note that the p-values we report do not properly account for within-subject correlation. We used Stata version 9.2 and SAS version 9.13 for statistical calculations.
Results
From a total of 382 visits by 165 children, we collected 381 urine samples, 359 saliva samples, and 88 blood samples. For example, among 165 children contributing urine samples, 66 were in once, 28 twice, 25 three times, and 46 four times (Table 3). We collected saliva from 152 children at 359 visits (but we have data on 361 sample aliquots as two visits (samples) were represented by two aliquots each). We have fewer saliva samples than urine samples because of the difficulty collecting a sufficient volume of saliva from the youngest, particularly breast-fed children. Expecting blood draw to be unacceptable to many parents, we designed for 62 samples but collected 88 blood samples from 72 children. Because the blood-draw procedure turned out to be acceptable, we substituted a blood sample for a saliva sample for some infants who failed to produce enough saliva.
Table 3.
Number of infants with single or multiple visits by biological matrix.
| Number of visits per child | Urine | Saliva | Blood |
|---|---|---|---|
| One | 66 | 59 | 61 |
| Two | 28 | 22 | 7 |
| Three | 25 | 28 | 3 |
| Four | 46 | 43 | 1 |
| Total Infants | 165 | 152 | 72 |
| Total Visits* | 381 | 359 | 88 |
Each child had one sample (aliquot) from each matrix analyzed on each visit except for saliva where two aliquots of two saliva samples were analyzed bringing the total to 361.
Most samples could be analyzed for all three analytes; however, only 77 of 88 blood samples were adequate for analysis, and equol urinary concentrations could not be estimated for four urine samples because of a chromatographic interference. For these urine samples, the ratio between quantitation and confirmation ions for equol was outside the normal ranges. Therefore, these equol results, which did not fulfill the QA/QC criteria, could not be reported. Nevertheless, many isoflavone concentrations were censored at the method’s limit of detection (Table 4). Concentrations of equol, which requires metabolism of daidzein by the intestinal microflora, were below the limit of detection in 100% of blood and saliva samples for all three feeding groups. We observed detectable concentrations of equol in only 35 (9%) of 377 urine samples: two from breast-fed children, 27 from cow-milk-formula-fed children, and six from soy-formula-fed children. These 35 samples represented 26 children who ranged in age from two to 377 days. Because of the high proportion of non-detectable values, we do not consider equol further.
Table 4.
Proportion of samples from each matrix and feeding method where concentrations of daidzein, genistein, or equol were below the limit of detection.
| Analyte | Matrix | LOD* (ng/ml) | Feeding Method |
||||||||
|---|---|---|---|---|---|---|---|---|---|---|---|
| Breast milk |
Cow-milk formula |
Soy formula |
|||||||||
| Number of samples |
Percent <LOD(%) | Number of samples |
Percent <LOD(%) | Number of samples |
Percent <LOD(%) | ||||||
| Analyzed | <LOD | Analyzed | <LOD | Analyzed | <LOD | ||||||
| Daidzein | Blood | 10 | 20 | 19 | 95 | 30 | 29 | 97 | 27 | 1 | 4 |
| Saliva | 0.76 | 121 | 113 | 93 | 120 | 111 | 93 | 120 | 20 | 17 | |
| Urine | 1.6 | 128 | 90 | 70 | 128 | 28 | 22 | 125 | 0 | 0 | |
| Genistein | Blood | 27 | 20 | 19 | 95 | 30 | 27 | 90 | 27 | 0 | 4 |
| Saliva | 1.4 | 121 | 118 | 98 | 120 | 114 | 95 | 120 | 11 | 9 | |
| Urine | 0.8 | 128 | 65 | 51 | 128 | 12 | 9 | 125 | 0 | 0 | |
| Equol | Blood | 12 | 20 | 20 | 100 | 30 | 30 | 100 | 27 | 27 | 100 |
| Saliva | 3.6 | 121 | 121 | 100 | 120 | 120 | 100 | 120 | 120 | 100 | |
| Urine | 3.3 | 128 | 126 | 98 | 125 | 98 | 78 | 124 | 118 | 95 | |
Limit of detection.
Concentrations of daidzein were undetectable in blood or saliva for at least 93% of samples from children fed breast milk or cow-milk formula but was undetectable in fewer than 17% of samples from children fed soy formula (Table 4). Similarly, genistein concentrations were undetectable in blood or saliva for at least 90% of samples from children fed breast milk or cow-milk formula but undetectable for fewer than 9% of samples from children fed soy formula. The proportion on non-detectable values was somewhat lower in urine than the other matrices. Among breast-fed children, concentrations of daidzein and genistein were non-detectable in 70% and 51% of samples, respectively; among cow-milk-formula-fed children the corresponding proportions were 22% and 9%, and among soy-formula fed children, daidzein and genistein concentrations exceeded the limit of detection in every sample. Because of non-detectable values, we compare the feeding groups using only urinary concentration data, and we compare urine, blood, and saliva using only the soy-formula-fed group.
In general, based on median values (Table 5), urinary concentrations of genistein and daidzein were about 500 times higher in the soy-formula-fed infants than in the cow-milk-formula-fed infants. Based on 75th percentiles (medians were below the limit of detection; Table 5), urinary concentrations of genistein and daidzein were about six to ten times higher in infants fed cow-milk formula than in infants fed breast milk. Genistein concentrations in urine were relatively constant through time for all three feeding methods (Figure 2). We observed a slight decrease in urinary genistein concentrations with age among the soy-formula-fed infants but a slight increase with age among infants in the other two feeding groups (Figure 2). Genistein concentrations were highly correlated with daidzein concentrations in all three matrices (Figure 3); and concentration trajectories of daidzein exhibited the same weak temporal patterns as genistein (data not shown). These patterns are consistent with the expectation that older infants in each feeding group are beginning to have more varied diets and no longer consume exclusively soy or exclusively non-soy diets.
Table 5.
Quartiles of daidzein and genistein concentrations among samples from each matrix and feeding method.
| Analyte | Matrix | LOD* (ng/ml) | Percentiles |
||||||||
|---|---|---|---|---|---|---|---|---|---|---|---|
| Breast milk |
Cow-milk formula |
Soy formula |
|||||||||
| 25th | median | 75th | 25th | median | 75th | 25th | median | 75th | |||
| Daidzein | Blood | 10 | - | - | - | - | - | - | 178.5 | 274.8 | 518.7 |
| Saliva | 0.76 | - | - | - | - | - | - | 1.0 | 6.2 | 18.3 | |
| Urine | 1.6 | - | - | 2.2 | 2.6 | 10.6 | 22.4 | 3630 | 5590 | 8070 | |
| Genistein | Blood | 27 | - | - | - | - | - | - | 405.3 | 890.7 | 1455.1 |
| Saliva | 1.4 | - | - | - | - | - | - | 4.0 | 10.9 | 33.5 | |
| Urine | 0.8 | - | - | 5.6 | 5.6 | 13.6 | 32.4 | 3390 | 7220 | 11300 | |
Limit of detection.
Figure 2.
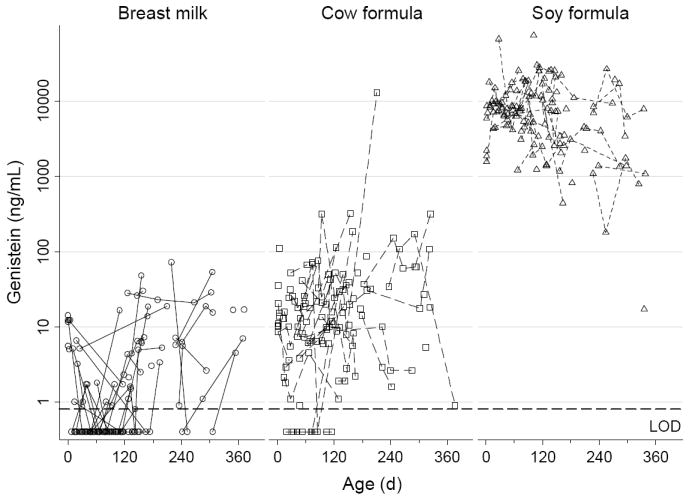
Individual urinary genistein concentrations for each feeding group plotted against age
Figure 3.

Comparison of genistein and daidzein levels in individual samples.
We compared isoflavone concentrations between blood, saliva, and urine using only the soy-formula-fed infants to minimize potential biases from censored data. For both daidzein and genistein, urine had the highest median concentrations, followed by blood, and saliva had the lowest median concentrations (Table 5). For genistein, the urine:blood:saliva median concentration ratios were about 900:40:1; for daidzein, the corresponding ratios were about 660:80:1. All three matrices showed a slightly decreasing trend in genistein concentration with age (Figure 2, 4); the same pattern holds for daidzein (data not shown).
Figure 4.

Genistein level in saliva and blood samples of soy formula fed infants
We examined the correlation of isoflavone concentrations between matrices and again restricted attention to infants fed soy formula (Table 6 and Figure 5). Our design which limited the number of blood samples available provides the most information about the saliva-urine correlations and less about correlations involving blood. Generally speaking, urine concentrations were more strongly correlated with blood or saliva concentrations for genistein than for daidzein. This difference may be because the half-life of blood genistein (8.4h) was longer than that of daidzein (5.8h).(Watanabe et al., 1998) The blood-saliva correlations were, however, comparable for both analytes (Table 6). Nevertheless, the correlations between matrices for either analyte were strikingly lower that the correlation between the two analytes in the single matrix (compare Figure 4 and Figure 5).
Table 6.
Correlations (Kendall’s tau-b) of genistein or daidzein levels between matrices for samples from soy-fed infants (number of paired samples).
| Urine & Saliva | Urine & Blood | Saliva & Blood | ||
|---|---|---|---|---|
| Genistein | Male | 0.25 (57)* | 0.37 (21)* | 0.24 (17) |
| Female | 0.05 (62) | 0.20 (6) | 0.07 (6) | |
| Combined | 0.15 (119)* | 0.33 (27)* | 0.25 (23) | |
| Daidzein | Male | 0.11 (57) | −0.04 (21) | 0.26 (17) |
| Female | 0.00 (62) | −0.20 (6) | 0.20 (6) | |
| Combined | 0.07 (119) | −0.02 (27) | 0.27 (23) | |
P<0.05
Figure 5. Pairwise comparison of genistein levels in urine, saliva, and blood using individual samples from soy-fed infants.

*x, value of analyte on horizontal axis; y, value of analyte on vertical axis. In saliva samples, there are several readable equipment values <LOD but >1/2LOD reported by laboratory. Instead of replacing them with 1/2LOD we keep the original values.
We also looked for relationships between isoflavone concentrations and the levels of sex hormone binding globulin and certain hormones (estrone, estradiol, testosterone) and gonadotropins (LH, FSH) in children fed soy formula. We found no significant correlations, either separately by sex or combined. The relationship between genistein and testosterone (Figure 6) was typical of those between the isoflavones and hormones.
Figure 6. Correlation of genistein levels and testosterone levels in urine, saliva, and blood using individual samples from soy-fed infants.
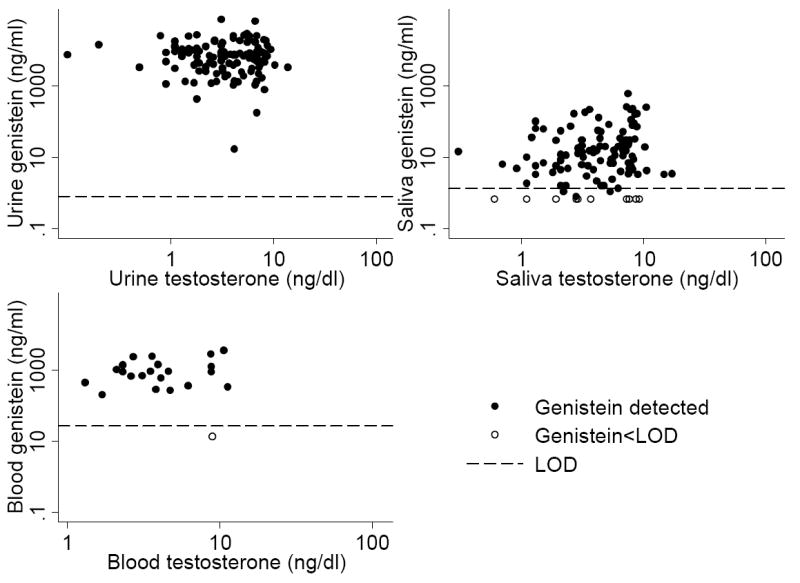
*See previous note.
Discussion
In this relatively large study of children from birth to 1 year, we find much higher concentrations of soy isoflavones in soy fed infants’ blood, urine, and saliva than in samples from breast fed infants or those fed cow-milk based formula. Among soy fed infants, saliva and blood concentrations correlate well with each other, but neither correlates with urine concentrations, when all 3 biological specimens are collected at the same time. Genistein and daidzein are readily detectable in almost all samples from soy fed children; equol, the product of bacterial metabolism of daidzein and a more potent estrogen than its parent compound, is found infrequently, only in urine, and is not limited to soy fed children. Children fed cow milk formula have urine isoflavone concentrations about 500-fold less than soy fed children, but somewhat higher than breast fed children.
The soy protein isolate used to make formula has reduced levels of isoflavones compared with soybeans and soy flour, but higher levels than fermented products like tofu.(Anderson & Wolf, 1995) Infants consuming soy formula as their sole source of calories get higher exposures to isoflavones than adults, whose diet is more varied. Halm et al.’s study demonstrated that children, compared with adults, showed a statistically significantly higher urinary isoflavone excretion rate for daidzein, genistein and total isoflavonoids, implying higher bioavailability in children.(Halm et al., 2007) In other studies, urinary concentrations of daidzein and genistein in infants were slightly lower than urinary values of adults consuming a similar daily intake of isoflavones, which could indicate poor renal clearance in early life(Xu et al., 1994; Hutchins et al., 1995; Setchell et al., 1998). Urine is nevertheless useful to determine systemic isoflavone exposure in children, because it is readily collected and has relatively high concentrations(Franke et al., 2004; Halm et al., 2007). In our data, however, urinary concentrations do not correlate well with blood concentration measured simultaneously. This lack of correlation was also seen in adult studies indicating the limitations of urine concentrations as a predictor of systemic bioavailability.(Setchell et al., 2003; Franke et al., 2004) Also, the appearance of the isoflavones in urine is about 2 hours later than in plasma,(Watanabe et al., 1998) while in our study urine were collected immediately after blood collection. If the amount of circulating compound is of primary interest, then blood (in infants) or saliva may be a better measure. Equol, the product of bacterial degradation of daidzein, may have toxicological significance because it is more estrogenic than daidzein. Previous studies have shown and our data confirm that there is limited bacterial transformation in infants because equol was rarely detected. (Cruz et al., 1994; Setchell et al., 1997; Irvine et al., 1998; Franke et al., 2006). Though equol was detected in more than 40% samples in one study (Venkataraman et al., 1992), this may be due to the apparently much higher daidzein level.
There is a large toxicological literature on genistein, but only a few studies on soy formula and only four studies since 1993 that report isoflavone levels in infants. Setchell et al measured plasma concentrations of isoflavones in 4-month-old infants fed exclusively soy-based infant formula (n=7), cow-milk formula (n=7), or human breast-milk (n=7).(Setchell et al., 1997) Irvine et al. measured isoflavone intake from 2~16-week-old infants fed soy- or dairy-base infant formula.(Irvine et al., 1998) Franke et al measured urine and blood isoflavone concentrations of eighteen infants whose mothers consumed daily soy protein.(Franke et al., 2006) Venkataraman et al measured urine isoflavone concentrations of 10 2-4 mo old infants(Venkataraman et al., 1992). In all these studies, infants fed soy formula had much higher mean isoflavone values than their counterparts on other diets (Table 7). Our results based on much larger numbers of infants strongly confirm these previous reports.
Table 7.
Summary of previously reported isoflavone concentrations in infants.
| Author | Fluid Measured | n | Age | Genistein (ng/ml) | Daidzein (ng/ml) | Equol (ng/ml) |
|---|---|---|---|---|---|---|
| Soy-formula-fed infants | ||||||
| Setchell et al. (1997) | Plasma | 7 | 4 mo | 684±443 | 295±59.5 | 2.0 |
| Venkataraman et al. (1992) | Urine | 8 | 2 mo | 26,451±8559 | 25,399±8081 | 6.4±6.4 |
| 7 | 4 mo | 8758±3808 | 17,577±5452 | 1.5±1.5 | ||
| Franke et al. (2006) | Plasma | 3 | 9-24 mo | 276±106† | - | |
| Irvine et al. (1998) | Urine | 4 | 2-16 wk | No direct values | ||
| SEAD study | Urine | 125 | 0-12 mo | 5891×/÷3.1 | 5097×/÷2.5 | 2.3×/÷4.6 |
| Saliva | 119 | 0-12 mo | 11.6×/÷5.1 | 5.2×/÷5.8 | - | |
| Whole Blood | 27 | 0-12 mo | 757×/÷3.0 | 256×/÷2.8 | - | |
| Cow-milk-formula-fed infants | ||||||
| Setchell et al. (1997) | Plasma | 7 | 4 mo | 3.2±0.7 | 2.1±0.3 | 4.1±0.5 |
| Venkataraman et al. (1992) | Urine | 5 | 2 mo | 205±52 | 155±64 | 42.6±2.3 |
| 6 | 4 mo | 536±393 | 706±555 | 40.5±3.3 | ||
| Irvine et al. (1998) | Urine | 25 | 2-16 wk | Under limit of detection | - | |
| SEAD study | Urine | 128 | 0-12 mo | 11.8×/÷5.7 | 8.2×/÷5.0 | 2.4×/÷2.1 |
| Saliva | 120 | 0-12 mo | 0.7×/÷1.3 | 0.4×/÷1.4 | - | |
| Whole Blood | 30 | 0-12 mo | 14.2×/÷1.5 | 5.5×/÷1.5 | - | |
| Breastfed infants | ||||||
| Setchell et al. (1997) | Plasma | 7 | 4 mo | 2.8±0.7 | 1.5±0.1 | 0.5 |
| Venkataraman et al. (1992) | Urine | 5 | 2 mo | 1284±1089 | 697±653 | 2.9±2.9 |
| 5 | 4 mo | 161±108 | 179±80 | 59±42 | ||
| Franke et al. (2006) | Plasma | 11 | 2-4 wk | 5.2±3.5† | - | |
| SEAD study | Urine | 128 | 0-12 mo | 1.5×/÷4.8 | 1.5×/÷2.9 | 1.7×/÷1.2 |
| Saliva | 120 | 0-12 mo | 0.7×/÷1.3 | 0.4×/÷1.5 | - | |
| Whole Blood | 20 | 0-12 mo | 10.8×/÷2.7 | 5.3×/÷1.2 | - | |
Numbers of concentration are geometric mean±standard deviation or geometric mean×/÷geometric standard deviation
Total isoflavones concentration. Approximate conversion unit 3.8 ×10⁻³ moles/g
Despite convincing evidence of relatively high exposures, whether the phytoestrogens in soy formula are biologically active in infants is an open question. If genistein, daidzein, and equol are all estrogenic in cell receptors and animals, the question appears to be primarily one of dose. Aside from a small study conducted by Cruz et al. that demonstrated a link between phytoestrogens in soy formula and decreased cholesterol synthesis rates, there are no short-term data in infants.(Cruz et al., 1994) Regarding long-term effects, a lone epidemiologic study compares fertility and reproductive end points in young adults who were fed either cow-milk formula or soy formula as infants. This study by Strom et al. found only subtle effects including slight increases in the length of women’s menstrual cycles and the amount of discomfort during menstruation. (Strom et al., 2001)
We did not analyze cow milk formula or breast milk for isoflavones, previous studies have shown that the contribution of phytoestrogens from cow milk or human milk is trivial relative to that from soy infant formulas.(Franke & Custer, 1996; Irvine et al., 1998; Setchell et al., 1998) On the basis of the weak estrogenic activity of isoflavones, it is very doubtful that the dietary intake from human milk or cow milk is sufficient to exert significant biological effects.
We plan further longitudinal studies of infants fed soy formula, cow-milk formula, and breast milk over the first year or two of life, focusing on physical and developmental findings resembling the effects of estrogen exposure. Although whether soy formula has such effects is important in its own right, the question of hormonal disruption by exogenous chemicals is a much broader one. Pesticides, industrial chemicals, and pharmaceutical estrogen present in the environment have all been suspected of being “endocrine disrupters” in humans, especially fetuses and young children. According to a 1999 NRC report, exposure of infants to soy formula is the highest estrogenic exposure encountered outside by the general population of infants.(National Research Council, 1999) Thus, methods that detect no effects in soy-fed children would be very unlikely to detect effects of any of the other agents. We hope that the study of these phytoestrogens can inform the general question of endocrine disruption in children.
Acknowledgments
We are grateful to Zsuzsanna Kuklenyik and John Reidy for the isoflavone measurements in urine.
Footnotes
Disclosure information: Authors have nothing to declare.
The contents are solely the responsibility of the authors and do not necessarily represent the official views of the CDC.
References
- American Academy of Pediatrics. Committee on Nutrition. Soy protein-based formulas: recommendations for use in infant feeding. Pediatrics. 1998;101:148–153. [PubMed] [Google Scholar]
- Anderson RL, Wolf WJ. Compositional changes in trypsin inhibitors, phytic acid, saponins and isoflavones related to soybean processing. J Nutr. 1995;125:581S–588S. doi: 10.1093/jn/125.3_Suppl.581S. [DOI] [PubMed] [Google Scholar]
- Balk E, Chung M, Chew P, Ip S, Raman G, Kupelnick B, Tatsioni A, Sun Y, Devine D, Lau J. Effects of soy on health outcomes. Evid Rep Technol Assess (Summ) 2005:1–8. doi: 10.1037/e439502005-001. [DOI] [PMC free article] [PubMed] [Google Scholar]
- Cook DA. Soy protein in feeding the elderly. J Am Oil Chem Soc. 1981;58:464–467. [Google Scholar]
- Cruz ML, Wong WW, Mimouni F, Hachey DL, Setchell KD, Klein PD, Tsang RC. Effects of infant nutrition on cholesterol synthesis rates. Pediatr Res. 1994;35:135–140. doi: 10.1203/00006450-199402000-00001. [DOI] [PubMed] [Google Scholar]
- Franke AA, Custer LJ. Daidzein and genistein concentrations in human milk after soy consumption. Clin Chem. 1996;42:955–964. [PubMed] [Google Scholar]
- Franke AA, Custer LJ, Hundahl SA. Determinants for urinary and plasma isoflavones in humans after soy intake. Nutr Cancer. 2004;50:141–154. doi: 10.1207/s15327914nc5002_3. [DOI] [PubMed] [Google Scholar]
- Franke AA, Halm BM, Custer LJ, Tatsumura Y, Hebshi S. Isoflavones in breastfed infants after mothers consume soy. Am J Clin Nutr. 2006;84:406–413. doi: 10.1093/ajcn/84.1.406. [DOI] [PubMed] [Google Scholar]
- Halm BM, Ashburn LA, Franke AA. Isoflavones from soya foods are more bioavailable in children than adults. Br J Nutr. 2007;98:998–1005. doi: 10.1017/S0007114507771866. [DOI] [PubMed] [Google Scholar]
- Helsel DR. Nondetects And Data Analysis: Statistics for Censored Environmental Data. Hoboken, New Jersy: John Wiley & Sons, Inc; 2004. [Google Scholar]
- Hutchins AM, Slavin JL, Lampe JW. Urinary isoflavonoid phytoestrogen and lignan excretion after consumption of fermented and unfermented soy products. J Am Diet Assoc. 1995;95:545–551. doi: 10.1016/S0002-8223(95)00149-2. [DOI] [PubMed] [Google Scholar]
- Irvine CH, Shand N, Fitzpatrick MG, Alexander SL. Daily intake and urinary excretion of genistein and daidzein by infants fed soy- or dairy-based infant formulas. Am J Clin Nutr. 1998;68:1462S–1465S. doi: 10.1093/ajcn/68.6.1462S. [DOI] [PubMed] [Google Scholar]
- Klein KO. Isoflavones, soy-based infant formulas, and relevance to endocrine function. Nutr Rev. 1998;56:193–204. doi: 10.1111/j.1753-4887.1998.tb01748.x. [DOI] [PubMed] [Google Scholar]
- Kuklenyik Z, Ye X, Reich JA, Needham LL, Calafat AM. Automated online and off-line solid-phase extraction methods for measuring isoflavones and lignans in urine. J Chromatogr Sci. 2004;42:495–500. doi: 10.1093/chromsci/42.9.495. [DOI] [PubMed] [Google Scholar]
- Kurzer MS, Xu X. Dietary phytoestrogens. Annu Rev Nutr. 1997;17:353–381. doi: 10.1146/annurev.nutr.17.1.353. [DOI] [PubMed] [Google Scholar]
- Lubin JH, Colt JS, Camann D, Davis S, Cerhan JR, Severson RK, Bernstein L, Hartge P. Epidemiologic evaluation of measurement data in the presence of detection limits. Environ Health Perspect. 2004;112:1691–1696. doi: 10.1289/ehp.7199. [DOI] [PMC free article] [PubMed] [Google Scholar]
- Mayr U, Butsch A, Schneider S. Validation of two in vitro test systems for estrogenic activities with zearalenone, phytoestrogens and cereal extracts. Toxicology. 1992;74:135–149. doi: 10.1016/0300-483x(92)90134-z. [DOI] [PubMed] [Google Scholar]
- Merritt RJ, Jenks BH. Safety of soy-based infant formulas containing isoflavones: the clinical evidence. J Nutr. 2004;134:1220S–1224S. doi: 10.1093/jn/134.5.1220S. [DOI] [PubMed] [Google Scholar]
- Miniello VL, Moro GE, Tarantino M, Natile M, Granieri L, Armenio L. Soy-based formulas and phyto-oestrogens: a safety profile. Acta Paediatr Suppl. 2003;91:93–100. doi: 10.1111/j.1651-2227.2003.tb00655.x. [DOI] [PubMed] [Google Scholar]
- National Research Council. Hormonally active agents in the environment. Washington, D.C.: National Academy Press; 1999. [Google Scholar]
- Setchell KD, Faughnan MS, Avades T, Zimmer-Nechemias L, Brown NM, Wolfe BE, Brashear WT, Desai P, Oldfield MF, Botting NP, Cassidy A. Comparing the pharmacokinetics of daidzein and genistein with the use of 13C-labeled tracers in premenopausal women. Am J Clin Nutr. 2003;77:411–419. doi: 10.1093/ajcn/77.2.411. [DOI] [PubMed] [Google Scholar]
- Setchell KD, Zimmer-Nechemias L, Cai J, Heubi JE. Isoflavone content of infant formulas and the metabolic fate of these phytoestrogens in early life. Am J Clin Nutr. 1998;68:1453S–1461S. doi: 10.1093/ajcn/68.6.1453S. [DOI] [PubMed] [Google Scholar]
- Setchell KDR, Zimmer-Nechemias L, Cai J, Heubi JE. Exposure of infants to phyto-oestrogens from soy-based infant formula. Lancet. 1997;350:23–27. doi: 10.1016/S0140-6736(96)09480-9. [DOI] [PubMed] [Google Scholar]
- Strom BL, Schinnar R, Ziegler EE, Barnhart KT, Sammel MD, Macones GA, Stallings VA, Drulis JM, Nelson SE, Hanson SA. Exposure to soy-based formula in infancy and endocrinological and reproductive outcomes in young adulthood. Journal of the American Medical Association. 2001;286:807–814. doi: 10.1001/jama.286.7.807. [DOI] [PubMed] [Google Scholar]
- Thomas JA. Phytoestrogens and hormonal modulation: a mini-review. Environ Nutr Interact. 1997;1:5–12. [Google Scholar]
- Twaddle NC, Churchwell MI, Doerge DR. High-throughput quantification of soy isoflavones in human and rodent blood using liquid chromatography with electrospray mass spectrometry and tandem mass spectrometry detection. J Chromatogr B Analyt Technol Biomed Life Sci. 2002;777:139–145. doi: 10.1016/s1570-0232(02)00275-1. [DOI] [PubMed] [Google Scholar]
- Venkataraman PS, Neylan MJ, Carlson J, Setchell KD. Urinary Phytoestrogen Excretion in Infants - Differences between Human-Milk, Cow Milk Based, and Soy Based Formula Fed Infants. Clinical Research. 1992;40:A793–A793. abstr. [Google Scholar]
- Watanabe S, Yamaguchi M, Sobue T, Takahashi T, Miura T, Arai Y, Mazur W, Wahala K, Adlercreutz H. Pharmacokinetics of soybean isoflavones in plasma, urine and feces of men after ingestion of 60 g baked soybean powder (kinako) J Nutr. 1998;128:1710–1715. doi: 10.1093/jn/128.10.1710. [DOI] [PubMed] [Google Scholar]
- Welshons WV, Rottinghaus GE, Nonneman DJ, Dolan-Timpe M, Ross PF. A sensitive bioassay for detection of dietary estrogens in animal feeds. J Vet Diagn Invest. 1990;2:268–273. doi: 10.1177/104063879000200403. [DOI] [PubMed] [Google Scholar]
- Wolff A, Begleiter A, Moskona D. A novel system of human submandibular/sublingual saliva collection. J Dent Res. 1997;76:1782–1786. doi: 10.1177/00220345970760111001. [DOI] [PubMed] [Google Scholar]
- Xu X, Wang HJ, Murphy PA, Cook L, Hendrich S. Daidzein is a more bioavailable soymilk isoflavone than is genistein in adult women. J Nutr. 1994;124:825–832. doi: 10.1093/jn/124.6.825. [DOI] [PubMed] [Google Scholar]