Abstract
Otitis media with effusion (OME) is an inflammatory disease of the middle ear that causes most cases of conductive hearing loss observed in the pediatric population. With the long term goal of evaluating middle ear function with OME, the aim of the current study was to create an animal model of OME in which middle ear transfer functions could be measured. In guinea pigs, OME was created by injecting lipopolysaccharide (LPS) into the middle ear. Evidence of OME was assessed by otoscopy, tympanometry, histology, and by measuring the volume of fluid in the middle ear. Vibrations of the umbo and round window membrane were measured with a laser Doppler vibrometer at frequency range of 200~40k Hz in three groups of 3, 7, and 14 days after injection of LPS. Changes in displacement of the umbo and round window membrane in response to 80 dB SPL sound in the ear canal were measured across the frequency range. Displacement of both the umbo and round window membrane was reduced at all time-points following LPS injections. Further, the change of the displacement transmission ratio (DTR) from the tympanic membrane to the round window occurred mainly in chronic (e.g. 14 days post LPS injection) OME ears. This study provides useful data for analyzing the change of middle ear transfer function in OME ears.
Keywords: middle ear mechanics, otitis media with effusion, laser measurement, guinea pig
INTRODUCTION
Otitis media with effusion (OME) is an inflammatory disease which results in fluid or effusion that accumulates in the middle ear cavity. OME is commonly associated with negative air pressure in the middle ear because of Eustachian tube dysfunction. OME is associated with a conductive hearing loss that is thought to be the result of effusion accumulated in the middle ear, negative middle ear pressure, and structural changes induced by inflammation.
The effect of effusion on middle ear function has been studied in human temporal bones by Ravicz et al. (2004), Gan et al. (2006), and Dai et al. (2007a). In those studies, effusion was simulated by injecting saline or silicon fluid into the middle ear and the vibration of the tympanic membrane (TM) and/or stapes footplate was measured with a laser Doppler vibrometer. The results of those studies indicate that the middle ear fluid reduced the movement of the TM and stapes footplate over frequency range of 200~8k Hz. The results reported by Murakami et al. (1997) and Gan et al. (2006) also show that the middle ear pressure decreased the TM movement mainly at low frequencies (f <1k Hz).
The previous studies in human temporal bones have revealed changes in middle ear mechanics induced by fluid in the middle ear cavity. However, the combined effects of pressure and fluid on the middle ear function in a real OME condition has not been reported by laser vibrometric measurement. The change of the middle ear structure induced by OME cannot be simulated in cadaver temporal bones. Therefore, an animal model of OME may provide a more realistic situation of the middle ear disease for measuring the change of middle ear mechanics in OME.
Several OME models have been created in various species to investigate changes in TM stiffness, shape, and mobility. By obstructing the Eustachian tube with glue, Larsson et al. (2005) created a gerbil OME model and the displacement of pars flaccida of the TM was measured with moiré interferometry. In 2003, they also induced a purulent otitis media model by injecting Streptococcus pneumoniae type 3 into the middle ear of gerbil and measured the displacement of pars flaccida with the same technique. Von Unge et al. (1995) created OME in gerbils by electro-cauterization of the Eustachian tube and measured the shape and displacement patterns of the TM. Intratympanic injection of lipopolysaccharide (LPS) to induce persistent inflammation was reported by Ohashi et al. (1991) in guinea pigs, which resulted in serous effusion in the cavity without causing diffuse infection in the middle ear.
In this study, we induced OME in guinea pigs via LPS injections into the middle ear (Ohashi et al., 1991) and measured subsequent changes in middle ear transfer function. The changes of the TM and round window mobility in the OME ears show that the effect of OME on the middle ear function is related to frequency of the input sound and varies with the stages of inflammation. This study provides new data for analyzing the change of middle ear transfer function in OME ears.
METHODS
Experimental Protocol
This study protocol was approved by the Institutional Animal Care and Use Committee of the University of Oklahoma and met the guideline of the National Institutes of Health. Twenty four Hartley guinea pigs (13 males, 11 females, average weight 305 gm), free from middle ear disease as evaluated by otoscopy examination, were used.
The OME model of guinea pig was created by injection of LPS into the middle ear of the guinea pig. For this, LPS in saline (up to 0.3 ml, 100 µg/ml, of Klebsiella pneumonia, Sigma) was injected into the left ear through the ear canal skin to the edge of tympanic membrane annulus using a 1 cc syringe with 26 gauge needle under an operating microscope. The opposite right ear served as a contralateral control (injection into one ear is not expected to affect the opposite ear (Ar et al., 2007)). Three guinea pigs (6 ears) without any treatment were used as blank controls. The injected animals were divided into 3 groups based on survival time after LPS injection (3, 7, or 14 days). These times reflect early, medium, and chronic stages, respectively, of OME after LPS injection (Ohashi et al., 1991). Each group contained 7 animals (6 for transfer function measurements and otoscopic evaluation of OME and one for histological verification of OME).
Evaluation of the OME Model
After 3, 7, or 14 days after LPS injection, the animals were anesthetized with ketamine (40 mg/kg) and the eardrum examined under otoscopy to determine the color and position of the TM as well as the presence of fluid. Middle ear compliance and pressure were then measured using a multiple-frequency tympanometer (MAICO MI24, MN). The volume of fluid in the middle ear was also measured once the transfer function measurements were finished. For this, the temporal bone was opened and the effusion drawn into a syringe.
To collect sections for histology, the animals were anesthetized by overdose of ketamine (100 mg/kg) and xylazine (20 mg/kg) and intracardially perfused with fixative (3.0% glutaraldehyde, 1.5% paraformaldehyde in 0.1 M phosphate buffer, pH 7.2). The temporal bones or bullas were removed and immersed in the same fixative overnight at room temperature. The next day, the right and left bullas were dissected together and processed simultaneously. The bullas were decalcified in ethylene diamine tetraacetic acid (EDTA), embedded in paraffin, sectioned along the horizontal plane, serially mounted on glass slides, stained with Hematoxin-Eosin and cover slipped. The sections were viewed and photographed under a Nikon E-800 light microscope.
The criteria for OME, or possible experimental findings consistent with OME, included the presence of: 1) dark and opaque tympanic membrane as determined by otoscopy; 2) low compliance and negative middle ear pressure as detected by tympanometry; 3) thickening of tympanic membrane or mucosa (as observed in histology sections); and 4) volume of middle ear fluid. In this study, all 18 left ears included in 3 groups of experiments met the criteria of 1, 2, and 4. The three left ears for histology sections met all 4 criteria.
Measurements with laser vibrometry
After the otoscopic evaluation and tympanometry measurement, the guinea pigs were anesthetized with ketamine (100 mg/kg im) and xylazine (10 mg/kg im) and the temporal bones removed and placed in a holder that was secured to a vibration-isolation table. The temporal bone was wrapped in gauze wetted with normal saline to prevent desiccation of the specimen during the experiment. First, a reflective tape (0.05 mg) with diameter of 1 mm was placed in the center of the lateral surface of the eardrum (umbo) to be used as a laser target. The vibration of the TM in each temporal bone (with intact bulla) in response to 80 dB SPL sound input in the ear canal was measured. The bulla was then opened to measure round window membrane (RWM) vibration and to re-measure TM vibration. To place the RWM laser target, a small hole with diameter of 1 mm was made on the posterior wall of the bulla (4 mm away from the ear canal) to expose the round window and a reflective tape with diameter of 0.5 mm (0.0125mg) placed on the RWM. The hole on the bulla was then covered by a glass sheet. During this surgical preparation, the effusion or fluid in the middle ear cavity of the left ear (OME ear) was maintained inside the bulla. It is noted that the cavity was filled with the effusion and the reflective tape was immersed in the fluid in some OME ears. However, the reflective tape with glue on its back side was securely attached to the RWM and the laser beam reflection was obtained through the fluid.
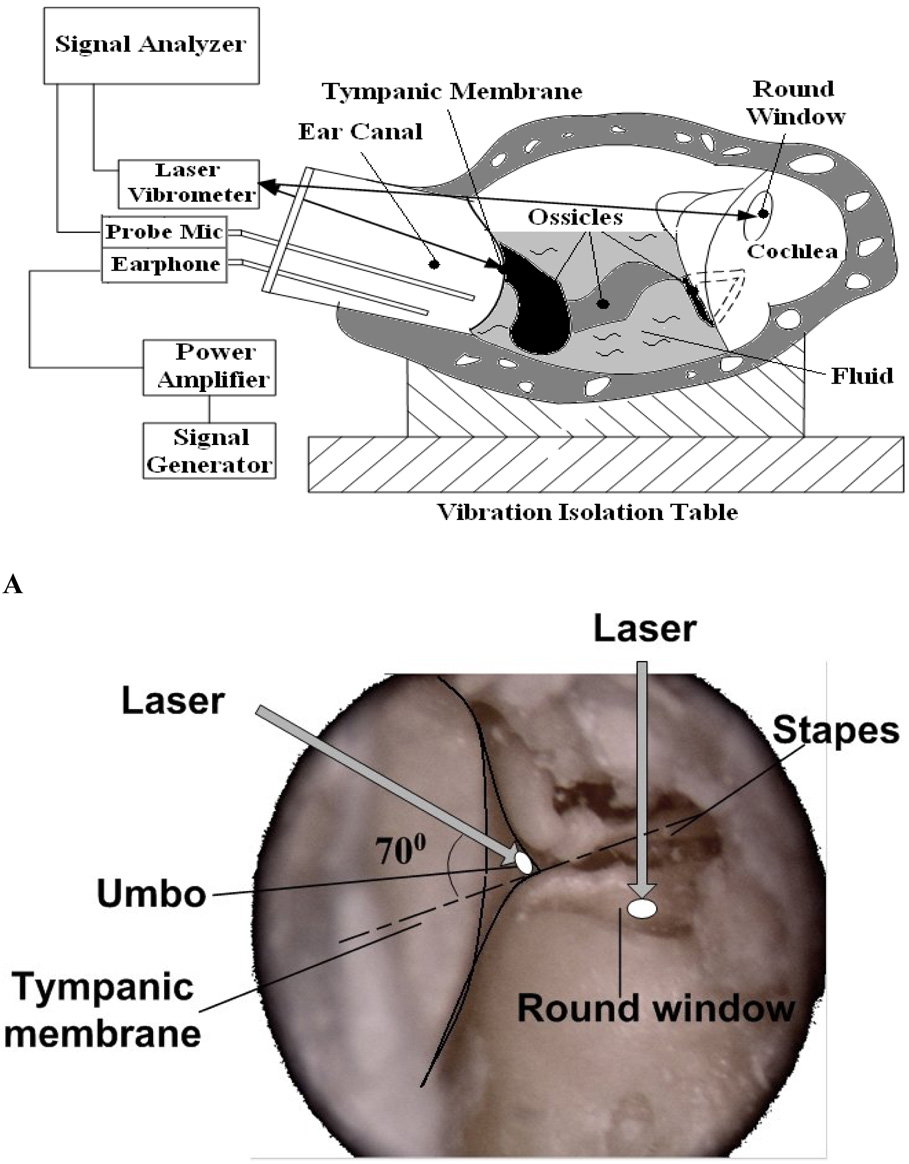
The diagram in Fig. 1A shows the setup with the laser Doppler vibrometer. Briefly, 80 dB SPL pure tones within the frequency range of 200~40 kHz from a function generator (HP 35670A, CA) were presented to the ear canal near the TM by an insert earphone. The input sound included 80 spectral lines at 80 dB SPL each. A transparent hard plastic tube (diameter of 4 mm) as the sound delivery tube was placed in the ear canal and sealed to the canal wall with dental cement around the bony rim of the ear canal. A probe microphone (B&K 4938, Denmark, frequency up to 100 kHz) was used for monitoring the input SPL and an earphone was used for delivering sound. The probe tubes of the microphone and earphone were integrated into the sound delivery tube and the tip of the earphone tube was positioned approximately 2 mm from the umbo. The opening of the sound delivery tube was covered by a transparent glass sheet. The laser beam was focused on the TM target through the sound delivery tube. For measurement at the RWM target, the laser beam was focused on the reflective tape through the opened hole in the bulla. The photograph in Fig. 1B shows the direction of the laser beam on the TM and RWM. The angle between the laser beam on the umbo and the normal direction of stapes movement was about 70 degree. The laser beam was perpendicular to the RWM.
Figure 1.
A: Schematic of the experimental setup with laser vibrometer on the tympanic membrane (TM) and round window (RW) in guinea pig temporal bones ; B: Photograph showing the angle between the laser beam and the TM and RW.
A hearing laser vibrometer (Polytec HLV 1000, Tustin, CA) was used to measure the movement of the laser targets at the TM and RWM. The amplitude and phase angle of the input sound signals and the velocity of the TM and RWM were recorded in a digital signal analyzer (HP35670A, CA) for further analysis. Velocity measures with HLV were acquired in the frequency domain by back-weighted averaging of a live, fast-Fourier-transform. Only data with a total harmonic distortion of less than 10% of pure tone signals according to the distortion index shown on the signal analyzer were accepted. The peak-to-peak displacement (dp-p) of the TM or RWM was directly calculated from the voltage output of the laser vibrometer velocity decoder by a formula: dp-p = k (Avolt/2πf), where Avolt is voltage amplitude in mV, f is frequency in kHz, k is a constant related to selected scale and calibration factor in unit of µm/s per mV (Gan et al., 2001).
RESULTS
Confirmation of OME
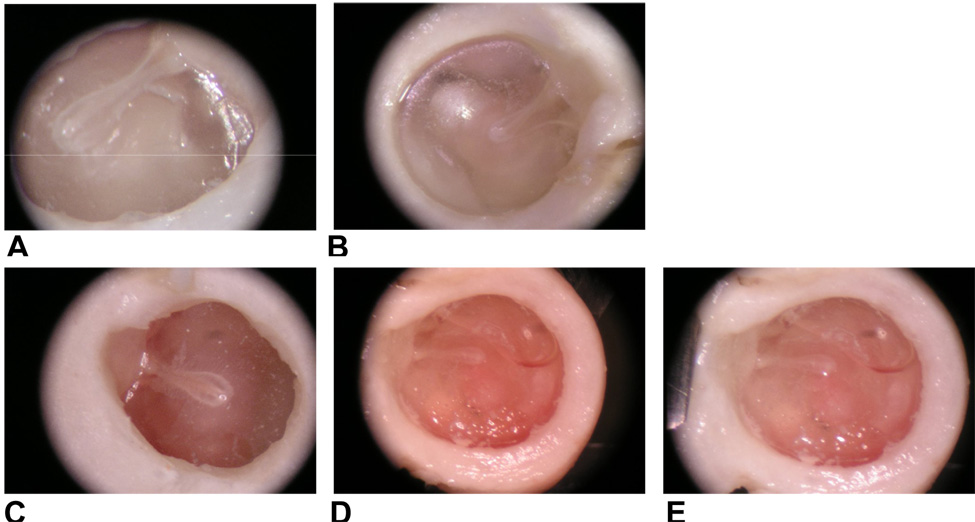
From otoscopic examination, the TM’s of all of the LPS-injected ears shows signs of inflammation. Figure 2 shows the TM’s observed in the control and LPS-injected ears on days 3, 7, and 14 post-injection. Compared with the transparent TM of the control ears (Fig. 2A – blank control and Fig. 2B – contralateral control), the TMs of the LPS-injected ears were dark and opaque in appearance (Figs. 2C, 2D and 2E). The TMs in the contralateral control and blank control ears were both transparent, which indicates that the inflammation in the LSP-injected ear did not affect the uninjected ear. Effusion in LPS-injected or OME ears was also observed. The TM in OME ears at 7 and 14 days (Figs. 2D and 2E) were darker than that at 3 days (Fig. 2C). Tympanic membrane retraction was also observed in OME ears at 7 and 14 days post-injection (e.g., Figs. 2D and 2E). Retracted TM’s were observed in 2 ears 3 days after LPS injections.
Figure 2.
Photographs of the tympanic membrane in a contralateral control ear (A), blank control ear (B) and OME ears 3 (C), 7 (D), and 14 (E) days after LPS injection.
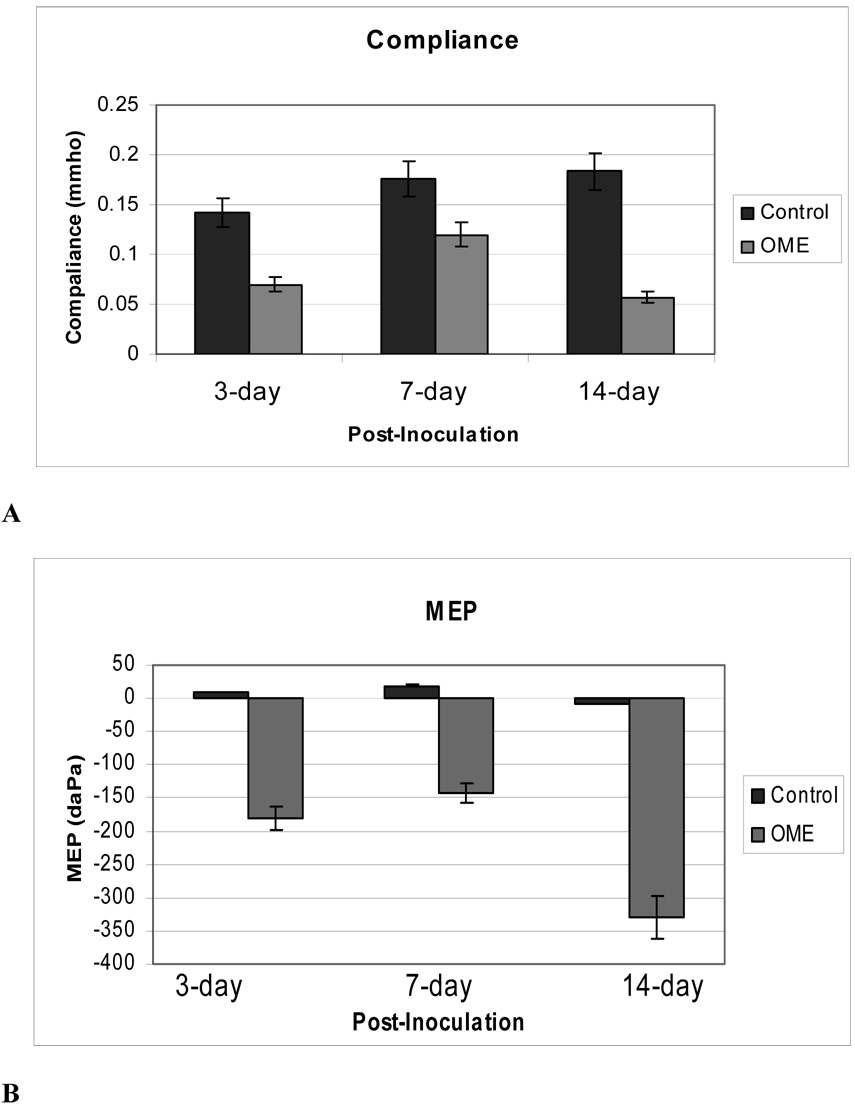
Differences in static middle ear compliance and middle ear pressure (MEP) were also observed between the OME and control ears at all 3 time points (Fig. 3). The mean values of compliance in the control ears at 3, 7, and 14 days were 0.14, 0.17, and 0.18 mmho, respectively, while the means values of compliance in the LPS-injected ears were 0.07, 0.12 and 0.06 mmho, respectively. The lowest compliance value was measured in from the ears tested 14 days after LPS injection. Figure 3B shows means of MEP’s in OME and control ears at the same times after injection. The mean values of MEP in control ears were close to zero while the mean values in OME ears were all negative, as −175, −145, and −325 daPa for ears at 3, 7, and 14 days, respectively.
Figure 3.
Data extracted from tympanograms measured in the control and OME ears of three groups (6 in each group) by a high frequency (1000 Hz) tympanometer when middle ear pressure was varied from −400 daPa to 400 daPa. (A) Mean compliance data in mmho in the control (dark column) and OME (light column) ears; (B) Mean middle ear pressure (MEP) data in the control (dark column) and OME (light column) ears.
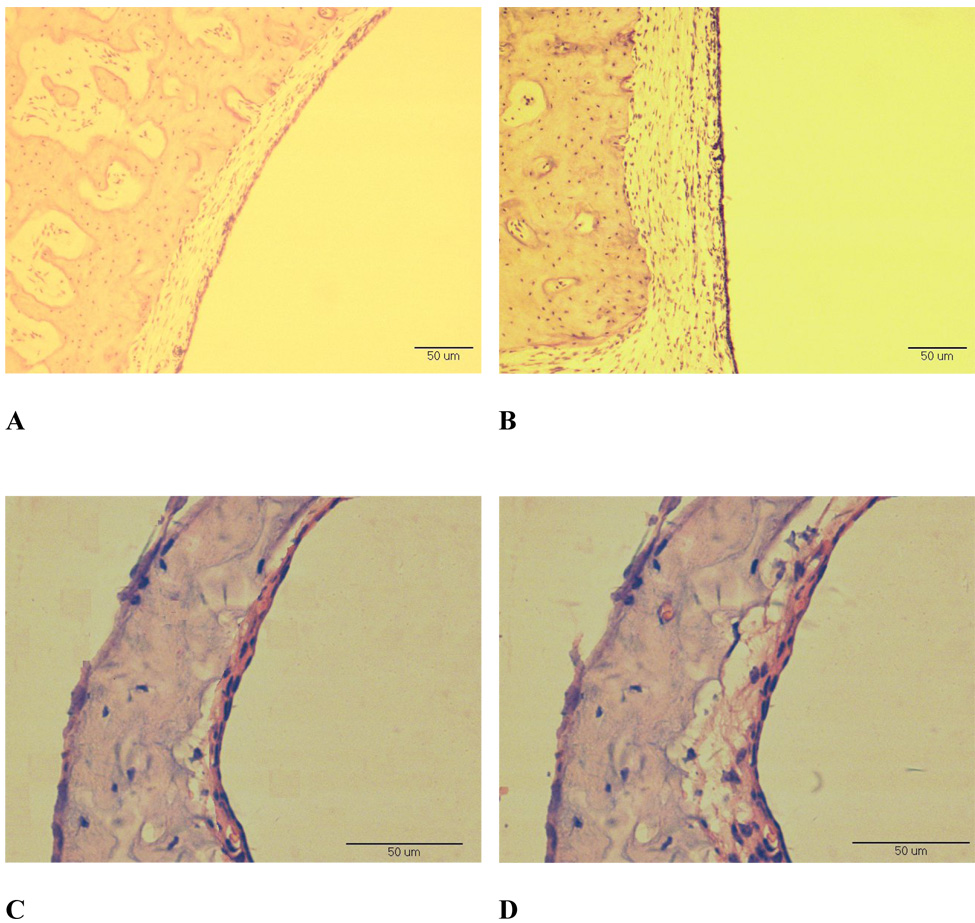
Qualitative differences were observed in the morphology of the OME ears compared to controls at all time points following injection. The biggest differences were observed in the animals euthanized after 14 days. The photomicrographs in Fig. 4 show the middle ear mucosa of the middle ear cavity roof and the TM in control and LPS-injected ears at 14 days. The mucosa in the roof of the OME ear was thicker and edematous (Fig. 4B) compared to the control (Fig. 4A). The eardrum in the OME ear (Fig. 4D) was thicker (50 µm) compared to the control ear (38 µm, Fig. 4C). The mucosal layer of the TM (Fig. 4D) was thicker in LPS-injected ear compared to that of the control ear (16 µm, Fig. 4C). The round window and some ligaments in the OME ears were thicker compared to controls (not shown).
Figure 4.
Photomicrographs of the mucosa on the roof of the middle ear and the TM in ears collected at 14days after LPS-injection. Original magnification, x200 (A, B) and x400 (C, D). (A) mucosa on the roof of the control ear; (B) mucosa on the roof of an OME middle ear; (C) TM of the control ear; (D) TM of the OME ear.
Effusion was observed in all of the LPS-injected ears. The mean amount of effusion in the middle ear was measured at 0.2, 0.11 and 0.17 ml at 3, 7, and 14 days after injection, respectively. By visual assessment, the effusion level varied from about half-filled (up to the umbo) to fully filled. All the control ears collected at 3, 7, and 14 days after LPS was injected into the contralateral ears had a clear middle ear cavity without signs of inflammation.
These results are similar to those observed previously with LPS (Ohashi et al., 1991) and along with the tympanometery results indicate successful induction of OME in the experimental ears. All ears injected with LPS at all 3 survival times met the necessary 3 criteria (1, 2, and 4) for OME and all ears injected with LPS that were examined histologically met the pathological criterion (3) for OME.
Umbo and round window mobility change by OME
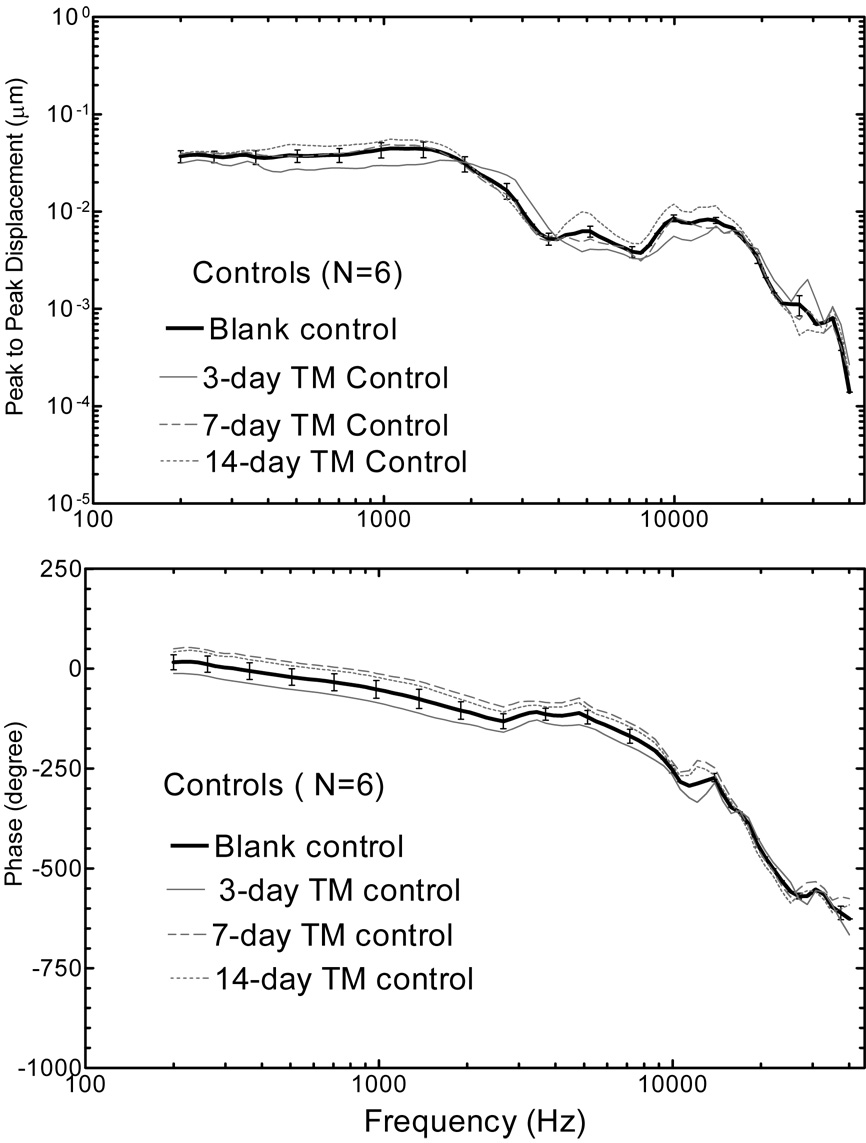
Figure 5 shows the mean (+/− SD) spectral displacement magnitude (upper panel) and phase (lower panel) of the TM measured from 6 blank control ears and 6 contralateral control ears (contralateral to the OME ear collected 3, 7, and 14 days after the LPS injections). TM displacement was high at low frequencies (f<2k Hz) and the maximum displacement occurred at approximate 1.5k Hz with a value about 0.05 µm. The second TM displacement peak was at higher frequency of 9k~13k Hz with a value of 0.008 µm. The phase angle of TM displacement started from about zero at 200 Hz to −700 degree at 40k Hz. The four curves in Fig. 5 show similar measurements and there was no significant difference between the blank control and contralateral control ears. Thus, in this study, the data obtained from contralateral control ears within each group was used as the individual control in comparison with the data from OME ears.
Figure 5.
Mean TM displacement magnitude (upper panel) and phase (lower panel) in response to 80 dB SPL at the ear canal at frequencies of 200 ~40 kHz in intact control ears. The bold solid line with standard deviation represents the control curve in the blank control ears and grey lines represent the curves in contralateral ears in three experimental groups.
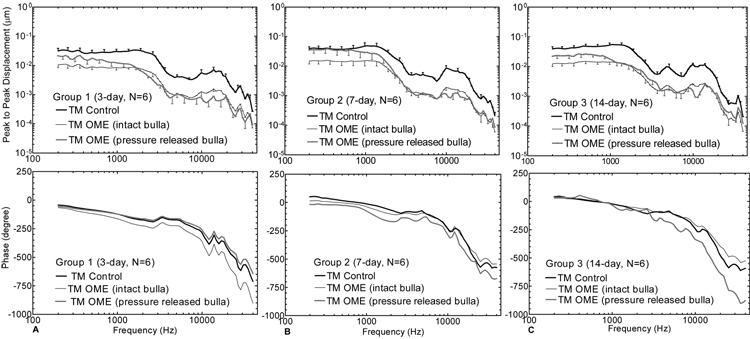
Figure 6 shows the mean (+/− SD) spectral displacement magnitude (upper panel) and phase (lower panel) of the TM (umbo) vibration measured in OME ears at 3, 7, and 14 days. The bold solid lines represent the measurements from the contralateral control ears. The thin lines represent the measurements from the OME ears with the intact (pressure-maintained) bulla. The grey lines represent the data from the OME ears with the pressure-released bulla. For the intact bulla, the middle ear pressure inside the bulla was maintained during the experimental measurements. For the opened and re-covered bulla, the pressure inside the bulla was released during the measurements.
Figure 6.
Mean (+/− SD) TM displacement magnitude (upper panel) and phase (lower panel) in response to 80 dB SPL at the ear canal at frequencies of 200 ~ 40 kHz. The dark solid lines represent the control curves; the thin lines represent the measurements from intact OME ears; and the grey lines represent the curves from pressure-released OME ears. (A) Group 1; (B) Group 2; (C) Group 3.
As shown in Fig. 6, TM movement in the intact bulla of the OME ear decreased over the frequency range of 200~40k Hz at all 3 survival times. Statistically, differences in TM displacement between the OME ears with the intact bulla and the control (shown in Table 1-A) were significant across the entire frequency range. The reduction of TM movement in the OME ears with an intact bulla was higher than that in the ears with opened bulla (pressure-released bulla) at all survival times at low frequencies (f< 1000 Hz). The statistical results of ears collected at 3 days (pressure-released bulla, Table 1-A) show that TM movement was significantly reduced in OME ears at frequencies greater than 250 Hz. For Ears collected at 7 days (Group 2), Figure 6B shows that TM displacement of the OME ears with pressure-released bulla did not change much at low frequencies (f<1000 Hz), but decreased significantly at frequencies greater than 1000 Hz. The statistical data of this group (pressure-released bulla, Table 1-A) indicate significant differences between the OME and control ears at frequencies above 1000 Hz. Figure 6C shows that the displacement of the OME ears collected at 14 days with opened bulla decreased significantly at all frequencies, except for those higher than 20 kHz (see Table 1-A under the TM (pressure released bulla) of Group 3).
Table 1.
| Table 1-A. List of P Values Calculated from Experimental Data of Fig. 6 and Fig. 7. | |||||||||||
|---|---|---|---|---|---|---|---|---|---|---|---|
| TM (intact bulla) | TM (pressure released bulla) | RWM (pressure released bulla) | |||||||||
| Frequency (Hz) | Group 1 | Group 2 | Group 3 | Group 1 | Group 2 | Group 3 | Group 1 | Group 2 | Group 3 | ||
| 250 | 0.03 | 0.03 | 0.00 | 0.16 | 0.367 | 0.031 | 0.185 | 0.353 | 0.05 | ||
| 500 | 0.01 | 0.09 | 0.00 | 0.043 | 0.437 | 0.022 | 0.167 | 0.241 | 0.049 | ||
| 750 | 0.01 | 0.06 | 0.00 | 0.047 | 0.305 | 0.012 | 0.045 | 0.147 | 0.018 | ||
| 1000 | 0.00 | 0.03 | 0.00 | 0.015 | 0.171 | 0.006 | 0.046 | 0.07 | 0.014 | ||
| 2000 | 0.00 | 0.00 | 0.00 | 0.006 | 0.016 | 0.005 | 0.016 | 0.017 | 0.059 | ||
| 4000 | 0.00 | 0.00 | 0.00 | 0.005 | 0.002 | 0.008 | 0.012 | 0.016 | 0.104 | ||
| 6000 | 0.00 | 0.00 | 0.00 | 0 | 0 | 0.024 | 0.024 | 0.003 | 0.063 | ||
| 8000 | 0.00 | 0.00 | 0.01 | 0.001 | 0 | 0.025 | 0.009 | 0.002 | 0.009 | ||
| 10000 | 0.00 | 0.00 | 0.00 | 0.013 | 0.006 | 0 | 0.013 | 0.007 | 0.001 | ||
| 15000 | 0.00 | 0.00 | 0.00 | 0.001 | 0.002 | 0 | 0.01 | 0.017 | 0.01 | ||
| 20000 | 0.01 | 0.00 | 0.01 | 0.025 | 0.004 | 0.04 | 0.009 | 0.001 | 0.039 | ||
| 30000 | 0.01 | 0.01 | 0.03 | 0.036 | 0.048 | 0.144 | 0.089 | 0.045 | 0.126 | ||
| 40000 | 0.01 | 0.01 | 0.04 | 0.047 | 0.048 | 0.189 | 0.005 | 0.024 | 0.177 | ||
| Table 1-B. List of dB Loss (Relative to Control) Calculated from Experimental Data of Fig. 6 and Fig. 7. | |||||||||||
|---|---|---|---|---|---|---|---|---|---|---|---|
| TM (intact bulla) | TM (pressured released bulla) | RWM (pressured released bulla) | |||||||||
| Frequency (Hz) | Group 1 | Group 2 | Group 3 | Group 1 | Group 2 | Group 3 | Group 1 | Group 2 | Group 3 | ||
| 250 | −9.02 | −6.83 | −10.12 | −3.65 | −1.00 | −5.05 | −2.78 | −0.96 | −4.00 | ||
| 500 | −9.09 | −6.40 | −10.32 | −3.74 | −0.49 | −5.31 | −2.44 | −2.04 | −4.83 | ||
| 750 | −11.05 | −7.67 | −11.21 | −6.28 | −1.99 | −6.50 | −7.97 | −3.47 | −6.01 | ||
| 1000 | −12.22 | −9.70 | −13.99 | −7.89 | −4.51 | −10.43 | −10.02 | −5.62 | −8.13 | ||
| 2000 | −16.42 | −12.59 | −13.83 | −14.19 | −8.40 | −10.19 | −9.43 | −8.43 | −8.95 | ||
| 4000 | −17.08 | −16.67 | −13.81 | −15.27 | −12.93 | −10.17 | −14.58 | −9.72 | −7.89 | ||
| 6000 | −15.88 | −15.34 | −15.67 | −13.33 | −12.49 | −13.96 | −15.64 | −10.29 | −9.02 | ||
| 8000 | −16.33 | −15.34 | −14.05 | −14.06 | −12.48 | −10.53 | −18.56 | −9.21 | −7.49 | ||
| 10000 | −19.17 | −19.49 | −20.15 | −18.78 | −19.34 | −20.51 | −18.83 | −11.86 | −12.30 | ||
| 15000 | −20.12 | −17.74 | −15.67 | −19.50 | −16.36 | −13.00 | −21.53 | −11.14 | −11.61 | ||
| 20000 | −16.18 | −14.17 | −13.26 | −13.81 | −10.71 | −7.98 | −21.46 | −13.86 | −8.05 | ||
| 30000 | −18.47 | −14.15 | −12.92 | −17.59 | −10.67 | −4.87 | −13.48 | −10.53 | −3.96 | ||
| 40000 | −13.10 | −12.00 | −9.70 | −9.140 | −7.587 | −4.51 | −17.82 | −10.68 | −3.37 | ||
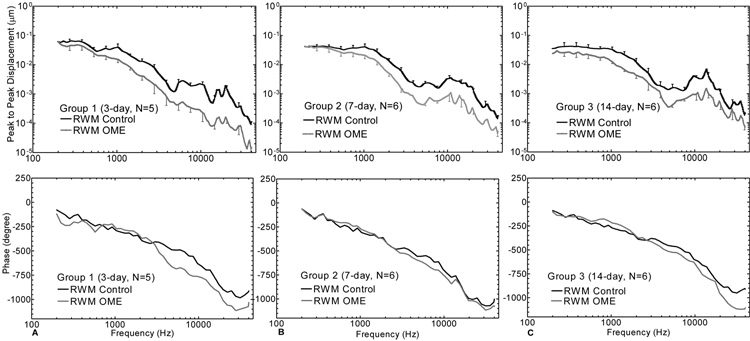
The round window membrane displacements measured in the OME ears with pressure-released bulla collected at the 3 survival times are shown in Figure 7. The statistical results in comparison with the control data are listed in Table 1-A under the RWM (pressure-released bulla) columns. The mean displacement curves of RWM in ears collected at 3 days (Group 1) decreased at all frequencies and significant reductions were observed at frequencies above 500 Hz. In ears collected at 7 days (Group 2), the significant decrease of the RWM displacement in OME ears (grey line) appeared at 2 kHz. For ears collect at 14 days, the displacement of the RWM decreased significantly up to 20 kHz. At low frequencies (f <1 kHz), the RWM movement decreased more in 14-day-ears than that in 3- and 7-day-ears. Alternatively, at higher frequencies (f ≥ 1 kHz), the reduction of RWM displacement in Group 1 was higher than that of Group 2 and Group 3 as shown in Table 1-B and Figure 7.
Figure 7.
Mean (+/− SD) RWM displacement magnitude (upper panel) and phase (lower panel) in response to 80 dB sound pressure at the ear canal at frequencies of 200~40k Hz. The dark solid lines represent the control curves and the grey lines represent the OME curves. (A) Group 1; (B) Group 2; (C) Group 3.
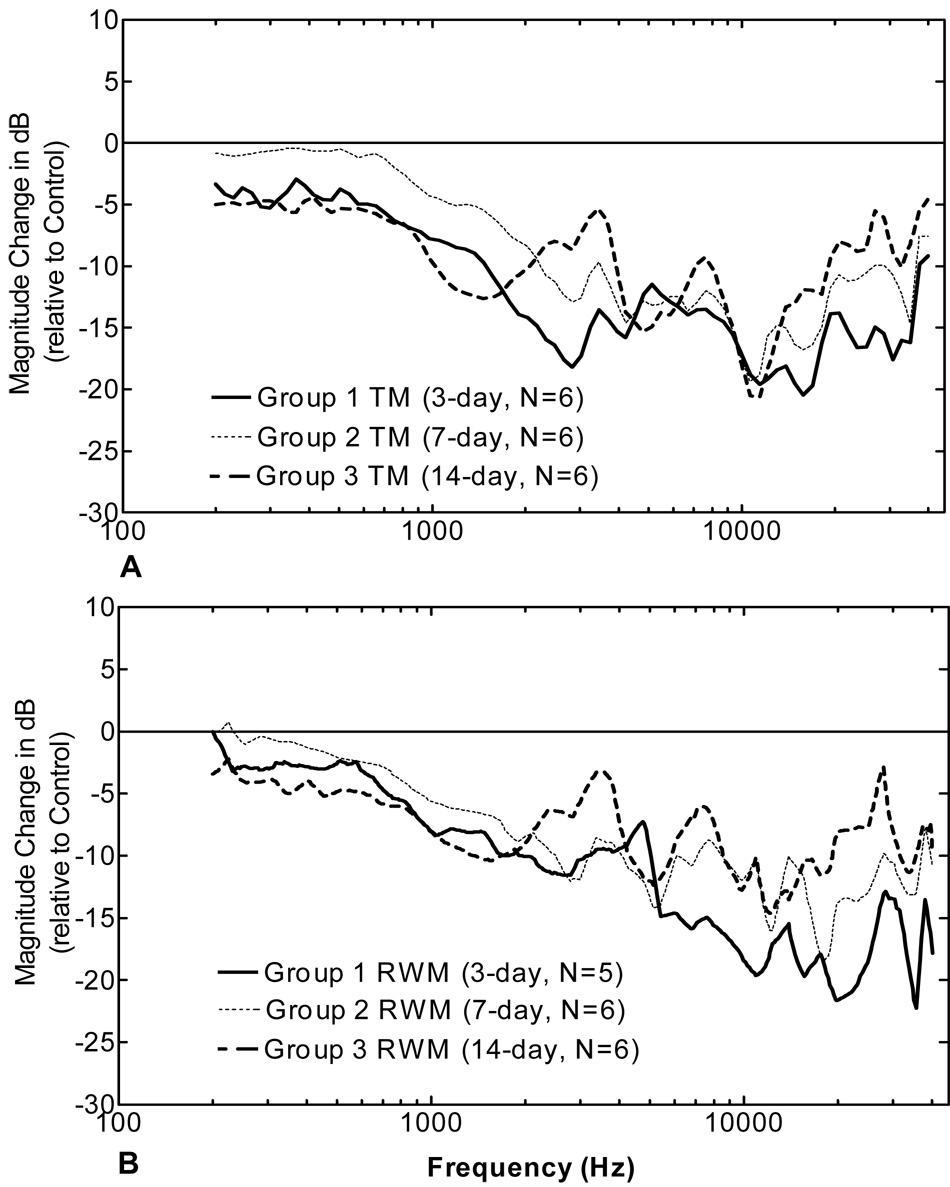
Figure 8 shows the magnitude change in dB (relative to the control ears) of the TM and RWM displacements in OME ears with pressure-released derived from Fig. 6 and Fig. 7. For the TM movement (Fig. 8A) at low frequencies (f < 1 kHz), the decrease in ears collected at 3 days was similar to ears collected at 14 days, but the decrease in ears collected at 7 days was higher compared to the other two groups. At high frequencies, there are some variations among these three groups and the TM movement decreased most in ears collected at 3 days and least in ears collected at 14 days. RWM movement (Fig. 8B) was similar between the three groups at low frequencies (f < 1 kHz), but the RWM movement decreased most in ears collected at 3 days at high frequencies (f>5 kHz).
Figure 8.
Change of the TM and RWM displacement magnitude in dB relative to contralateral control in three groups. (A) TM in pressure-released bulla; (B) RWM in pressure-released bulla. The magnitude change results were calculated from the displacement amplitude data in Fig. 6 and Fig. 7.
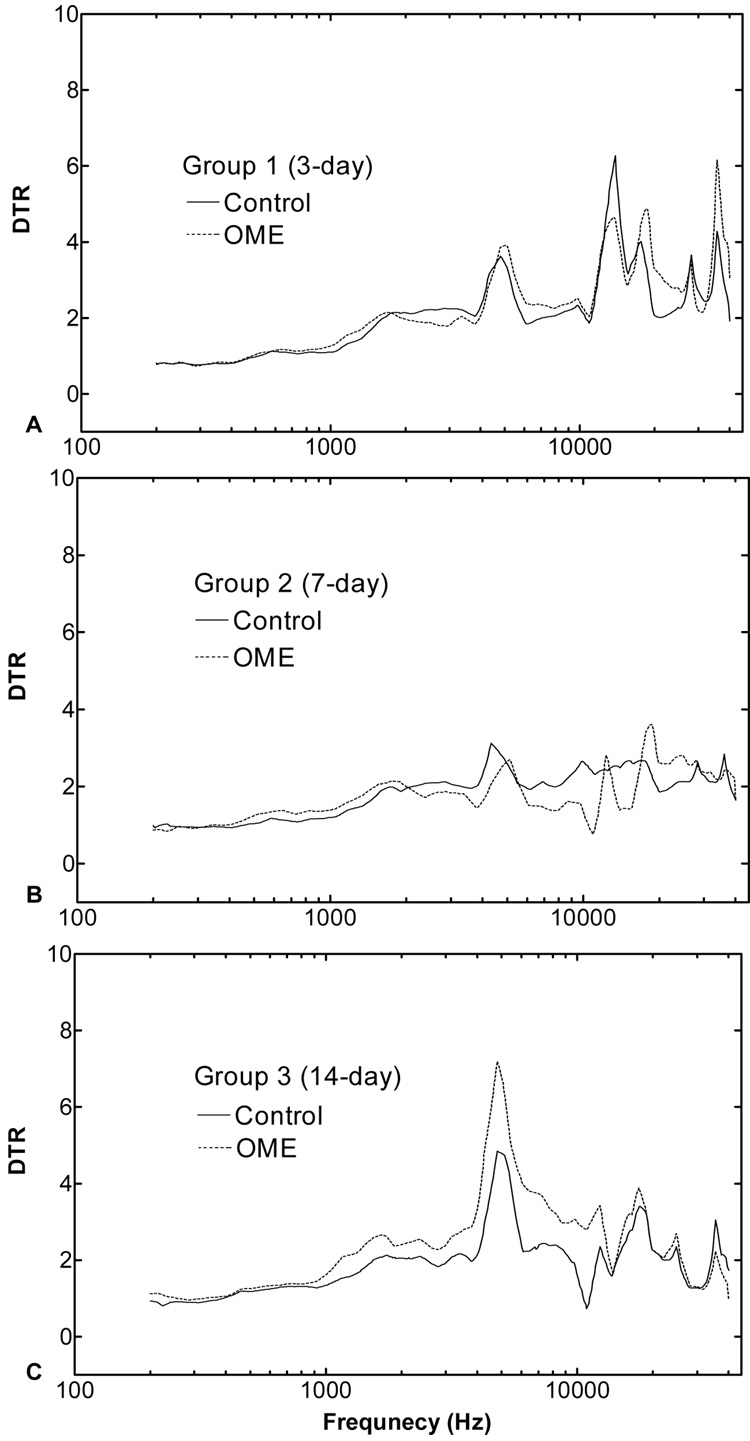
The displacement transmission ratio (DTR) of the TM to RWM obtained from three groups of guinea pigs is shown in Fig. 9. DTR represents the sound transmission from the TM and middle ear ossicular chain into the cochlea. The acoustic-mechanical transmission of the ossicular chain is generally described as the displacement transmission ratio of the TM to stapes footplate (Gan et al., 2006). In this study, the measurement of the stapes vibration was replaced by the measurement of the RWM because of the limitation of guinea pig middle ear structure for accessing the footplate with a small opening on the bulla. As shown in Fig. 9, the differences of the DTR between control and OME ears in ears collected 3 and 7 days after LPS injection were small and differences were significant only at a few frequencies (e.g., 7~10 kHz in ears collected at 7 days). In ears collected at 14 days (Fig. 9C), the DTR of the OME ears was higher than that in control ears at frequencies of 1~12 kHz and the statistics analysis showed a significant difference at frequencies of 1.2~12 kHz. The higher DTR in OME ears indicates the lower transmission of sound energy through the ossicular chain.
Figure 9.
The displacement transmission ratio (DTR) of the TM to round window in contralateral control (solid lines) and OME (dash lines) ears of three groups. Ears were collected 3 (A), 7 (B), and 14 (C) days post-LPS injections. The ratios were calculated from the data of Fig. 6 and Fig. 7.
DISCUSSION
Guinea pig OME model
In this study, OME was created by injection of LPS in the middle ear of guinea pigs as described previously (Ohashi et al., 1991) and is likely due to release of a variety of vasoactive amines and inflammatory mediators (Musson et al., 1978). Our tympanometry measurements also support the presence of OME in the experimental ears of the current study and all criteria were negative for OME in the control ears.
The experiments were divided into three groups which represent the early (3 days), medium (7 days) and chronic stages (14 days) of OME based on suggested time course of the inflammation (Ohashi et al., 1988). The OME is a self-limiting disease and the inflammation in the middle ear usually causes large amount of serous effusion at the early stage. The OME is in a recovery process at the medium stage when moderate effusion and pressure were observed in the middle ear (Ohashi et al., 1988, 1991). The inflammation continues without treatment and the OME developed into the chronic stage wherein the effusion becomes more viscous and structural changes occur in the TM, RWM, ligaments, and other fibrous tissues (Keithley et al., 1990; Paparella, 1976). Our criteria of OME and the correlative laser measurements are consistent with the course of the inflammation after inoculation by LPS.
Otoscopy was used to observe the morphological change of the TM in OME ears. The TM in control ears appeared transparent under otoscopy, while the TM in OME ears appeared cloudy. The change of the TM transparency might be caused by inflammatory response of the TM and middle ear effusion. TMs of the OME ears in Groups 2 and 3 were retracted by negative pressure in the middle ear as observed in this study. These findings are similar to the clinical examinations reported by Karma et al. (1989).
The current tympanometric results further demonstrate OME and are similar to clinical findings in patients with OME (Beery et al., 1975). The significant reduction of middle ear compliance observed in this study differed from the recent findings in temporal bones by Dai et al. (2008). In their human temporal bone study, the injection of 0.3 ml fluid plus air pressure in the middle ear did not cause a significant change of the middle ear compliance because the 0.3 ml fluid injected in the middle ear cavity is a small fraction of the air volume in human temporal bone. However, the compliance change in OME ears observed in guinea pig ears is consistent with the findings of Ravicz et al.’s study (2004) in which a significant change of TM stiffness was observed in human temporal bones after the middle ear was filled with fluid. Thus, the fluid-induced change in TM stiffness and significant change of TM compliance detected in this study were likely the result of fluid in the middle ear cavity.
Middle ear mechanics change in OME
In this study, the experiments were performed in three groups, representing the early, medium, and chronic stages of OME. Different effects of OME on middle ear movement were observed in those three stages of OME (Fig. 6 and Fig. 7, Table 1). However, it is clearly seen in Fig. 6 that the negative middle ear pressure induced by inflammation in all three groups (intact bulla) influenced TM movement at low frequencies (f < 1000 Hz). This observation is similar to the measurement obtained in human temporal bones when the middle ear static pressure was varied from 0 to −20 cm H2O (Gan et al.,2006).
In Group 1, the reduction of the TM and RWM movements was mainly caused by the effusion and pressure in the middle ear, which were induced by inflammation of the middle ear and also likely dysfunction of the Eustachian tube (Ohashi et al., 1991). In Group 2, seven days after LPS injection, the absolute value of negative pressure detected by tympanometry is the lowest among 3 experimental groups while the compliance of the OME middle ears was the highest (Fig. 3). Thus, the maximum difference of the TM displacement between the intact bulla and the pressure-released bulla was observed at 7 days. Compared with ears collected earlier, in ears collected at 14 days (chronic OME stage) the reduction of TM and RWM mobility was less significant at f > 20 kHz. One possible explanation would be the increased middle ear system stiffness by negative pressure and structural changes with chronic OME. The increased stiffness of the middle ear is possible to improve the TM vibration at high frequencies (Dai et al., 2007b). The decreased DTR of the TM to RWM in this group at high frequencies also indicates a structural change in ears with OME.
Usually the vibration of stapes footplate is identified as the output of the middle ear for sound transmission. However, the anatomy of the guinea pig middle ear makes it difficult to access the footplate without a huge opening of the bulla. Therefore, we measured the RWM instead of the stapes footplate. The movement of the footplate can be derived from the movement of the RWM because cochlear fluid is assumed to be incompressible. Thus, the RWM vibration change indicates the stapes movement change. The displacement of RWM movement in OME ears was reduced with the decrease of TM displacement which is consistent with previous findings in which stapes mobility decreased with TM movement reduction (Gan et al., 2006).
Possible mechanisms of middle ear movement reduction in OME
Effusion and negative pressure are believed to be 2 main factors influencing middle ear function with OME. The experimental ears had been developed OME through the induction of LPS which is a bacteria component causing inflammation in the middle ear. The inflamed mucosa caused the effusion accumulation in the middle ear and the negative pressure was built up due to dysfunction of the Eustachian tube. The combination of effusion and negative pressure reduced the TM vibration at both low and high frequencies. The effect of middle ear effusion or pressure has been investigated in various studies in human temporal bones and animal models (von Unge et al., 1994; Murakami et al., 1997; Rosowski et al., 2002; Ravicz et al., 2004; Gan et al., 2006; Dai et al., 2007a, 2008). At low frequencies (f < 400 Hz), the stiffness of the middle ear ossicular chain dominates the regulation of the TM movement while the mass affects TM vibration at high frequencies. The negative pressure in the middle ear drew the TM medially and increased its stiffness. Thus, the reduction of TM displacement amplitudes may be due to several possible mechanisms. The effusion in the TM increased the TM mass and reduced its mobility at high frequency. Beyond the effusion and pressure in the middle ear, structural changes with OME may play another role in reduction of the middle ear function, especially in the chronic OME case.
Comparison with other studies
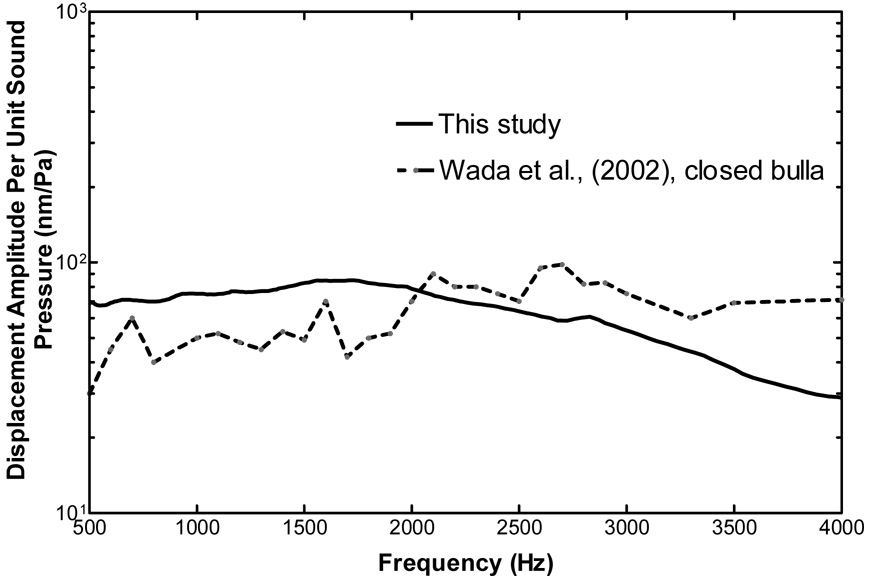
Wada et al. (2002) used a time-averaged speckle pattern interferometry to measure TM movement. Figure 10 shows the comparison of the TM vibration at the umbo measured in this study with those results (Fig. 17C of their paper). The displacement amplitudes obtained from this study are slightly higher at frequencies of 500 ~ 2000 Hz. However, the TM displacement per unit of sound pressure gradually decreased with increasing frequencies (f > 3000 Hz). This is similar to Wada et al.,’s results except that the umbo displacement measured by Wada et al., decreased very slowly. These differences may be due to the different experimental setups.
Figure 10.
Comparison of TM (umbo) displacement at control with Wada et al’s (2002, Fig. 17 C) results measured by time-average speckle pattern interferometry. The control data of this study was derived from the peak to peak displacements of the TM in contralateral control ears (Fig. 5).
Larsson et al., (2005) used Moiré interferometry to measure the vibration of the pars flaccida of the TM in a gerbil OME model (created by blocking the Eustachian tube with glue). Their results showed that the mean peak displacement of the pars flaccida was increased with OME compared with the control. They concluded that OME caused a loss of mechanical stiffness of the pars flaccida. The observation of thickened and loosed pars flaccida by otoscopy in our study is similar to their observations and their results of pars flaccida vibration give us additional information on TM movement change in OME ears. In Larsson et al.’s study, the mean peak displacement of the pars flaccida in the group with OME was increased threefold as compared with normal controls.
Von Unge et al. (1995) reported that there was a significant decrease of TM displacement in the gerbil OME model created by electro-cauterization of the Eustachian tube. The decrease of the TM displacement after 3.5 days of Eustachian tube blockage in their study is similar to the results of this study and they concluded that the OME seemed to affect the stiffness of TM promptly. With both tympanometry and Moiré interferometry, they tested the material properties of the TM and noted an inflammation-induced change in compliance of the TM itself. In the current study, the decreased compliance and displacement of the TM in guinea pig OME ears indicate that the inflammation caused the change of TM compliance. However, in the von Unge et al.’s study, the displacements of OME ears of gerbil were larger than the normal at 7 days and 3 ~ 4 weeks of post-blockages. This is different from our results collected from ears at 7-days in which the displacement of the TM was lower than that of the control ear.
More precise analysis of middle ear mechanics changes with qualitative assessments of structural parameters needs to be completed to provide more details of how structural changes influence middle ear function in OME. The viscosity of the effusion needs to be measured and the relationship between effusion viscosity and TM movement change should be analyzed in future studies.
CONCLUSION
The guinea pig OME model was successfully created by injection of LPS and evaluated by otoscopy examination, tympanometry measurement, and histology sections. The mobility of tympanic membrane and round window was reduced by effusion and air pressure in the middle ear along with structure change in the guinea pig OME model. The effects of OME on middle ear function show some difference among three experimental groups of guinea pigs which represent different stages of inflammation. This study provided a suitable OME animal model for ear mechanics measurements and useful data for middle ear mechanics analysis in OME.
ACKNOWLEDGEMENT
This work was supported by Oklahoma Center for the Advancement of Science & Technology (HR06-036) and NIH/NIDCD R01DC006632. The authors thank Don Nakmali at Hough Ear Institute for his expert technical assistance. We thank Dr. Ann Thompson at Health Sciences Center, University of Oklahoma for instruction of histology study and many useful suggestions to improve this paper. The authors want to thank the anonymous reviewers for their tremendous efforts to make this paper better understandable.
Footnotes
Publisher's Disclaimer: This is a PDF file of an unedited manuscript that has been accepted for publication. As a service to our customers we are providing this early version of the manuscript. The manuscript will undergo copyediting, typesetting, and review of the resulting proof before it is published in its final citable form. Please note that during the production process errors may be discovered which could affect the content, and all legal disclaimers that apply to the journal pertain.
REFERENCES
- Ar A, Herman P, Lecain E, Wassef M, Huy PT, Kania RE. Middle ear gas loss in inflammatory conditions: the role of mucosa thickness and blood flow. Respir. Physiol. Neurobiol. 2007;155(2):167–176. doi: 10.1016/j.resp.2006.04.011. [DOI] [PubMed] [Google Scholar]
- Beery QC, Andrus WS, Bluestone CD, Cantekin EI. Tympanometric pattern classification in relation to middle ear effusions. Ann. Otol. Rhinol. Laryngol. 1975;84:56–64. doi: 10.1177/000348947508400109. [DOI] [PubMed] [Google Scholar]
- Dai C, Wood MW, Gan RZ. Tympanometry and laser Doppler interferometry measurements on otitis media with effusion model in human temporal bones. Otol. Neurotol. 2007a;28(4):551–558. doi: 10.1097/mao.0b013e318033f008. [DOI] [PubMed] [Google Scholar]
- Dai C, Cheng T, Wood MW, Gan RZ. Detachment and fixation of superior and anterior malleus ligament: experiment and modeling. Hear. Res. 2007b;230(1–2):24–33. doi: 10.1016/j.heares.2007.03.006. [DOI] [PMC free article] [PubMed] [Google Scholar]
- Dai C, Wood MW, Gan RZ. Combined effect of fluid and pressure on middle ear function. Hear. Res. 2008;236(1–2):22–32. doi: 10.1016/j.heares.2007.11.005. [DOI] [PMC free article] [PubMed] [Google Scholar]
- Dirckx JJJ, Decraemer WF. Area change and volume displacement of the human tympanic membrane under static pressure. Hear. Res. 1992;62:99–104. doi: 10.1016/0378-5955(92)90206-3. [DOI] [PubMed] [Google Scholar]
- Gan RZ, Dai C, Wood MW. Laser interferometry measurements of middle ear fluid and pressure effects on sound transmission. J. Acoust. Soc. Am. 2006;120(6):3799–3810. doi: 10.1121/1.2372454. [DOI] [PubMed] [Google Scholar]
- Gan RZ, Dyer RK, Wood MW, Dormer KJ. Mass loading on ossicles and middle ear function. Ann. Otol. Rhinol. Laryngol. 2001;110:478–585. doi: 10.1177/000348940111000515. [DOI] [PubMed] [Google Scholar]
- Karma PH, Penttila MA, Sipila MM, Kataja MJ. Otoscopic diagnosis of middle ear effusion in acute and non-acute otitis media. I. the value of different otoscopic findings. Int. J. Pediatr. Otorhinolaryngol. 1989;17:37–49. doi: 10.1016/0165-5876(89)90292-9. [DOI] [PubMed] [Google Scholar]
- Keithley EM, Krekorian TD, Sharp PA, Harris JP, Ryan AF. Comparison of immune-mediated models of acute and chronic otitis media. Eur. Arch. Otorhinolaryngol. 1990;247(4):247–251. doi: 10.1007/BF00178996. [DOI] [PubMed] [Google Scholar]
- Larsson C, Dirckx JJJ, Bagger-Sjöbäck D, von Unge M. Pars flaccida displacement pattern in otitis media with effusion in the gerbil. Otol Neurotol. 2005;26(3):337–343. doi: 10.1097/01.mao.0000169770.31292.75. [DOI] [PubMed] [Google Scholar]
- Larsson C, Dirckx JJJ, Decraemer WF, Bagger-Sjöbäck D, von Unge M. Pars flaccida displacement pattern in purulent otitis media in the gerbil. Otol. Neurotol. 2003;24(3):358–364. doi: 10.1097/00129492-200305000-00002. [DOI] [PubMed] [Google Scholar]
- Lee C-Y, Rosowski JJ. Effects of middle-ear static pressure on pars tensa and pars flaccida of gerbil ears. Hear. Res. 2001;153:146–163. doi: 10.1016/s0378-5955(00)00269-0. [DOI] [PubMed] [Google Scholar]
- Murakami S, Guo K, Goode RL. Effect of middle ear pressure change on middle ear mechanics. Acta. Otolaryngol. 1997;117:390–395. doi: 10.3109/00016489709113411. [DOI] [PubMed] [Google Scholar]
- Musson RA, Morrison DC, Ulevitch RJ. Distribution of endotoxin (lipopolysaccharide) in the tissues of lipopolysaccharide-responsive and -unresponsive mice. Infect. Immun. 1978;21(2):448–457. doi: 10.1128/iai.21.2.448-457.1978. [DOI] [PMC free article] [PubMed] [Google Scholar]
- Ohashi Y, Nakai Y, Esaki Y, Ohno Y, Sugiura Y, Okamoto H. Experimental otitis media with effusion induced by lipopolysaccharide from Klebsiella pneumoniae. Mucociliary pathology of the eustachian tube. Acta. Otolaryngol. (Suppl.) 1991;486:105–115. doi: 10.3109/00016489109134989. [DOI] [PubMed] [Google Scholar]
- Ohashi Y, Nakai Y, Ikeoka H, Esaki Y, Ikeoka H, Kato S, Kato M. Experimental otitis media with effusion induced by lipopolysaccharide from Klebsiella pneumoniae: mucociliary pathology of the middle ear. Am. J. Otolaryngol. 1988;9(2):83–89. doi: 10.1016/s0196-0709(88)80012-7. [DOI] [PubMed] [Google Scholar]
- Paparella MM. Pathogenesis of middle ear effusions. Ann. Otol. Rhinol. Laryngol. 1976;85(2 Suppl 25 Pt 2):63–65. doi: 10.1177/00034894760850S213. [DOI] [PubMed] [Google Scholar]
- Ravicz ME, Rosowski JJ, Merchant SN. Mechanisms of hearing loss resulting from middle-ear fluid,”. Hear. Res. 2004;195(1–2):103–130. doi: 10.1016/j.heares.2004.05.010. [DOI] [PubMed] [Google Scholar]
- Rosowski JJ, Lee C-Y. The effect of immobilizing the gerbil’s pars flaccida on the middle-ear’s response to static pressure. Hear. Res. 2002;174:183–195. doi: 10.1016/s0378-5955(02)00655-x. [DOI] [PubMed] [Google Scholar]
- von Unge M, Decraemer WF, Dirckx JJJ, Bagger-Sjoback D. Shape and displacement patterns of the gerbil tympanic membrane in experimental otitis media with effusion. Hear. Res. 1995;82(2):184–196. doi: 10.1016/0378-5955(94)00017-k. [DOI] [PubMed] [Google Scholar]
- Wada H, Ando M, Takeuchi M, Sugawara H, Koike T, Kobayashi T, Hozawa K, Gemma T, Nara M. Vibration measurement of the tympanic membrane of guinea pig temporal bones using time-averaged speckle pattern interferometry. J. Acoust. Soc. Am. 2002;111(5):2189–2199. doi: 10.1121/1.1467671. [DOI] [PubMed] [Google Scholar]
- Wilson JP, Johnstone JR. Basilar membrane and middle-ear vibration in guinea pig measured by capacitive probe. J. Acoust. Soc. Am. 1975;57(3):705–723. doi: 10.1121/1.380472. [DOI] [PubMed] [Google Scholar]


