Abstract
Normal cells reach senescence after a specific time and number of divisions, leading ultimately to cell death. Although escape from this fate may be a requisite step in neoplastic transformation, the mechanisms governing senescent cell death have not been well investigated. We show here, using normal human epidermal keratinocytes, that no apoptotic markers appear with senescence. In contrast, the expression of several proteins involved in the regulation of macroautophagy, notably Beclin-1 and Bcl-2, was found to change with senescence. The corpses occurring at the senescence growth plateau displayed a large central area delimited by the cytokeratin network that contained a huge quantity of autophagic vacuoles, the damaged nucleus, and most mitochondria. 3-methyladenine, an inhibitor of autophagosome formation, but not the caspase inhibitor zVAD, prevented senescent cell death. We conclude that senescent cells do not die by apoptosis, but as a result of high macroautophagic activity that targets the primary vital cell components.
Senescence is described as a tumor suppressor mechanism that limits proliferation of altered cells.1 It occurs in vivo with advancing age, as well as in culture because of both telomere erosion and increasing oxidative damage.2 Despite these alterations, senescent cells are not dead cells: they maintain a metabolic activity, different from that of young cells.3 However, they remain in this state only for a while, and finally die. Although escape from this fate could be a requisite step in neoplastic transformation, how cells die once they have become senescent has not been much investigated, and the results remain controversial.
Cell death can occur accidentally, in response to an insult, or as the result of a genetic program, activated for example during development or in response to a specific signal. Death following senescence fits with the definition of programmed cell death, because (i) it is time-scheduled and (ii) senescent cells express a genetic program different from that of young cells.4,5,6,7,8,9,10,11 Two main types of programmed cell death have been described: apoptosis (type I), and autophagic programmed cell death (type II). Apoptosis involves characteristic morphological and biochemical changes, including cytoplasmic and nuclear condensation, blebbing, chromatin condensation, oligonucleosomal DNA degradation, and final cell fragmentation into apoptotic bodies. Apoptosis is attributed mainly to caspase activation.12 Autophagic programmed cell death is accompanied by an increase in macroautophagic activity and is believed to occur through the ensuing degradation of many vital cell components.13,14 The macroautophagic process starts with sequestration of a damaged cell component by a double membrane whose origin is controversial.15,16,17 The autophagosome resulting from closure of this membrane then fuses with lysosomes to form an autophagolysosome, inside which the sequestered material is degraded by hydrolytic enzymes at acidic pH. The formation and migration of all these vesicles are orchestrated by about 30 Atg genes17,18 and depend on the integrity of the cytoskeleton, which is in contrast degraded during apoptosis.19 Caspase activation is not required20 and may even inhibit the autophagic pathway.21 Necrosis, although originally described as the process of accidental cell death, might be partly programmed. It is defined as a type of cell death lacking the characteristics of apoptosis and autophagy, but both its cellular manifestations and its molecular pathways are poorly described. It is generally recognized, however, that necrosis involves early plasma membrane lysis, organelle swelling and lysis, and some vacuolization.22,23
The purpose of this study was therefore to establish whether senescent cells die by apoptosis, autophagic programmed cell death, necrosis, or some other undescribed or mixed type of cell death. Throughout this text, we use the expression senescent-cell death to refer to the mechanism of death following senescence.
Materials and Methods
Cell Culture
Normal human epidermal keratinocytes (NHEKs), purchased from Clonetics (CC-2501), were collected from 6 different females of different races and ages. They were grown at 37°C in an atmosphere of 5% CO2 in KGM-2 BulletKit medium consisting of modified MCBD 153 with 0.15 mmol/L calcium, supplemented with bovine pituitary extract, epidermal growth factor, insulin, hydrocortisone, transferrin, and epinephrin (CC-3107, Clonetics). Such a serum-free low-calcium medium has been shown to minimize keratinocyte terminal differentiation.24 Cells were seeded as recommended by the supplier and split at 70% confluence. The number of population doublings (PD) was calculated at each passage by means of the following equation: PD = ln(number of collected cells/number of plated cells)/ln2. For positive controls of apoptosis, cells were treated for 6 to 18 hours with 20 ng/ml tumor necrosis factor alpha (TNFα) + 10 μg/ml cycloheximide (CHX), or 10 ng/ml tumor necrosis factor-related apoptosis-inducing ligand (TRAIL) + 10 μg/ml CHX.
Flow Cytometry Analysis and Sorting, Annexin-V/Propidium Iodide Assays
NHEKs were analyzed on a Coulter EPICS XL-MCL based on their forward and side scatter factor values and, according to the experiment, subpopulations with different forward and/or side scatter factor values were electrostatically sorted in air. For Annexin-V/propidium iodide staining, cells were processed with an Annexin-V-Alexa 568 kit (Roche, Calbiochem) according to the manufacturer’s recommendations. The results were analyzed with the WinMDI 2.9 software. Alternatively Annexin-V/propidium iodide assays were performed with the same kit on cells grown on glass slides.
Videomicroscopy
Time-lapse videomicroscopy was done with a Zeiss Axiovert 100M equipped with a warm stage. Cells were maintained under 5% CO2 in closed flasks. Images were taken at 15-minute intervals for 24 to 48 hours.
Immunofluorescence
Cells were fixed with 4% paraformaldehyde in PBS and permeabilized with 0.2% Triton-X100. Slides were incubated with the primary antibody: anti-active caspase-3 (Cell Signaling Technology), anti-keratin 14 (Chemicon International), anti-cytochrome C (Pharmingen), anti-apoptosis inducing factor (AIF; Chemicon International), or anti-MAPLC3 (Santa-Cruz). They were then washed three times with PBS and incubated with the secondary antibody: Rhodamine red-conjugated anti-Mouse IgG or Rhodamine red-conjugated anti-Rabbit IgG (Jackson ImmunoResearch Laboratories). Nuclei were stained with Hoechst 33258 at 1 μg/ml for 3 minutes. Slides were analyzed with either a Zeiss AxioPlan2 epifluorescence microscope, or a Zeiss Axio Imager Z1-ApoTome epifluorescence microscope for optical sectioning.
Western Blotting
Cells were lysed in the following solution: 27.5 mmol/L Hepes pH 7.6, 1.1 M/L urea, 0.33 M/L NaCl, 0.1 M/L EGTA, 2 mmol/L EDTA, 60 mmol/L KCl, 1 mmol/L dithiothreitol, and 1.1% NP40. The total protein concentration was measured with the Bio-Rad protein assay. Proteins were resolved by SDS-polyacrylamide gel electrophoresis and transferred to nitrocellulose membranes (Hybond-C extra, Amersham). Equal loading was checked after Ponceau red staining of the membranes. The primary antibodies used were: anti-active caspase-3 (Cell Signaling Technology), anti- poly(ADP-ribose) polymerase (PARP; Alexis Biochemical), anti Bcl-2 (Santa Cruz), anti-keratin-14 (Chemicon International), anti-Beclin-1 (Santa Cruz), anti-Bid (Pharmingen), anti-lysosomal-associated membrane protein 1 (Santa Cruz), and anti-actin (Santa-Cruz). The secondary antibody used was a peroxidase-conjugated rabbit anti-sheep IgG or a peroxidase-conjugated goat anti-mouse IgG (Jackson ImmunoResearch Laboratories). Peroxidase activity was revealed with an enhanced chemiluminescence kit (Amersham). The films were quantified by scanning with a Syngene Chemi-Genius Bio Imaging System.
Terminal Deoxynucleotidyl Transferase dUTP Nick-End Labeling and Comet Assays
The terminal deoxynucleotidyl transferase dUTP nick-end labeling (TUNEL) assay was performed with the Apoptag Kit (Intergen) according to the manufacturer’s recommendations. For comet assays, 10,000 cells were embedded in 80 μl of 0.5% low-melting-point agarose at 37°C and the suspension was immediately pipetted onto a TREVIGEN Inc. cometslide, which was then placed at 4°C in the dark for at least 30 minutes. The slides were immersed in prechilled Lysis Solution and left at 4°C for 60 minutes. They were then left in alkaline solution for 20 minutes at room temperature in the dark. The migration was performed at pH = 8 or pH >13 in Tris borate-EDTA buffer at 1 V/cm for 20 minutes. Quantitative analysis (%DNA in the comet tail) was performed with the Tritek Comet Score freeware.
Fluorescence Staining of Mitochondria, Lysosomes, and Autophagic Vacuoles
Monodansylcadaverine, Lysotracker green, and Mitotracker red were from Molecular Probes. Living cells were incubated at 37°C with monodansylcadaverine (MDC; 0.05 mmol/L), Lysotracker green (100 nmol/L), or Mitotracker red (25 nmol/L) added directly to the cell culture medium (respective incubation times: 10 minutes, 2 hours, and 30 minutes). Nuclei were stained with vital Hoechst 33342 at 1 μg/ml for 10 minutes at 37°C.
Transmission Electron Microscopy
Cell pellets were fixed with 2.5% glutaraldehyde in 0.1 M/L cacodylate buffer, pH 7.4 for at least 30 minutes at 4°C. After fixation, the specimens were thoroughly washed in 0.1 M/L cacodylate buffer and then postfixed with 1% osmium tetroxide in the same buffer for 1 hour at room temperature, stained en bloc with 2% uranyl acetate in distilled water for 15 minutes, dehydrated in graded acetonitrile, and embedded in Epon. Ultrathin sections (80 to 100 nm thick) mounted on 150-mesh grids were stained with 2% uranyl acetate solution and Reynolds lead citrate solution.25 The electron micrographs were taken with a Hitachi H600 electron microscope at 75 kV.
Results
Kinetics of Senescence and Senescent-Cell Death
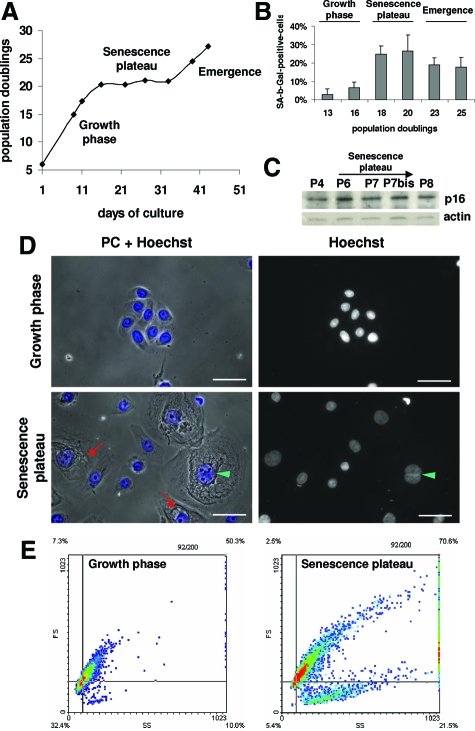
We first investigated the kinetics of senescence and senescent-cell death in two normal human cell types, dermal fibroblasts (NHDFs) and epidermal keratinocytes (NHEKs). Fibroblasts are the most commonly used cell type in senescence studies; keratinocytes are more relevant to tumorigenesis studies. We have used fibroblasts from three and keratinocytes from six different donors, all female, of different ages and races. Dermal fibroblasts grew for 50 to 60 PDs, according to the donor, and then reached a senescence growth plateau where they remained for several months, suggesting that the level and speed of cell death in this cell type were very low (data not shown). In contrast, keratinocytes reached a senescence growth plateau after only 15 to 25 PDs (according to the donor); this plateau lasted only a few days to 2 to 3 weeks (according to the donor), and then almost all cells apparently died massively and detached from the dish, while a few clones of partly transformed cells emerged (Figure 1A). Since the death of senescent keratinocytes was more massive and rapid than that of fibroblasts, and since emergence, possibly resulting from senescent-cell escape from death, was observed only with keratinocytes, we subsequently focused our studies on senescent-keratinocyte death.
Figure 1.
Growth curve and characteristics of young, senescent, and dying keratinocytes. A: NHEK growth curve under standard conditions. B: SA-β-Gal assays. SA-β-Gal-positive cells in each phase were counted among about a thousand cells in at least five microscopic fields. Results are given as means ±SD of all field counts. The percentages at 18 and 20 PD are statistically different from those at 13 PD (P = 6 × 10⁻⁷ and P = 4 × 10⁻¹⁰), and the percentages at 23 and 25 PD are statistically different from those at 20 PD (P = 5 × 10−05 and P = 3 × 10−05). C: Western-blot analysis of the CKI p16INK4 level in total cell extracts. Actin was used as a loading control. The quantification of the film is given in supplemental Figure S1 at http://ajp. amjpathol.org. D: Cells during the exponential growth phase and at the senescence plateau were stained with Hoechst and observed under phase contrast and by epifluorescence microscopy. Senescent keratinocytes display vacuole-like structures of different sizes generally close to the nucleus (red arrows); they are often binucleated (green arrowhead). Scale bars = 20 μm. E: Flow cytometry analysis of the side-scatter (X) and forward-scatter (Y) factors, ie, granularity and size respectively, of NHEKs during the exponential growth phase and at the senescence plateau. The colors represent the point densities. The two cursors help to see that at the senescent growth plateau the overall population shifts in size and granularity and becomes very heterogeneous. A subpopulation of cells of very low size but high granularity, probably corpses, appears at the senescence plateau. The results from (A) to (E) are representative of different experiments performed with cells from six different donors.
Keratinocytes at the growth plateau displayed all of the characteristics of senescent cells: senescence-associated β-galactosidase activity at pH 6 (Figure 1B), upregulation of the CKI p16INK4 (Figure 1C and supplemental Figure S1 at http://ajp.amjpathol.org), a 5- to 100-fold larger size than young cells, numerous dense particles (probably damaged components), and several vacuole-like structures of different sizes (Figure 1D). After Hoechst staining, their nuclei often appeared bigger than those of young cells, and about 20% of the cells were polynucleated (Figure 1D). Flow cytometry analysis of forward and side scatter factors, ie, size and granularity respectively, revealed dramatic changes in the cell population at the senescence plateau, with a global increase of these two parameters, a great variability within the population regarding these two parameters, and the appearance of a subpopulation of smaller cells with a high granularity, probably corpses (Figure 1E).
Morphological and Kinetic Features of Senescent-Keratinocyte Death
We then performed a more specific kinetic analysis of keratinocyte death by recording all types of cell death using Annexin-V/propidium iodide (AnV/PI) assays. Annexin-V is an appropriate marker of any type of cell death—apoptosis, autophagy, or necrosis—because cells undergoing either apoptosis26 or autophagy27 have been shown to externalize phosphatidylserines and because corpses generated by any mechanism ultimately lose their plasma membrane integrity. PI staining similarly reveals cells having lost their membrane integrity.
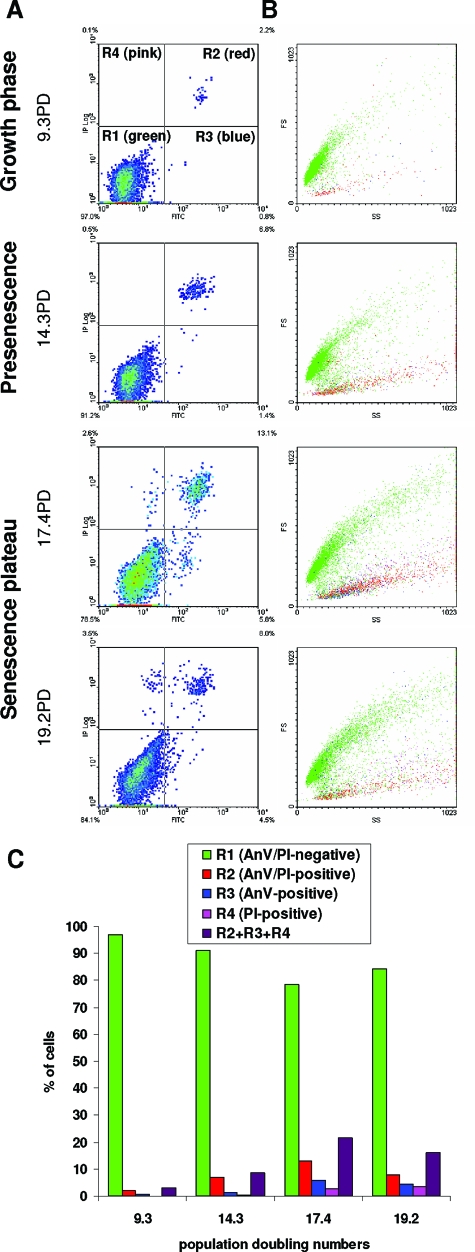
We first used flow cytometry to quantify AnV- and PI-positive cells in the whole population as the number of population doublings increased. The results revealed from the presenescent stage onward a general shift of the population toward an increase in AnV/PI staining, with the formation of three subpopulations (Figure 2, A and B). The first one is positive for both markers. It is composed of the smaller cells with high granularity, proving they are corpses. The second subpopulation is composed of AnV-negative/PI-positive cells. As the preceding ones, these cells are generally small and have a high granularity. They are therefore also corpses. The third subpopulation consisted of AnV-positive but PI-negative cells, and can therefore be classified as dying cells. They are found in all of the ranges of size and granularity, but mostly among the largest cells. At the senescence plateau, the proportion of dying and dead cells reached almost 20% of the total population (Figure 2C).
Figure 2.
Flow cytometric analysis of cell death occurrence during NHEK culture. A: NHEKs grown under standard conditions were analyzed by flow cytometry after an increasing number of population doublings for Annexin-V (X) and PI (Y) staining. Colors represent point densities. Cursors were placed after considering autofluorescence (not shown). Different subpopulations are distinguishable: R1, AnV/PI-negative, ie, live cells, R2, AnV/PI-positive, ie, dead cells, R3, AnV-positive but PI-negative, ie, dying cells, and R4, AnV-negative PI-positive, also dead cells. B: Forward scatter (Y) and side scatter (X) factors of the four subpopulations R1, R2, R3 and R4. R1 (in green) is the main cell population, with a wide range of forward and side scatter factors values, ie, with a more or less developed senescent phenotype; they are alive. R2 (in red) is a subpopulation with a smaller size and a wide range of granularity; it appears with doubling and consists of corpses. R3 cells (in blue) are found in the whole population and display all sizes and granularities. They are senescent cells in the process of dying. R4 (in pink), like R2, consists of corpses. C: Proportions of cells in the different subpopulations.
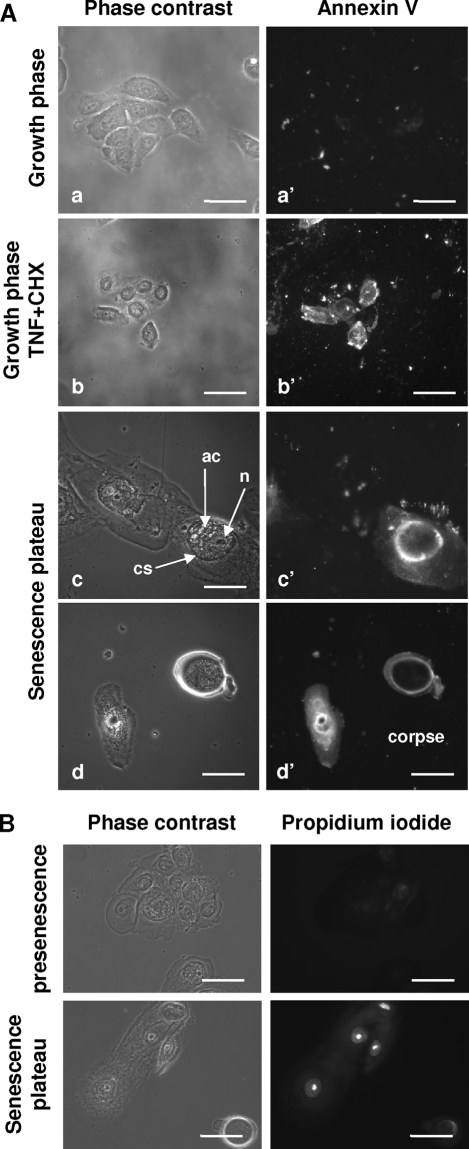
We then examined more precisely the morphology of the AnV-positive cells at the senescence plateau by a microscopic analysis. For comparison with the morphology of typical apoptotic cells, keratinocytes in the growth phase were treated with TNFα+CHX. These cells appeared stained at the level of the plasma membrane as expected, whereas untreated cells were negative (Figure 3A). At the senescence plateau, the AnV-positive cells typically display the morphology of senescent cells. Some diffuse Annexin-V staining was observable in their cytoplasm, but the highest staining localized to a central area that always contained a damaged nucleus and various other altered components (Figure 3A). The intracellular nature of this staining suggests that these senescent cells have their membrane permeabilized. PI staining confirmed the permeabilized state of the membrane in these large, flat senescent cells (Figure 3B), confirming they were dying, although they were still adherent. Among cells at the senescent plateau, corpses, identified by their small size and high density, also displayed some staining delineating a central area, with more diffuse staining of the remaining cytoplasm (Figure 3A).
Figure 3.
Morphological characteristics of dying and dead cells at the senescence plateau. A: NHEKs at different phases were processed for the Annexin-V assay. As a positive control for apoptosis, keratinocytes in the growth phase were treated with TNFα+CHX. Young keratinocytes (a and a′) are negative. Young apoptotic keratinocytes (b and b′) are stained at the level of the plasma membrane. The senescent keratinocyte (c and c′) on the right, but not the senescent keratinocyte on the left, displays some diffuse cytoplasmic staining and some staining inside a central structure (cs) containing a damaged nucleus (n) and various other altered components (ac). The corpse (d and d′) also displays some staining of its remaining cytoplasm and of its central structure. Scale bars = 20 μm. B: NHEKs at presenescence and senescence were processed for propidium iodide staining. Nuclear staining, indicative of nuclear membrane damage, was recorded only in cells at the senescence plateau. Scale bars = 30 μm.
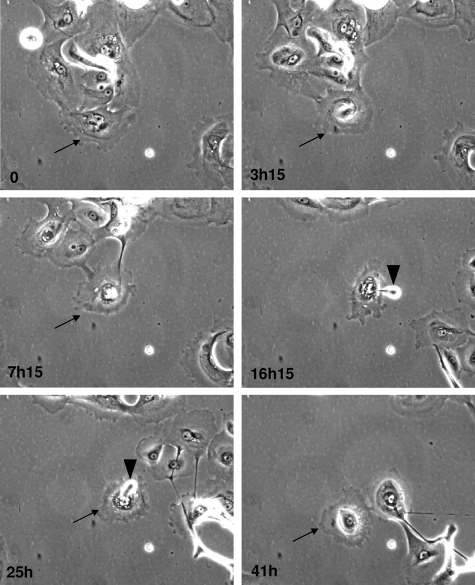
To evaluate the kinetics of the death process at the single-cell level, we used time-lapse phase-contrast videomicroscopy. Pictures (Figure 4 and supplemental video, see http://ajp.amjpathol.org) clearly revealed typical senescent cells with a damaged nucleus evolving through progressive encircling of the nucleus by refringent components. Cells in this state progressively detached from the others and acquired a rounded shape, but remained attached to the dish and continued to move randomly for several tens of hours. Cells undergoing this process were found to secrete big, dense particles repeatedly, probably by exocytosis. On the basis of the videomicroscopy analysis, the duration of the death process was estimated at 24 hours to a few days.
Figure 4.
and supplemental video, see http://ajp.amjpathol.org. Time-lapse phase contrast videomicroscopy of senescent cells undergoing death NHEKs at the senescence plateau were followed by videomicroscopy. Pictures were taken at 15-minute intervals for 24 to 48 hours. Some images taken at the indicated times were extracted for the figure. The senescent cell that will evolve into a corpse is indicated by an arrow. Note that the nucleus, at first, seems surrounded by a big structure (conspicuous at 3 hours 15 minutes). Then the dying cell detaches from the other cells but remains attached to the support for several hours. The dying cell expulses some dense material (arrowheads) several times in the course of the process.
In conclusion, dying cells and corpses at the senescence plateau appear morphologically different from apoptotic cells and apoptotic bodies, which are characterized by their condensed and fragmented nucleus and cytoplasm. In addition, the slowness of the senescent-cell death process does not fit with the duration of apoptosis, which is generally a few hours. PI-positivity might indicate that senescent cells die by necrosis; but no sign of cell swelling or lysis was observed. The presence of numerous vacuole-like structures in senescing cells is reminiscent, rather, of autophagic cell death.
Inhibiting Autophagic Cell Death, but Not Apoptosis, Decreases the Rate of Senescent-Cell Death
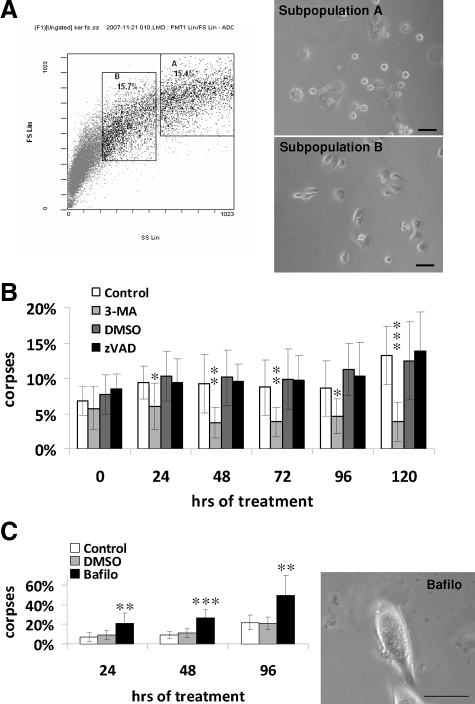
To test the hypothesis that the mechanism of senescent-keratinocyte death is autophagy rather than apoptosis, we examined whether inhibitors of apoptosis or autophagy would differentially affect the level or time course of the death process. zVAD-fmk, a pan-caspase inhibitor, was used to inhibit apoptosis, and 3-methyladenine (3-MA), an inhibitor of the class III phosphatidylinositol 3-kinase (class III PI3K) complex involved in initial autophagosome formation,28 was used to inhibit autophagy. In a first experiment, zVAD or 3-MA was applied from the beginning and throughout the culture. 3-MA rapidly inhibited cell growth and induced a senescence-like phenotype (data not shown). This unanticipated effect of 3-MA, probably resulting from a lack of damaged component turnover, forced us to settle on a protocol in which the inhibitors tested were applied to pure populations of already senescent cells. For this purpose, NHEKs at the senescence plateau were analyzed by flow cytometry according to forward and side scatter factors values. The subpopulation with the highest forward and side scatter factors values and the subpopulation with values just below the highest were sorted and plated (Figure 5A). Microscopic observation of the subpopulation with the highest scatter factor values revealed that many of these cells were unable to adhere, suggesting that this subpopulation was engaged too far along the death pathway. The subpopulation with slightly lower scatter factor values was thus assumed to encompass pre-dying senescent cells suitable for this experiment. Cells of this subpopulation were therefore treated with z-VAD or 3-MA for 5 days, and corpses with the typical central area were counted daily. The percentage of corpses increased with time in control cells and, to the same extent, in z-VAD-treated cells. In 3-MA-treated cells it decreased (Figure 5B). These results indicate that senescent-cell death does not occur through a caspase-dependent mechanism but involves a class III PI3K, suggesting that senescent cells do not die by apoptosis but by autophagic cell death.
Figure 5.
Inhibition of autophagy, but not of apoptosis, delays senescent-cell death. A: NHEKs at the senescence plateau were analyzed by flow cytometry according to their forward-scatter (Y) and side-scatter (X) factor values. Two subpopulations were sorted; subpopulation A comprised the 15% of the cells with the highest forward and side scatter factor values, and subpopulation B with the next-highest scatter-factor values. Sorted cells were plated in 12-well plates at 20,000 cells per well and observed 24 hours later under a phase contrast microscope. Many non-plated cells were observed in subpopulation A, indicating that it is enriched in dying cells. Therefore subpopulation B, less engaged in the death pathway, was chosen for the experiment. B: Cells of subpopulation B were continuously treated with 3-MA at 5 mmol/L or with its diluent H2O as a control or with z-VAD at 20 μmol/L or its diluent DMSO. The number of typical corpses with a refringent central area was counted every day under the microscope. The results are means ± SD of counts in 5 random microscopic fields of each well, each condition being duplicated. C: Cells of subpopulation B were treated every 48 hours with 5 nmol/L bafilomycin A1 or its diluent DMSO. The number of corpses was counted as above. The photograph represents the morphology of bafilomycin-treated cells after 96 hours of treatment. Note the presence of a big central area full of very dense, granular material. P values were calculated with the t-test. *P < 0.05, **P < 0.005, and ***P < 0.0005. Those indicated are between 3-MA and control and between bafilomycin and dimenthyl sulfoxide. The other differences are non-significant. Scale bars: 50 μm in (A); 40 μm in (C).
To confirm this conclusion, we examined whether bafilomycin A1, an inhibitor of the H+ pump that decreases the efficacy of digestion inside autophagolysosomes, could freeze the death process in its last stage. Pre-dying senescent cells were sorted as above and treated with bafilomycin. Corpses with the typical central area rapidly accumulated to a high rate (40%) in bafilomycin-treated cultures (Figure 5C). To make sure this was not due to an inherent toxicity of bafilomycin, we applied bafilomycin under the same conditions to cells in the exponential growth phase and measured toxicity by trypan blue exclusion: the percentage of trypan blue-positive cells reached only 23% (Supplemental Figure S2, see http://ajp.amjpathol.org). In addition to increasing the percentage of corpses, bafilomycin modified their appearance: the central area appeared to be full of very dense granular material (Figure 5C). Taken together, these experiments indicate that senescent-cell death involves class III PI3K-mediated autophagosome formation and cell component degradation in acidic compartments.
Senescent Keratinocytes Do Not Display the Hallmarks of Apoptosis, but Display Altered Mitochondria and Nuclei
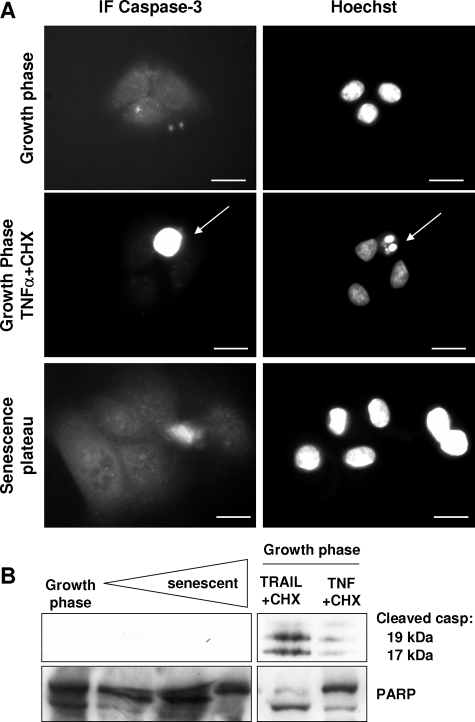
To go beyond the above observations suggesting that senescent cells do not die by apoptosis, we checked for any activation of caspase-3, a major actor of apoptosis. Young cells treated with TNF-α or TRAIL plus CHX were used as a positive control. In immunofluorescence experiments with an antibody recognizing the cleaved active form of caspase-3, senescent cells were negative, in contrast to apoptotic cells (Figure 6A). In Western blots produced with extracts of cells harvested at different time points on the senescence plateau, the cleaved active form of caspase-3 was not detected, whereas it was detected in apoptotic control cells (Figure 6B). We also measured cleavage of PARP, a caspase target. Basal-level cleavage of PARP was observed, without any change during senescence (Figure 6B).
Figure 6.
Caspase-3 is not activated in senescent keratinocytes. A: NHEKs in the growth phase or at the senescence plateau were processed for immunofluorescence with an antibody recognizing the activated form of caspase-3. As a positive control, NHEKs in the growth phase were treated with TNFα+CHX. Neither young nor senescent keratinocytes were positive. In contrast, typical apoptotic cells with condensed and fragmented nuclei were caspase-3 positive (arrows). Scale bars = 10 μm. B: Western blots. Cell extracts were produced with NHEKs in the growth phase and at different time points in the senescence plateau. Extracts of keratinocytes in the growth phase, induced to die by apoptosis with TRAIL+CHX or TNFα+CHX, were used as a positive control.
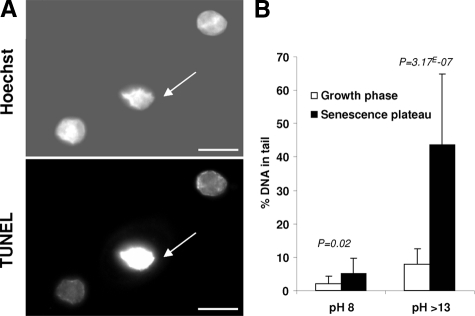
Another molecular hallmark of apoptosis is the DNA degradation to high molecular weight or oligonucleosome-length fragments elicited by caspase-dependent or independent pathways.29 We searched for such DNA fragmentation by the TUNEL assay. Senescent cells with a damaged nucleus were TUNEL-positive, whereas cells with a nucleus still morphologically intact were negative (Figure 7A). Yet, as the TUNEL assay is not strictly specific to apoptosis since it detects both double-strand and single-strand breaks, we used comet assays to better characterize the type of DNA breaks encountered in senescent cells. In these assays, DNA fragments migrate out of a permeabilized nucleus in the form of a comet-like tail. At pH = 8, free DNA fragments result only from double-strand breaks, while under denaturing conditions (pH >13), they also result from single-strand breaks.30 The analysis of cells at the growth phase and at the senescence plateau confirmed that the percentage of DNA breaks increases with senescence, and showed that breaks at senescence are mainly single-strand ones (Figure 7B). Thus, senescent cells do undergo DNA degradation, but not consequently to the activation of an apoptotic pathway.
Figure 7.
Senescent keratinocytes display DNA breaks. A: A TUNEL assay was performed on keratinocytes at the senescence plateau to detect DNA fragmentation. Positive signals were seen only on much-altered nuclei (arrows). Other large nuclei typical of still healthy senescent cells were negative. Scale bars = 5 μm. B: A comet assay was performed on NHEKs in the growth phase or at the senescence plateau in neutral (pH 8) versus alkaline conditions (pH >13) to detect only single- or single- plus double-strand breaks, respectively. The percentage (%) of DNA in the comet tail was assessed in each condition. Each bar represents the mean ±SD of 20 measures. P values were calculated with a t-test.
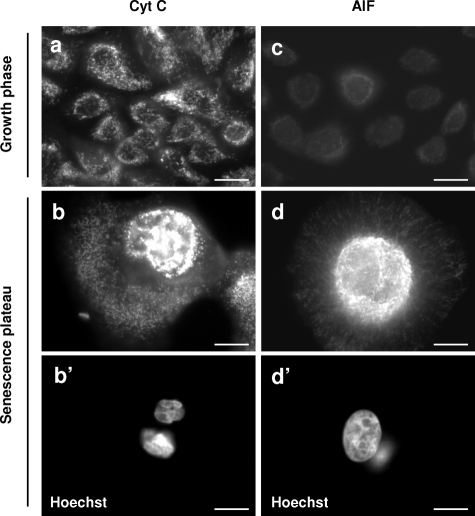
We also investigated by immunofluorescence the potential release from mitochondria of cytochrome C and AIF, two markers of the intrinsic apoptotic pathway.31 In cells at the growth phase, cytochrome C localized discreetly to small sticks (the typical appearance of mitochondria). AIF staining was very faint. In cells at the senescence plateau, the number of cytochrome C- and AIF-stained structures dramatically increased, these structures becoming vesicular and clustered in the vicinity of the nucleus. We never observed a clear translocation of cytochrome C or AIF into the cytoplasm or nucleus (Figure 8). These results indicate that senescent cells do display some mitochondrial alterations, but these alterations were unrelated to apoptosis.
Figure 8.
The mitochondria of senescent keratinocytes are altered but do not release cytochrome C or AIF. NHEKs in the growth phase or at the senescence plateau were processed for immunofluorescence with specific anti-cytochrome C and anti-AIF antibodies. Both signals increase with senescence. The cytochrome C-positive structures change from radiating stick-shaped structures in growth-phase cells (a) to vesicular ones agglutinated in the vicinity of the nucleus in senescent cells (b and b′, note that the shown senescent cell contains two pycnotic nuclei). The AIF staining is very faint in young cells (c). It increases greatly in senescent cells; AIF-positive structures are very numerous and agglutinated around the nucleus (d and d′, note that the nucleus of the shown senescent cell is very large). Senescent keratinocytes do not show clear translocation of AIF into the nucleus or cytochrome C release into the cytosol (b and d). Scale bars = 10 μm.
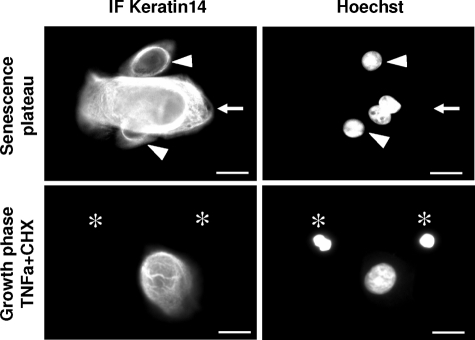
Since one difference between apoptotic and autophagic programmed cell death is the fate of the cytoskeleton,19 we performed cytokeratin 14 detections. In immunofluorescence experiments, the cytokeratin 14-network appeared completely preserved, even more developed, in senescent cells than in growing ones, whereas it was completely disintegrated in TNFα+CHX-induced apoptotic control cells (Figure 9).
Figure 9.
Fate of the cytoskeleton in senescent keratinocytes. The cytokeratin 14 network is preserved during senescent cell death. NHEKs at the senescence plateau were processed for immunofluorescence with a cytokeratin 14-specific antibody and compared with NHEKs in the growth phase undergoing apoptosis after TNFα+CHX treatment. The cytokeratin network appears totally preserved, even overdeveloped, in senescent cells (arrows) compared with the still-young cells visible in the microscopic field (arrowsheads), whereas apoptotic cells, identified by their condensed nuclei (asterisks), are completely cytokeratin14-negative. Scale bars = 10 μm.
Senescent Keratinocytes Display High Macroautophagic Activity
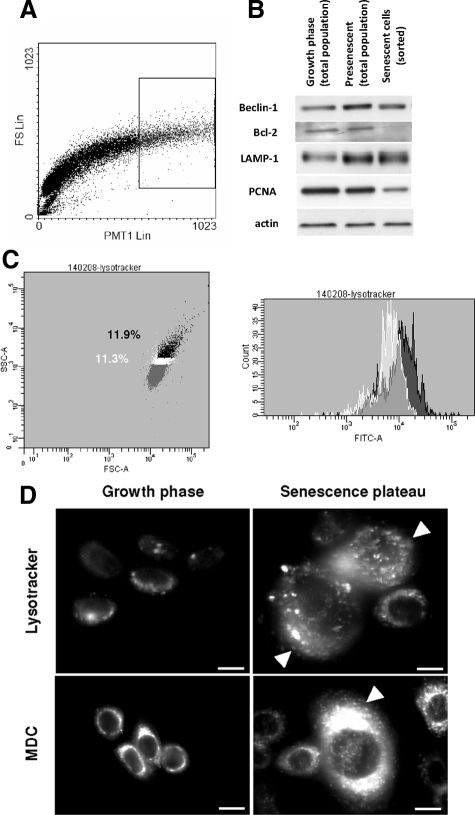
To more specifically document the likelihood that senescent cells die by autophagic cell death, we investigated different markers of macroautophagy by western blotting, flow cytometry, epifluorescence microscopy, and transmission electron microscopy (TEM). We first examined the expression of Atg6/Beclin-1, a subunit of the class III PI3K complex required for initial autophagosome formation.17 Protein extracts were made from cells in the growing phase, cells in the presenescent stage, and from a fluorescence-activated cell sorting (FACS)-sorted subpopulation of cells at the senescence plateau with the highest forward and side scatter factor values (Figure 10A). We observed an increase in Beclin-1 expression as soon as presenescence (Figure 10B and supplemental Figure S3, see http://ajp.amjpathol.org). We also checked Bcl-2, the well-known anti-apoptotic protein, which is also an inhibitor of Beclin-1.32 Bcl-2 expression dramatically decreased in sorted senescent cells (Figure 10B and supplemental Figure S3, see http://ajp.amjpathol.org). We also observed increased expression of lysosomal-associated membrane protein 1, as soon as the presenescent stage (Figure 10B and supplemental Figure S3, see http://ajp.amjpathol.org).
Figure 10.
Expression of autophagic markers in senescent and dying keratinocytes. A: NHEKs at the senescence plateau were analyzed by flow cytometry according to their forward scatter (Y) and side scatter (X) factors. The subpopulation (10.9% in the frame) with the highest forward and side scatter factor values was sorted and used for protein extraction (B) Western-blot analysis of the expression of some markers of autophagosomes and lysosomes. Cell extracts were produced with keratinocytes in the growth phase, at the presenescent stage, and with senescent keratinocytes sorted by FACS in (A). PCNA was used as a sorting quality control and actin as a loading control. These results are representative of 3 independent experiments performed with cells from 2 different donors. C: NHEKs at the senescence plateau were stained with Lysotracker and analyzed by flow cytometry for their side scatter (X) and forward scatter (Y) factors. Then the staining intensity (FITC-A) in the subpopulation with the highest forward and side scatter factor (dark) was compared with that of the subpopulation ranking just below it in terms of scatter-factor values (white). The results show that the cells with the highest factors are the most Lysotracker-positive. (D) NHEKs in the exponential growth phase and at the senescence plateau were stained with either MDC or Lysotracker. The mass of both autophagic vacuoles and lysosomes increases in the large, flat senescent cells (arrowheads). Scale bars = 10 μm.
We further documented the increase in autophagic activity during senescence by using Lysotracker, a cell-permeant probe that fluoresces in acidic organelles, ie, lysosomes and autophagolysosomes (but also late endosomes). Cells were stained with Lysotracker and analyzed by flow cytometry. The subpopulation with the highest forward and side scatter factor values stained the brightest, while staining of the subpopulation ranked next on the scatter factor scale was less intensely stained (Figure 10C). Microscopic analysis confirmed the increase in Lysotracker staining with senescence and highlighted, as expected, a large quantity of small vacuoles (Figure 10D). Similar results were obtained with MDC (Figure 10D), also a marker of acidic compartments.33,34
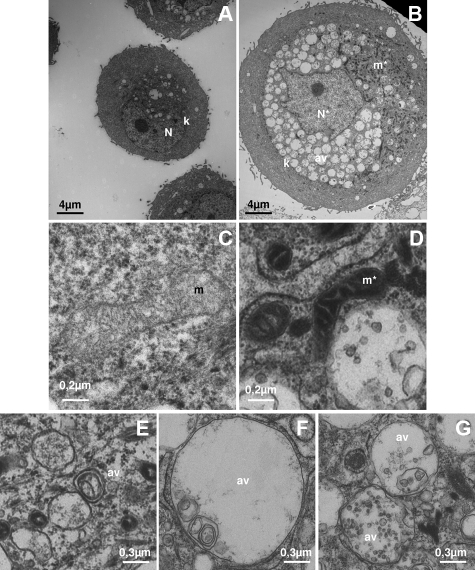
We finally investigated the fine structure of senescent cells by TEM. NHEKs at the senescence plateau were sorted by FACS according to their forward scatter factor, and the subpopulation with the highest factor value was analyzed by TEM by comparison with cells in the exponential growth phase. Keratinocytes in the exponential growth phase displayed a normal organization35 with a typical nucleus, several dispersed organelles, some rare vesicles, and a cytokeratin network (Figure 11A). In contrast, sorted keratinocytes from the senescence plateau displayed a highly partitioned substructure, with a cortical and a central area delimited by the cytokeratin network (Figure 11B). The cortical area appeared clear of any organelles, whereas the central area was full of autophagic vacuoles. The autophagic vacuoles generally contained debris, often membranous (Figure 11, C and D). They accumulated on bafilomycin treatment, and after this treatment they contained more debris than in the control situation (supplemental Figure S4, see http://ajp.amjpathol.org). The mitochondria were either dispersed in this central area or grouped together in an aggregate clustered with the nucleus (Figure 11B). Their morphology appeared altered compared with that of young cells (Figure 11, C and D). Some of these altered mitochondria were found inside autophagic vacuoles (supplemental Figure S4, see http://ajp.amjpathol.org). The nucleus was always found in the central area; it was often deformed and its chromatin often appeared clear, with levels of heterochromatin lower than in young cells (Figure 11B). These TEM observations are in total agreement with the observations made by epifluorescence microscopy with anti-cytokeratin 14 (Figure 9) and with Lysotracker and MDC (Figure 10). Note that the autophagic vacuoles concentrated in the central area of senescent cells might be responsible for the intracellular AnnexinV staining seen in Figure 3, a very recent study having shown that the cytosolic leaflets of endosomes and lysosomes are rich in phosphatidylserine.36 Taken together, these results indicate that senescence is accompanied by high autophagic activity.
Figure 11.
Ultrastructure of dying senescent cells. NHEKs at the senescence plateau (B, D, E, F, G) were analyzed by flow cytometry and sorted according to their forward side factor (not shown). They were then fixed for TEM analysis in parallel with cells in the exponential growth phase (A and C). C and D are details of mitochondria morphologies in NHEKs in growth phase (C) or at the senescence plateau (D), E, F and G are details of autophagic vacuole morphologies in NHEKS at the senescence plateu. N: nucleus, N*: deformed nucleus with less heterochromatin, k: cytokeratin network encircling the nucleus and the autophagic vacuoles, m: mitochondrion of a young cell, m*: mitochondria of senescent cells aggregated close to the nucleus and appearing very contracted, av: autophagic vacuoles with a simple (F,G) or a double membrane (E) full of membranous or non-membranous debris.
Senescent Keratinocytes Die as a Result of High Autophagic Degradation of the Nucleus and Mitochondria
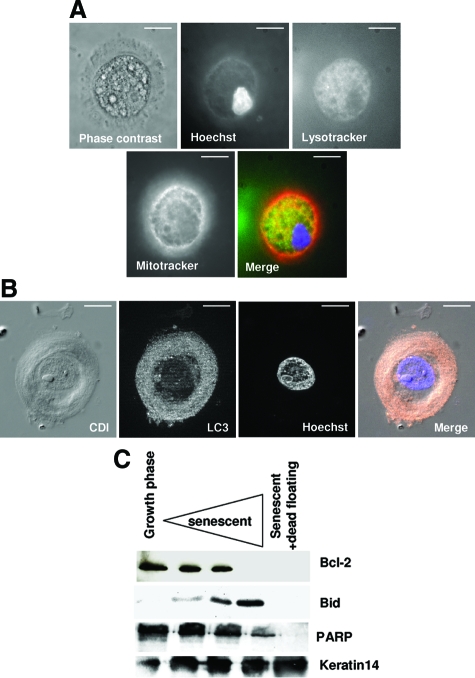
To determine whether this high autophagic activity in senescent keratinocytes might result in their death, we took a closer look at the corpses themselves. We performed triple staining experiments with lysosomal and autophagosomal markers (Lysotracker or antibodies against Atg8/LC3, a protein that associates with the membrane phagosome37), Hoechst to stain the nucleus, and Mitotracker to stain the mitochondria. The analysis was done by epifluorescence microscopy with a standard microscope or with a microscope equipped with the ApoTome system for optical sectioning. In corpses, the central area appeared Lysotracker-positive (Figure 12A) and full of numerous Atg8/LC3-positive punctate structures (Figure 12B). It always contained a nucleus, sometimes two or three, that could be pycnotic (Fig; 12A). It also contained almost all of the Mitotracker staining, which no longer delineated individual structures identifiable as mitochondria (Figure 12A). These Hoechst and Mitotracker staining patterns suggest that the mitochondria and nuclei were undergoing degradation.
Figure 12.
Corpses degrade their mitochondria and nuclei in a central area full of autophagic vacuoles. A: Triple staining of a corpse with Lysotracker (green), Hoechst (blue) and Mitotracker (red). The three stains colocalize within a central area that occupies most of the corpse volume. The nucleus appears pycnotic. Scale bars = 10 μm. B: Corpse immunostained with an antibody against LC3 (pink), co-stained with Hoechst (blue), and analyzed by circular dichroism and with the ApoTome system. The four images represent one optical section. The central area is full of LC3-positive punctate structures and contains a damaged nucleus. Scale bars = 10 μm. C: Western blots. Cell extracts were performed with NHEKs in the growth phase and at different time points in the senescence plateau. Last lane: extracts from still-adherent cells plus dead floating cells.
To further investigate this potential nuclear and mitochondrial degradation, we performed a Western blot analysis of several mitochondrial and nuclear proteins at different stages of the senescent growth plateau and, at the latest stage, in dead floating cells. The results show that the nuclear protein PARP was degraded in cells having reached the senescence plateau, its complete degradation being reached in floating cells. The mitochondrial proteins Bcl-2 and Bid were also completely undetectable in dead floating cells, the disappearance of Bcl-2 beginning earlier than that of Bid. These nuclear and mitochondrial protein degradations were specific, since the quantity of cytokeratin 14 increased continuously throughout the senescence plateau until the latest stage (Figure 12C). Thus, senescent keratinocytes seem to die through massive and specific autophagic degradation of their vital components, notably their nuclei and mitochondria.
Discussion
Although senescence is a cell state now extensively studied because of its implication in aging and associated pathologies such as cancer, the final fate of senescent cells, ie, how they die, has not been clearly established. Here, on the basis of an investigation of several molecular and morphological markers of apoptosis and autophagy, we propose that the main cell death mechanism occurring in senescent keratinocytes is not apoptosis but autophagic cell death. This conclusion would appear to apply to other cell types as well, since we observed increasing vacuole formation in several other senescent epithelial cell types (mammary and prostatic epithelial cells, data not shown) and in dermal fibroblasts (and prostatic fibroblasts, data not shown). Although in our hands the process of senescent fibroblast death seems very slow, a study by another group has confirmed that an increase in subcellular modifications corresponding to autophagy occurs during MRC5 human fibroblast senescence.38
Autophagy as a Cell Death Mechanism in Senescent Keratinocytes?
Autophagy plays a number of different, apparently contradictory, roles. It is the normal mechanism for the turnover of long-lived proteins and organelles. It is also a survival process induced to enable cells to resist nutrient deprivation, and it can evolve toward cell death when the cytosol and organelles are excessively degraded.39,40,41 The increased autophagic activity we have evidenced in senescent cells might thus play a role other than in cell death. What are the arguments in favor of a role of autophagy in the death of senescent keratinocytes?
First of all, we show that when the initial phases of autophagy are blocked with 3-methyladenine, the death of senescent cells is delayed. Moreover, if the acidification required for the final degradation of cell components is blocked, autophagic vacuoles full of debris accumulate inside corpses.
Secondly, we show by fluorescence and electron microscopy that dying senescent cells acquire a particular intracellular organization. The cytokeratin network develops and partitions the cell into two main areas, a cortical one devoid of organelles and a central one in which are concentrated a huge quantity of autophagic vacuoles, most of the mitochondria, and the nucleus. We assume that nuclei and mitochondria could be degraded therein. This is supported by the altered morphology of the nuclei and mitochondria in this area, by the level and type of DNA degradation, and by our Western blot analysis showing that numerous mitochondrial and nuclear proteins are lacking in the subpopulation comprising adherent senescent cells and floating dead cells. Autophagic elimination of nuclei has been poorly studied, as regards both its mechanism and its inducers, except in yeast where nuclei appear to be degraded by so-called piecemeal microautophagy.42 The nuclei of senescent cells could be targeted for autophagy because their DNA is broken, since inhibition of DNA-PK, a nuclear kinase involved in DNA-break signaling, sensitizes to autophagy,43 suggesting that persistence of damaged DNA can activate the autophagic process. Similarly, both an increase in Beclin-1 expression and an increase in autophagic programmed cell death occur following treatment with the DNA-damaging agent etoposide.44 Furthermore, DNA damage has been shown to accumulate in cancer cells deficient in autophagy.45
The elimination of a large quantity of mitochondria may also be crucial to rendering autophagy lethal. The mitochondria of senescent cells are damaged. This may activate their massive autophagic elimination, as shown in the case of nerve growth factor-deprived neurons.46 Surprising is the increased number of mitochondria during senescence despite the damage these organelles undergo. Such an increase has already been documented in MRC5 fibroblasts following H2O2-induced premature senescence.47 Also surprising is the lack of cytochrome C and AIF release from the damaged mitochondria. Actually, cytochrome C and AIF are probably released but, as suggested by Lemasters et al,48 sequestration of the mitochondria in autophagic vacuoles would prevent them from diffusing toward the cytosol and nucleus, and hence from exerting their activity as apoptosis-inducing factors.
The last argument concerns Beclin-1 expression. This might be a key determinant of the switch from autophagy as a vital process of cell component turnover to autophagy as a lethal process. Unlike autophagy induced by serum or amino acid deprivation that involves beclin-1 but without any increase in expression, autophagic programmed cell death induced by etoposide appears to be associated with an increase in Beclin-1 expression.44 We show here that Beclin-1 expression is induced at the presenescence stage, supporting the notion that autophagic cell death could follow.
A contrario, it has been suggested that senescent cells die because of a decreased ability to digest and evacuate the content of autophagic vacuoles.49 Our videomicroscopic recordings and flow cytometric analyses show that senescent cells retract during their death process. If they died because of an inability to evacuate damaged components, they should instead continue to increase in size. Our videomicroscopic recordings also show that dying senescent cells do evacuate some dense material, probably corresponding to the non-degradable content of their autophagolysosomes. This suggests that the autophagic process is functional in senescent cells until late. Moreover, our electron micrographs show that the autophagic vacuoles accumulating in senescent cells are functional, since most of them contain only small pieces of degraded material. In contrast, when the degradation process is blocked with bafilomycin, these vesicles retain more material.
Senescent Cells Do Not Die by Apoptosis
We additionally show here that senescent cells do not die by apoptosis. This is supported by the morphology of the corpses appearing during senescence, which differ markedly from apoptotic bodies. This is also supported by the lack of several apoptotic markers in senescent cells or corpses observable at the senescence plateau. Furthermore, caspase inhibitors have no effect on the kinetics of senescent-cell death. Our conclusion is entirely consistent with the apoptosis-resistance of senescent cells, an unpopular fact that is nevertheless clearly established for several cell types and several apoptosis inducers.50,51,52,53 Other groups have examined whether senescent cells die by apoptosis, and conflicting results have been published. In one study, senescent fibroblasts appeared caspase-3 positive, with only 2% of them showing other typical apoptotic changes.54 In another study comparing human umbilical vein endothelial cells (HUVECs) with fibroblasts, senescent HUVECs displayed many signs of apoptosis but senescent fibroblasts did not.55 The authors associated the death of HUVECs with the generation of oxidative stress during senescence56 and proposed that fibroblasts do not die by apoptosis because they are more resistant to oxidative stress than HUVECs.57 A study focusing on keratinocytes concluded, in accordance with our results, that apoptotic cells are a minority subpopulation and that their number does not change with passaging.58
Implications for Aging and Tumorigenesis
An interesting question is whether autophagy is involved in the death of senescent cells in vivo during aging, as it is in culture. The sole established universal marker of senescence, SA-β-Gal activity,59 increases in the course of normal human and mouse aging.59,60,61,62 Since a lysosomal hydrolase has been shown to exert this activity,63 this indicates that the autophagic activity of the cells increases during aging. Similarly, lipofuscin, the well-known marker of aged skin, has been shown to accumulate with advancing age inside autophagic vacuoles, as an aggregate of proteins having reacted with lipid peroxidation end-products.64 This also supports the notion that autophagic activity increases with age. Therefore, one might speculate that during aging, most altered cells might die by autophagy.
Understanding the death pathway of senescent cells may be a key to understanding the relationship between aging and cancer. It is widely recognized that the appearance of apoptosis resistance is an important event in neoplastic transformation. The same might apply to resistance to autophagic cell death. There is evidence already that autophagy is down-regulated in cancer cells. Beclin-1 is often mono-allelically deleted in various carcinomas38 and its heterozygous disruption in mice causes spontaneous tumors.65,66 The tumor suppressor phosphatase and tensin homolog, which rivals p53 as the most frequently mutated gene in human cancer,67 promotes autophagy in HT-29 colon cancer cells by blocking the Akt survival pathway, and mutations in phosphatase and tensin homolog result in inactivation of autophagy and tumor formation.68 One might thus speculate that during aging, some cells escape autophagic cell death to evolve into long-lived transformed cells. Once formed, however, cancer cells might use autophagy in the opposite way, for example to survive under nutrient deprivation resulting from limited angiogenesis.69
Supplementary Material
Acknowledgments
We thank Fabrice Nesslany for technical advice on comet assays, Nathalie Jouy at the Service commun de Cytometrie et de Tri cellulaire (IMPRT-IFR114), and Julie Bertout at IBL for FACS facility, Didier Deslee for Videomicroscopy Facility at the Institut Pasteur de Lille Campus, and Albin Pourtier for critical discussions and reading of the manuscript.
Footnotes
Address reprint requests to Abbadie Corinne UMR8161, Institut de Biologie de Lille, 1 rue du Pr. Calmette, BP 447, 59021 Lille Cedex, France. E-mail: corinne.abbadie@ibl.fr.
Supported by the Centre National de la Recherche Scientifique, the Université Lille 1, the Association pour la Recherche sur le Cancer, the Ligue contre le Cancer (Comités du Nord et de l’Aisne), the Institut Pasteur de Lille, the Conseil Régional Nord/Pas-de-Calais, and the European Regional Development Fund. KG had a fellowship from the Institut Pasteur de Lille, the Région Nord/Pas-de-Calais and from the Société Française du Cancer. SM has a fellowship from the French Research Ministry and the Fondation pour la Recherche Médicale. ED has a fellowship from the Institut Pasteur de Lille and the Région Nord/Pas-de-Calais.
Supplemental material for this article can be found on http://ajp. amjpathol.org
References
- Campisi J. Cellular senescence as a tumor-suppressor mechanism. Trends Cell Biol. 2001;11:S27–S31. doi: 10.1016/s0962-8924(01)02151-1. [DOI] [PubMed] [Google Scholar]
- Cristofalo VJ, Lorenzini A, Allen RG, Torres C, Tresini M. Replicative senescence: a critical review. Mech Ageing Dev. 2004;125:827–848. doi: 10.1016/j.mad.2004.07.010. [DOI] [PubMed] [Google Scholar]
- Zwerschke W, Mazurek S, Stockl P, Hutter E, Eigenbrodt E, Jansen-Durr P. Metabolic analysis of senescent human fibroblasts reveals a role for AMP in cellular senescence. Biochem J. 2003;376:403–411. doi: 10.1042/BJ20030816. [DOI] [PMC free article] [PubMed] [Google Scholar]
- Yoon IK, Kim HK, Kim YK, Song IH, Kim W, Kim S, Baek SH, Kim JH, Kim JR. Exploration of replicative senescence-associated genes in human dermal fibroblasts by cDNA microarray technology. Exp Gerontol. 2004;39:1369–1378. doi: 10.1016/j.exger.2004.07.002. [DOI] [PubMed] [Google Scholar]
- Kang MK, Kameta A, Shin KH, Baluda MA, Kim HR, Park NH. Senescence-associated genes in normal human oral keratinocytes. Exp Cell Res. 2003;287:272–281. doi: 10.1016/s0014-4827(03)00061-2. [DOI] [PubMed] [Google Scholar]
- Linskens MH, Feng J, Andrews WH, Enlow BE, Saati SM, Tonkin LA, Funk WD, Villeponteau B. Cataloging altered gene expression in young and senescent cells using enhanced differential display. Nucleic Acids Res. 1995;23:3244–3251. doi: 10.1093/nar/23.16.3244. [DOI] [PMC free article] [PubMed] [Google Scholar]
- Schwarze SR, DePrimo SE, Grabert LM, Fu VX, Brooks JD, Jarrard DF. Novel pathways associated with bypassing cellular senescence in human prostate epithelial cells. J Biol Chem. 2002;277:14877–14883. doi: 10.1074/jbc.M200373200. [DOI] [PubMed] [Google Scholar]
- Shelton DN, Chang E, Whittier PS, Choi D, Funk WD. Microarray analysis of replicative senescence. Current Biology. 1999;9:939–945. doi: 10.1016/s0960-9822(99)80420-5. [DOI] [PubMed] [Google Scholar]
- Untergasser G, Koch HB, Menssen A, Hermeking H. Characterization of epithelial senescence by serial analysis of gene expression: identification of genes potentially involved in prostate cancer. Cancer Res. 2002;62:6255–6262. [PubMed] [Google Scholar]
- Benvenuti S, Cramer R, Quinn CC, Bruce J, Zvelebil M, Corless S, Bond J, Yang A, Hockfield S, Burlingame AL, Waterfield MD, Jat PS. Differential proteome analysis of replicative senescence in rat embryo fibroblasts. Mol Cell Proteomics. 2002;1:280–292. doi: 10.1074/mcp.m100028-mcp200. [DOI] [PubMed] [Google Scholar]
- Dierick JF, Kalume DE, Wenders F, Salmon M, Dieu M, Raes M, Roepstorff P, Toussaint O. Identification of 30 protein species involved in replicative senescence and stress-induced premature senescence. FEBS Lett. 2002;531:499–504. doi: 10.1016/s0014-5793(02)03604-9. [DOI] [PubMed] [Google Scholar]
- Degterev A, Boyce M, Yuan J. A decade of caspases. Oncogene. 2003;22:8543–8567. doi: 10.1038/sj.onc.1207107. [DOI] [PubMed] [Google Scholar]
- Gozuacik D, Kimchi A. Autophagy and cell death. Curr Top Dev Biol. 2007;78:217–245. doi: 10.1016/S0070-2153(06)78006-1. [DOI] [PubMed] [Google Scholar]
- Lockshin RA, Zakeri Z. Apoptosis, autophagy, and more. Int J Biochem Cell Biol. 2004;36:2405–2419. doi: 10.1016/j.biocel.2004.04.011. [DOI] [PubMed] [Google Scholar]
- Dunn WA., Jr Studies on the mechanisms of autophagy: formation of the autophagic vacuole. J Cell Biol. 1990;110:1923–1933. doi: 10.1083/jcb.110.6.1923. [DOI] [PMC free article] [PubMed] [Google Scholar]
- Mizushima N, Yamamoto A, Hatano M, Kobayashi Y, Kabeya Y, Suzuki K, Tokuhisa T, Ohsumi Y, Yoshimori T. Dissection of autophagosome formation using Apg5-deficient mouse embryonic stem cells. J Cell Biol. 2001;152:657–668. doi: 10.1083/jcb.152.4.657. [DOI] [PMC free article] [PubMed] [Google Scholar]
- Mizushima N. Autophagy: process and function. Genes Dev. 2007;21:2861–2873. doi: 10.1101/gad.1599207. [DOI] [PubMed] [Google Scholar]
- Xie Z, Klionsky DJ. Autophagosome formation: core machinery and adaptations. Nat Cell Biol. 2007;9:1102–1109. doi: 10.1038/ncb1007-1102. [DOI] [PubMed] [Google Scholar]
- Bursch W, Hochegger K, Torok L, Marian B, Ellinger A, Schulte-Hermann R. Autophagic and apoptotic types of programmed cell death exhibit different fates of cytoskeletal filaments. J Cell Sci. 2000;113:1189–1198. doi: 10.1242/jcs.113.7.1189. [DOI] [PubMed] [Google Scholar]
- Broker LE, Kruyt FA, Giaccone G. Cell death independent of caspases: a review. Clin Cancer Res. 2005;11:3155–3162. doi: 10.1158/1078-0432.CCR-04-2223. [DOI] [PubMed] [Google Scholar]
- Yu L, Alva A, Su H, Dutt P, Freundt E, Welsh S, Baehrecke EH, Lenardo MJ. Regulation of an ATG7-beclin 1 program of autophagic cell death by caspase-8. Science. 2004;304:1500–1502. doi: 10.1126/science.1096645. [DOI] [PubMed] [Google Scholar]
- Edinger AL, Thompson CB. Death by design: apoptosis, necrosis, and autophagy. Curr Opin Cell Biol. 2004;16:663–669. doi: 10.1016/j.ceb.2004.09.011. [DOI] [PubMed] [Google Scholar]
- Golstein P, Kroemer G. Cell death by necrosis: towards a molecular definition. Trends Biochem Sci. 2007;32:37–43. doi: 10.1016/j.tibs.2006.11.001. [DOI] [PubMed] [Google Scholar]
- Boyce ST, Ham RG. Calcium-regulated differentiation of normal human epidermal keratinocytes in chemically defined clonal culture and serum-free serial culture. J Invest Dermatol. 1983;81:33s–40s. doi: 10.1111/1523-1747.ep12540422. [DOI] [PubMed] [Google Scholar]
- Reynolds ES. The use of lead citrate at high pH as an electron-opaque stain in electron microscopy. J Cell Biol. 1963;17:208–212. doi: 10.1083/jcb.17.1.208. [DOI] [PMC free article] [PubMed] [Google Scholar]
- Kagan VE, Fabisiak JP, Shvedova AA, Tyurina YY, Tyurin VA, Schor NF, Kawai K. Oxidative signaling pathway for externalization of plasma membrane phosphatidylserine during apoptosis. FEBS Lett. 2000;477:1–7. doi: 10.1016/s0014-5793(00)01707-5. [DOI] [PubMed] [Google Scholar]
- Petrovski G, Zahuczky G, Katona K, Vereb G, Martinet W, Nemes Z, Bursch W, Fesus L. Clearance of dying autophagic cells of different origin by professional and non-professional phagocytes. Cell Death Differ. 2007;14:1117–1128. doi: 10.1038/sj.cdd.4402112. [DOI] [PubMed] [Google Scholar]
- Seglen PO, Gordon PB. 3-Methyladenine: specific inhibitor of autophagic/lysosomal protein degradation in isolated rat hepatocytes. Proc Natl Acad Sci USA. 1982;79:1889–1892. doi: 10.1073/pnas.79.6.1889. [DOI] [PMC free article] [PubMed] [Google Scholar]
- Robertson JD, Orrenius S, Zhivotovsky B. Review: nuclear events in apoptosis. J Struct Biol. 2000;129:346–358. doi: 10.1006/jsbi.2000.4254. [DOI] [PubMed] [Google Scholar]
- Rojas E, Lopez MC, Valverde M. Single cell gel electrophoresis assay: methodology and applications. J Chromatogr B Biomed Sci Appl. 1999;722:225–254. doi: 10.1016/s0378-4347(98)00313-2. [DOI] [PubMed] [Google Scholar]
- Fadeel B, Orrenius S. Apoptosis: a basic biological phenomenon with wide-ranging implications in human disease. J Intern Med. 2005;258:479–517. doi: 10.1111/j.1365-2796.2005.01570.x. [DOI] [PubMed] [Google Scholar]
- Pattingre S, Tassa A, Qu X, Garuti R, Liang XH, Mizushima N, Packer M, Schneider MD, Levine B. Bcl-2 antiapoptotic proteins inhibit Beclin 1-dependent autophagy. Cell. 2005;122:927–939. doi: 10.1016/j.cell.2005.07.002. [DOI] [PubMed] [Google Scholar]
- Biederbick A, Kern HF, Elsasser HP. Monodansylcadaverine (MDC) is a specific in vivo marker for autophagic vacuoles. Eur J Cell Biol. 1995;66:3–14. [PubMed] [Google Scholar]
- Mizushima N. Methods for monitoring autophagy. Int J Biochem Cell Biol. 2004;36:2491–2502. doi: 10.1016/j.biocel.2004.02.005. [DOI] [PubMed] [Google Scholar]
- Allen DG, Riviere JE, Monteiro-Riviere NA. Analysis of interleukin-8 release from normal human epidermal keratinocytes exposed to aliphatic hydrocarbons: delivery of hydrocarbons to cell cultures via complexation with alpha-cyclodextrin. Toxicol In Vitro. 2001;15:663–669. doi: 10.1016/s0887-2333(01)00075-3. [DOI] [PubMed] [Google Scholar]
- Yeung T, Gilbert GE, Shi J, Silvius J, Kapus A, Grinstein S. Membrane phosphatidylserine regulates surface charge and protein localization. Science. 2008;319:210–213. doi: 10.1126/science.1152066. [DOI] [PubMed] [Google Scholar]
- Kabeya Y, Mizushima N, Ueno T, Yamamoto A, Kirisako T, Noda T, Kominami E, Ohsumi Y, Yoshimori T. LC3, a mammalian homologue of yeast Apg8p, is localized in autophagosome membranes after processing. EMBO J. 2000;19:5720–5728. doi: 10.1093/emboj/19.21.5720. [DOI] [PMC free article] [PubMed] [Google Scholar]
- Gerland LM, Peyrol S, Lallemand C, Branche R, Magaud JP, French M. Association of increased autophagic inclusions labeled for beta-galactosidase with fibroblastic aging. Exp Gerontol. 2003;38:887–895. doi: 10.1016/s0531-5565(03)00132-3. [DOI] [PubMed] [Google Scholar]
- Clarke PGH. Developmental cell death: morphological diversity and multiple mechanisms. Anat Embryol. 1990;181:195–213. doi: 10.1007/BF00174615. [DOI] [PubMed] [Google Scholar]
- Gozuacik D, Kimchi A. Autophagy as a cell death and tumor suppressor mechanism. Oncogene. 2004;23:2891–2906. doi: 10.1038/sj.onc.1207521. [DOI] [PubMed] [Google Scholar]
- Mizushima N, Levine B, Cuervo AM, Klionsky DJ. Autophagy fights disease through cellular self-digestion. Nature. 2008;451:1069–1075. doi: 10.1038/nature06639. [DOI] [PMC free article] [PubMed] [Google Scholar]
- Roberts P, Moshitch-Moshkovitz S, Kvam E, O'Toole E, Winey M, Goldfarb DS. Piecemeal microautophagy of nucleus in Saccharomyces cerevisiae. Mol Biol Cell. 2003;14:129–141. doi: 10.1091/mbc.E02-08-0483. [DOI] [PMC free article] [PubMed] [Google Scholar]
- Daido S, Yamamoto A, Fujiwara K, Sawaya R, Kondo S, Kondo Y. Inhibition of the DNA-dependent protein kinase catalytic subunit radiosensitizes malignant glioma cells by inducing autophagy. Cancer Res. 2005;65:4368–4375. doi: 10.1158/0008-5472.CAN-04-4202. [DOI] [PubMed] [Google Scholar]
- Shimizu S, Kanaseki T, Mizushima N, Mizuta T, Arakawa-Kobayashi S, Thompson CB, Tsujimoto Y. Role of Bcl-2 family proteins in a non-apoptotic programmed cell death dependent on autophagy genes. Nat Cell Biol. 2004;6:1221–1228. doi: 10.1038/ncb1192. [DOI] [PubMed] [Google Scholar]
- Karantza-Wadsworth V, Patel S, Kravchuk O, Chen G, Mathew R, Jin S, White E. Autophagy mitigates metabolic stress and genome damage in mammary tumorigenesis. Genes Dev. 2007;21:1621–1635. doi: 10.1101/gad.1565707. [DOI] [PMC free article] [PubMed] [Google Scholar]
- Kirkland RA, Adibhatla RM, Hatcher JF, Franklin JL. Loss of cardiolipin and mitochondria during programmed neuronal death: evidence of a role for lipid peroxidation and autophagy. Neuroscience. 2002;115:587–602. doi: 10.1016/s0306-4522(02)00512-2. [DOI] [PubMed] [Google Scholar]
- Lee HC, Yin PH, Lu CY, Chi CW, Wei YH. Increase of mitochondria and mitochondrial DNA in response to oxidative stress in human cells. Biochem J. 2000;348 Pt 2:425–432. [PMC free article] [PubMed] [Google Scholar]
- Lemasters JJ, Nieminen AL, Qian T, Trost LC, Elmore SP, Nishimura Y, Crowe RA, Cascio WE, Bradham CA, Brenner DA, Herman B. The mitochondrial permeability transition in cell death: a common mechanism in necrosis, apoptosis and autophagy. Biochim Biophys Acta. 1998;1366:177–196. doi: 10.1016/s0005-2728(98)00112-1. [DOI] [PubMed] [Google Scholar]
- Brunk UT, Terman A. The mitochondrial-lysosomal axis theory of aging: accumulation of damaged mitochondria as a result of imperfect autophagocytosis. Eur J Biochem. 2002;269:1996–2002. doi: 10.1046/j.1432-1033.2002.02869.x. [DOI] [PubMed] [Google Scholar]
- Wang E. Senescent human fibroblasts resist programmed cell death, and failure to suppress bcl2 is involved. Cancer Res. 1995;55:2284–2292. [PubMed] [Google Scholar]
- Seluanov A, Gorbunova V, Falcovitz A, Sigal A, Milyavsky M, Zurer I, Shohat G, Goldfinger N, Rotter V. Change of the death pathway in senescent human fibroblasts in response to DNA damage is caused by an inability to stabilize p53. Mol Cell Biol. 2001;21:1552–1564. doi: 10.1128/MCB.21.5.1552-1564.2001. [DOI] [PMC free article] [PubMed] [Google Scholar]
- Spaulding C, Guo W, Effros RB. Resistance to apoptosis in human CD8+ T cells that reach replicative senescence after multiple rounds of antigen-specific proliferation. Exp Gerontol. 1999;34:633–644. doi: 10.1016/s0531-5565(99)00033-9. [DOI] [PubMed] [Google Scholar]
- Chaturvedi V, Qin J-Z, Denning MF, Choubey D, Diaz MO, Nickoloff BJ. Apoptosis in proliferating, senescent, and immortalized keratinocytes. J Biol Chem. 1999;274:23358–23367. doi: 10.1074/jbc.274.33.23358. [DOI] [PubMed] [Google Scholar]
- Ohshima S. Apoptosis in stress-induced and spontaneously senescent human fibroblasts. Biochem Biophys Res Commun. 2004;324:241–246. doi: 10.1016/j.bbrc.2004.09.044. [DOI] [PubMed] [Google Scholar]
- Wagner M, Hampel B, Bernhard D, Hala M, Zwerschke W, Jansen-Durr P. Replicative senescence of human endothelial cells in vitro involves G1 arrest, polyploidization and senescence-associated apoptosis. Exp Gerontol. 2001;36:1327–1347. doi: 10.1016/s0531-5565(01)00105-x. [DOI] [PubMed] [Google Scholar]
- Unterluggauer H, Hampel B, Zwerschke W, Jansen-Durr P. Senescence-associated cell death of human endothelial cells: the role of oxidative stress. Exp Gerontol. 2003;38:1149–1160. doi: 10.1016/j.exger.2003.08.007. [DOI] [PubMed] [Google Scholar]
- Hampel B, Malisan F, Niederegger H, Testi R, Jansen-Durr P. Differential regulation of apoptotic cell death in senescent human cells. Exp Gerontol. 2004;39:1713–1721. doi: 10.1016/j.exger.2004.05.010. [DOI] [PubMed] [Google Scholar]
- Norsgaard H, Clark BF, Rattan SI. Distinction between differentiation and senescence and the absence of increased apoptosis in human keratinocytes undergoing cellular aging in vitro. Exp Gerontol. 1996;31:563–570. doi: 10.1016/0531-5565(96)00011-3. [DOI] [PubMed] [Google Scholar]
- Dimri GP, Lee X, Basile G, Acosta M, Scott G, Roskelley C, Medrano EE, Linskens M, Rubelj I, Pereira-Smith O, Peacocke M, Campisi J. A biomarker that identifies senescent human cells in culture and in aging skin in vivo. Proc Natl Acad Sci USA. 1995;92:9363–9367. doi: 10.1073/pnas.92.20.9363. [DOI] [PMC free article] [PubMed] [Google Scholar]
- Ding G, Franki N, Kapasi AA, Reddy K, Gibbons N, Singhal PC. Tubular cell senescence and expression of TGF-beta1 and p21(WAF1/CIP1) in tubulointerstitial fibrosis of aging rats. Exp Mol Pathol. 2001;70:43–53. doi: 10.1006/exmp.2000.2346. [DOI] [PubMed] [Google Scholar]
- Martin JA, Buckwalter JA. The role of chondrocyte senescence in the pathogenesis of osteoarthritis and in limiting cartilage repair. J Bone Joint Surg Am. 2003;85-A Suppl 2:106–110. doi: 10.2106/00004623-200300002-00014. [DOI] [PubMed] [Google Scholar]
- Keyes WM, Wu Y, Vogel H, Guo X, Lowe SW, Mills AA. p63 deficiency activates a program of cellular senescence and leads to accelerated aging. Genes Dev. 2005;19:1986–1999. doi: 10.1101/gad.342305. [DOI] [PMC free article] [PubMed] [Google Scholar]
- Lee BY, Han JA, Im JS, Morrone A, Johung K, Goodwin EC, Kleijer WJ, DiMaio D, Hwang ES. Senescence-associated beta-galactosidase is lysosomal beta-galactosidase. Aging Cell. 2006;5:187–195. doi: 10.1111/j.1474-9726.2006.00199.x. [DOI] [PubMed] [Google Scholar]
- Yin D. Biochemical basis of lipofuscin, ceroid, and age pigment-like fluorophores. Free Radic Biol Med. 1996;21:871–888. doi: 10.1016/0891-5849(96)00175-x. [DOI] [PubMed] [Google Scholar]
- Yue Z, Jin S, Yang C, Levine AJ, Heintz N. Beclin 1, an autophagy gene essential for early embryonic development, is a haploinsufficient tumor suppressor. Proc Natl Acad Sci USA. 2003;100:15077–15082. doi: 10.1073/pnas.2436255100. [DOI] [PMC free article] [PubMed] [Google Scholar]
- Qu X, Yu J, Bhagat G, Furuya N, Hibshoosh H, Troxel A, Rosen J, Eskelinen EL, Mizushima N, Ohsumi Y, Cattoretti G, Levine B. Promotion of tumorigenesis by heterozygous disruption of the beclin 1 autophagy gene. J Clin Invest. 2003;112:1809–1820. doi: 10.1172/JCI20039. [DOI] [PMC free article] [PubMed] [Google Scholar]
- Sansal I, Sellers WR. The biology and clinical relevance of the PTEN tumor suppressor pathway. J Clin Oncol. 2004;22:2954–2963. doi: 10.1200/JCO.2004.02.141. [DOI] [PubMed] [Google Scholar]
- Arico S, Petiot A, Bauvy C, Dubbelhuis PF, Meijer AJ, Codogno P, Ogier-Denis E. The tumor suppressor PTEN positively regulates macroautophagy by inhibiting the phosphatidylinositol 3-kinase/protein kinase B pathway. J Biol Chem. 2001;276:35243–35246. doi: 10.1074/jbc.C100319200. [DOI] [PubMed] [Google Scholar]
- Hippert MM, O'Toole PS, Thorburn A. Autophagy in cancer: good, bad, or both?. Cancer Res. 2006;66:9349–9351. doi: 10.1158/0008-5472.CAN-06-1597. [DOI] [PubMed] [Google Scholar]
Associated Data
This section collects any data citations, data availability statements, or supplementary materials included in this article.


