Abstract
Lumazine synthase catalyzes the reaction of 5-amino-6-D-ribitylamino-2,4(1H,3H)-pyrimidinedione (1) with (S)-3,4-dihydroxybutanone 4-phosphate (2) to afford 6,7-dimethyl-8-D-ribityllumazine (3), the immediate biosynthetic precursor of riboflavin. The overall reaction implies a series of intermediates that are incompletely understood. The 15N{31P} REDOR NMR spectra of three metabolically stable phosphonate reaction intermediate analogues complexed to Saccharomyces cerevisiae lumazine synthase have been obtained at 7 and 12 T. Distances from the phosphorus atoms of the ligands to the side chain nitrogens of Lys92, His97, Arg136, and His148 have been determined. These distances were used in combination with the X-ray crystal coordinates of one of the intermediate analogues complexed with the enzyme in a series of distance-restrained molecular dynamics simulations. The resulting models indicate mobility of the Lys92 side chain, which could facilitate the exchange of inorganic phosphate eliminated from the substrate in one reaction, with the organic phosphate-containing substrate necessary for the next reaction.
Flavocoenzymes derived from riboflavin (vitamin B2) play a vital role in biological electron transport processes (1, 2). Whereas plants and many microorganisms biosynthesize the vitamin, humans and other animals depend on nutritional sources (3-11). Consequently, the inhibition of any of the enzymes involved in the riboflavin biosynthesis pathway could result in selective toxicity to the pathogen and not the host. Notably, expression of the Salmonella riboflavin biosynthesis gene ribB has been shown to be essential for enteritis induction and systemic typhoid fever in animal disease models (12, 13). Since the ever-increasing antibiotic resistance by pathogenic microorganisms is a deadly problem, new antibiotics are urgently needed, and the enzymes involved in riboflavin biosynthesis are attractive targets.
Lumazine synthase and riboflavin synthase are the last two enzymes in the riboflavin biosynthesis pathway. Lumazine synthase catalyzes the condensation of 5-amino-6-D-ribitylamino-2,4(1H,3H)-pyrimidinedione (1) with (S)-3,4-dihydroxybutanone 4-phosphate (2) to afford 6,7-dimethyl-8-D-ribityllumazine (3) (14, 15). Riboflavin synthase catalyzes a mechanistically unusual dismutation of two molecules of 3 to form one molecule of riboflavin (4) and one molecule of the lumazine synthase substrate 1 (Scheme 1) (16-20).
SCHEME 1.
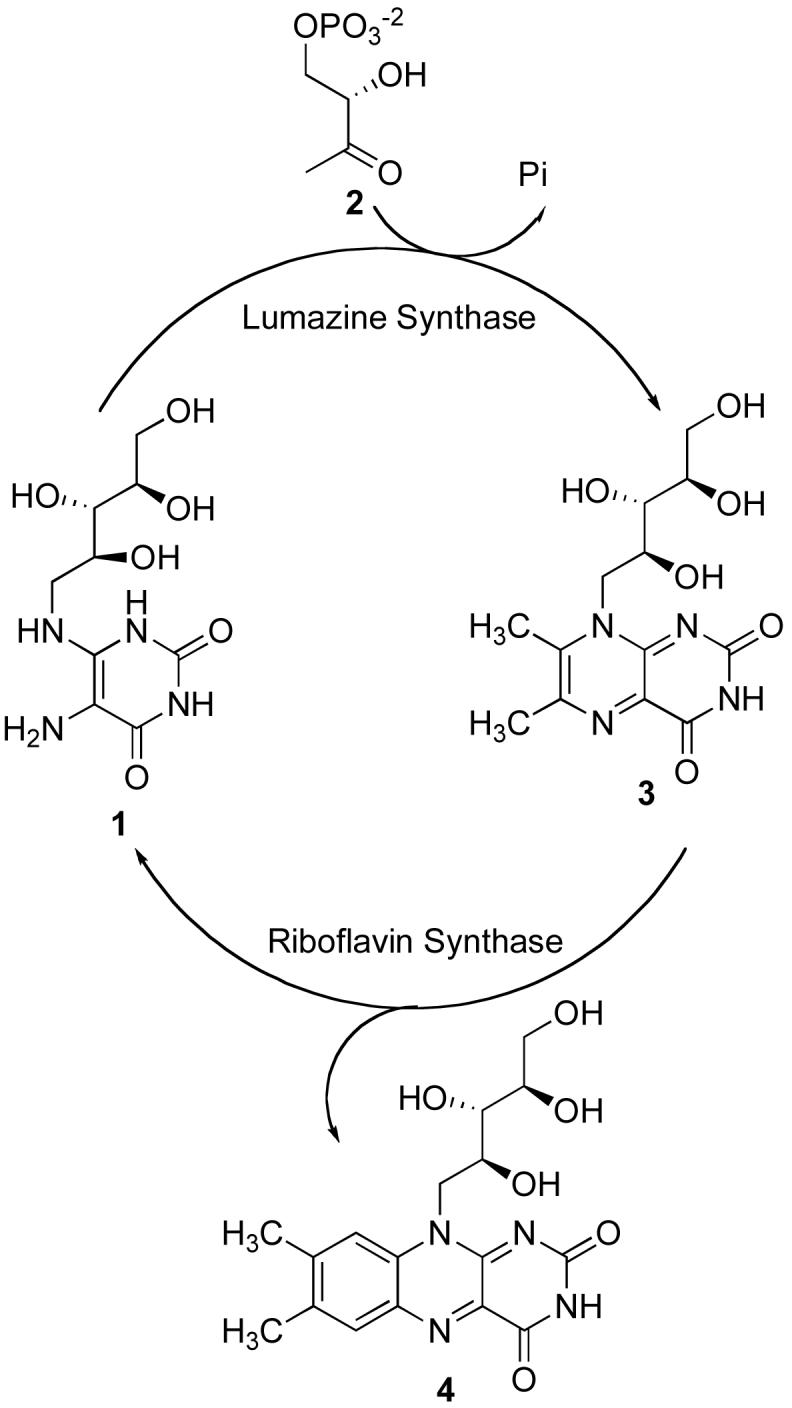
The Last Two Steps in the Riboflavin Biosynthesis Pathway
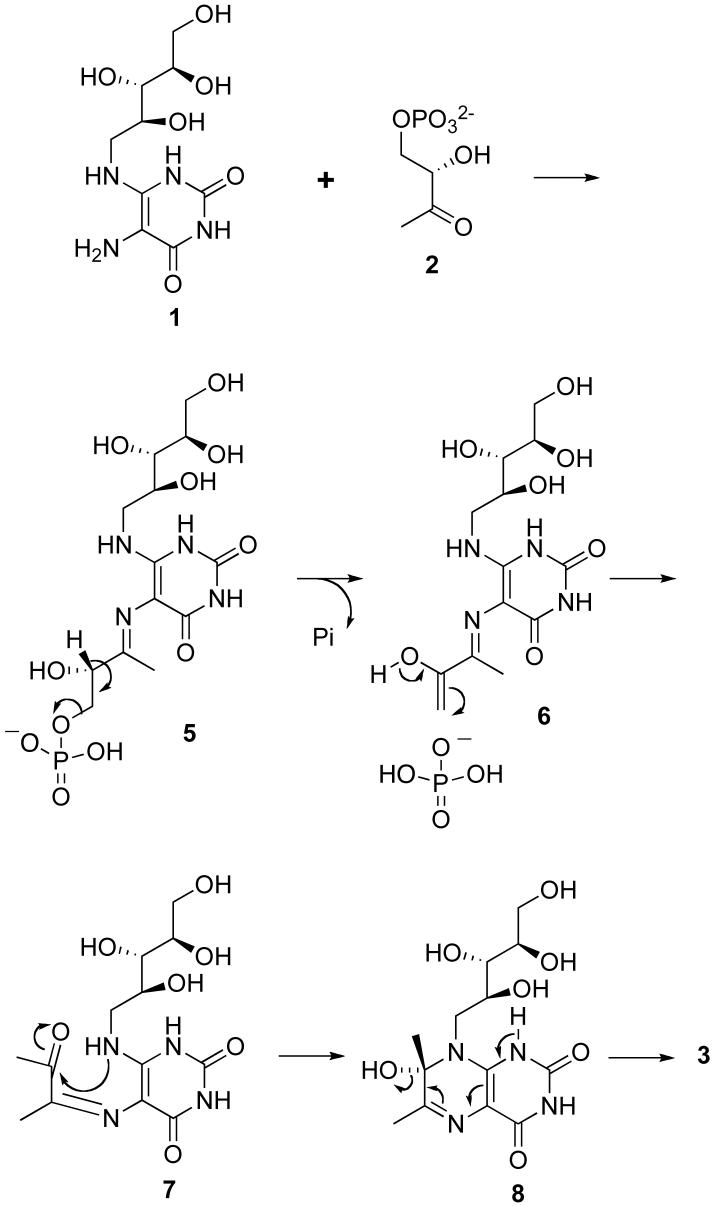
The mechanism of the lumazine synthase-catalyzed reaction has not been completely established. The hypothetical pathway outlined in Scheme 2 involves condensation of the primary amino group of the substituted pyrimidinedione 1 with the ketone 2 to afford Schiff base 5, elimination of phosphate to yield the enol 6, tautomerization of the enol 6 and trans to cis isomerization of the imine to produce the ketone 7, ring closure, and dehydration of the covalent hydrate 8 to provide the product 3 (21). Presumably the inorganic phosphate formed after elimination from 5 would remain enzyme bound, at least for some time, but it would eventually have to dissociate to make room for another molecule of the substrate 2. Prior crystallographic studies have shown that the initial intermediate is bound with the phosphate side chain in an extended conformation with the phosphate located approximately as depicted in structure 5 (22).
SCHEME 2.
Hypothetical Reaction Mechanism of the Lumazine Synthase-Catalyzed Reaction
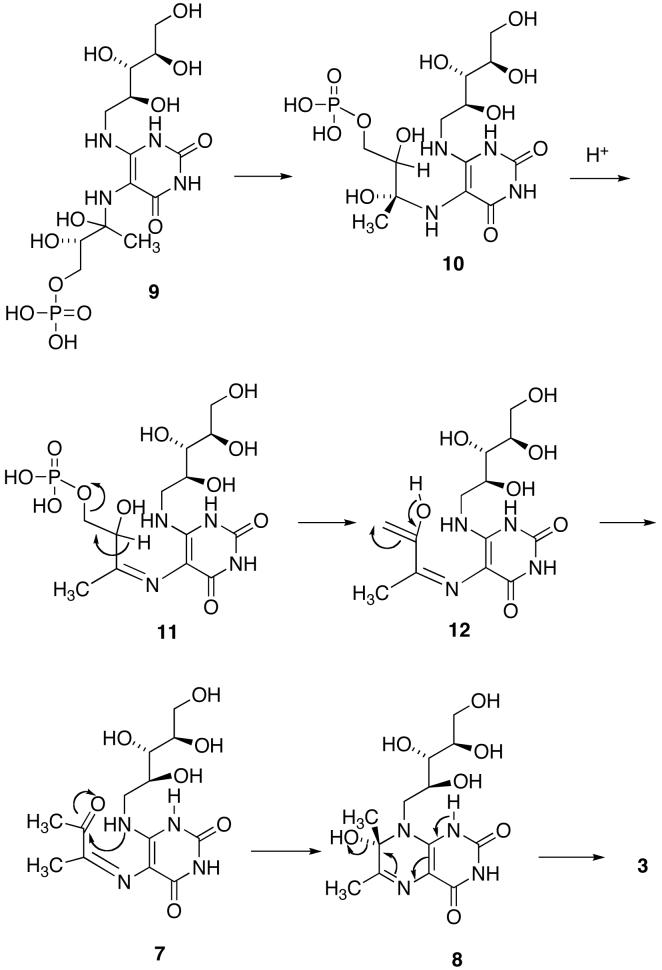
Although the mechanism outlined in Scheme 2 is certainly reasonable, the details of the pathway, such as the timing of phosphate elimination relative to the conformational reorganization of the side chain to allow cyclization, and the isomerization of the trans Schiff base to a cis Schiff base, or the possible initial formation of a cis Schiff base, remain unknown (21). For example, the conformational change of the side chain of 9 might occur with the phosphate still covalently bound to form intermediate 10, followed by dehydration to yield the Schiff base 11 and elimination of phosphate to generate the enol in 12 close to the ribitylamino group (Scheme 3) (23). With Saccharomyces cerevisiae lumazine synthase, proton transfer from the protonated imidazole of His97 to the hydroxyl group of the carbinolamine 8, followed by dehydration, would form the product 3 (23). This mechanism has a number of appealing features: 1) it explains the generation of the required cis imine, and 2) it helps to explain the expulsion of phosphate from the protein. On the other hand: 1) it is difficult to explain how the phosphate residue initially dissociates from the phosphate binding site, 2) the transport of the whole phosphate side chain seems unwieldy, and 3) mutation studies have failed to demonstrate a crucial role for histidine in the active site (24). Nevertheless, it is clear that the inorganic phosphate must be released at some point to make way for new substrate.
SCHEME 3.
Alternative Mechanism of the Lumazine Synthase-Catalyzed Reactiona
aDifferent compound numbers 9 and 10 have been used to designate different conformations of the same intermediate.
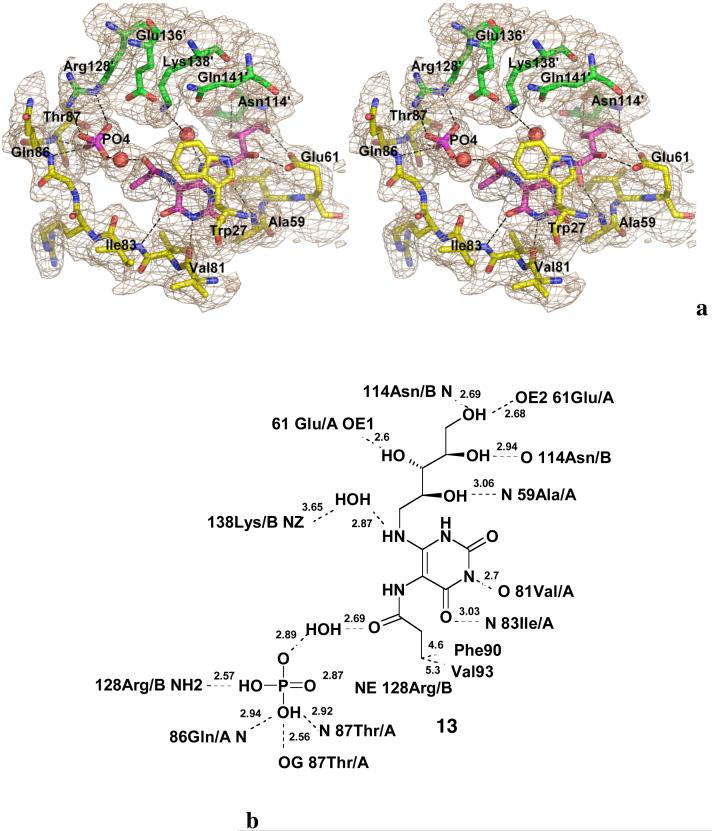
We recently sought evidence for the existence of intermediate 6 (Scheme 2) through the synthesis of metabolically stable analogues that could be crystallized with a complex of lumazine synthase and inorganic phosphate. That effort eventually resulted in the preparation of the intermediate analogue 13 and the crystal structure displayed in Figure 1, in which the ligand 13 is bound to Mycobacterium tuberculosis lumazine synthase in an extended conformation resembling that proposed for intermediate 6 in Scheme 2. The amide carbonyl of 13 was found to be hydrogen bonded to water, which in turn was hydrogen bonded to the enzyme-bound inorganic phosphate (25).
Figure 1.
Stereodiagram of the 2|Fo|-|Fc| electron density map (σ =1.5) around the active site of M. tuberculosis lumazine synthase in complex with inhibitor 13 and a phosphate ion (magenta) (PDB ID 2VI5) (a), and the respective schematic drawings of the interactions between the enzyme and the ligand (b). Red spheres indicate water molecules. The carbon atoms of the residues of different subunits are shown in green and in yellow, oxygen atoms are in red, and nitrogen atoms are in blue (25).
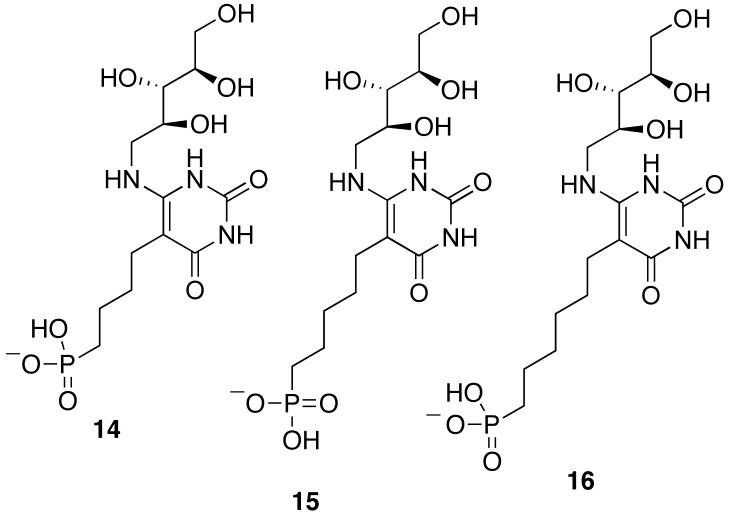
The three metabolically stable phosphonate analogues 14-16 of intermediate 5 were previously synthesized and the crystal structure of the complex formed between compound 15 and S. cerevisiae lumazine synthase (1EJB) determined at 1.85 Å resolution (22, 26). Our strategy to determine a more accurate structure of occupied binding sites of lumazine synthase was to improve the accuracy of the x-ray information using REDOR NMR (27-33). REDOR is a difference experiment in which two spectra are collected, one in the absence of heteronuclear dipolar coupling (full echo, S0 spectrum), and the other in the presence of the coupling (dephased echo, S spectrum). In the S0 spectrum, dipolar dephasing is refocused over a single rotor period due to the spatial averaging by the motion of the rotor under magic-angle spinning. In the S spectrum, the spin part of the dipolar interaction is manipulated by the application of rotorsynchronized dephasing π-pulses to prevent full refocusing. Dipolar evolution over the rotor period in the S spectrum results in a reduced peak intensity for spin pairs that are dipolar coupled. The difference in signal intensity (REDOR difference, ΔS = S0 - S) for the observed spin (15N) in the two parts of the REDOR experiment is directly related to the heteronuclear dipolar coupling from which the corresponding distance to the dephasing spin (31P) is determined.
Well-resolved 15N solid-state NMR signals are generally observed for histidine, arginine, and lysine sidechain nitrogens of uniformly 15N-labeled proteins (34). It is therefore possible to accurately measure a few specific distances from the phosphorus atoms of intermediate-analogue ligands to nitrogens of the uniformly 15N-labeled protein. For example, from the x-ray structure we know that of the 11 lysines in each subunit, only one is in the vicinity of the binding site. Thus, a REDOR determination of the distance of the ε-15N of this lysine sidechain nitrogen to the 31P of the ligand (which for N-P distance measurements of the order of 5 Å are possible to within ± 0.2 Å) (34) is more accurate than the corresponding distance determination from x-ray analysis alone. Additional accurate distances can be determined by 15N{31P} REDOR from ligand phosphorus to histidine and arginine sidechain nitrogens identified as proximate by the x-ray structure. Information about the possible conformational mobility of the phosphonate moiety and the surrounding amino acid residues might then be gained through molecular dynamics simulations using distance restraints determined by 15N{31P} REDOR NMR (35).
MATERIALS AND METHODS
4-(6-D-Ribitylamino-2,4-dihydroxypyrimidin-5-yl)-1-butylphosphonic Acid (14), 5-(6-DRibitylamino-2,4-dihydroxypyrimidin-5-yl)-1-pentylphosphonic Acid (15), and 6-(6-DRibitylamino-2,4-dihydroxypyrimidin-5-yl)-1-hexylphosphonic Acid (16). These three compounds were synthesized as previously described (26).
Uniformly 15N-Labeled Lumazine Synthase of Saccharomyces cerevisiae. The construction of the plasmid p602rib4-CAT directing the hyperexpression of the gene specifying pentameric lumazine synthase of S. cerevisiae has been described earlier (36). The plasmid was transduced into E. coli strain M15[pGB3] yielding strain M15[pGB3]-p602rib4-CAT. The recombinant strain was grown in minimal medium (12.0 g/L Na2HPO4 · 7 H2O, 3.0 g/L KH2PO4, 0.5 g/L MgSO4·7 H2O, 0.03 g/L CaCl2·2 H2O, 0.5 % glucose) which was supplemented with trace elements (50 mg/L EDTA, 8.5 mg/L FeSO4·7 H2O, 13.5 mg/L MnCl2·2 H2O, 0.9 mg/L ZnSO4·7 H2O, 0.2 mg/L CuCl2·2 H2O, 0.2 mg/L NiCl2·6 H2O, 0.1 mg/L CoCl2·6 H2O, 0.1 mg/L H3BO3, pH 7.4) and with vitamins (80 μg/L pyridoxamine hydrochloride, 160 μg/L thiamine hydrochloride, 80 μg/L riboflavin, 80 μg/L p-amino-benzoic acid, 80 μg/L Ca-pantothenate, 20 μg/L biotin, 40 μg/L folic acid, 60 μg/L nicotinic acid, 0.4 μg/L cyanocobalamin). 15NH4Cl (1.0 g per liter) was added as the only source of nitrogen, along with 20 mg/L of kanamycin and 150 mg/L of ampicillin for the maintenance of the plasmids. IPTG (final concentration, 2 mM) was added to cultures during shaking when they had reached an optical density of 0.7 (600 nm). Incubation was continued for 18 h. The cells were harvested by centrifugation. Lumazine synthase was purified as described earlier (36).
Preparation of the Complexes
[U-15N]Labeled lumazine synthase was first concentrated using a filtration device passing proteins less than 50 kDa (Amicon Centriplus YM-50 centrifugal filter, Millipore Corporation, Bedford, MA) and an Eppendorf 5810R refrigerated centrifuge operating at 3,000 rpm. The concentrations of protein used to form the complex with phosphonate compounds 14, 15, and 16 were 11.6, 22.5, and 17.6 mg/mL, respectively, as determined by a non-interfering protein assay (Geno Technology, Inc.). Each sample was prepared in buffer solution containing 1 mM EDTA and 50 mM triethanolamine-HCl at pH 7.0, and lyophilized with 50 mM trehalose as lyoprotectant and 1% PEG 8000 as cryoprotectant.
Spectrometers
For lumazine synthase complexed with phosphonates 14 and 16, 15N{31P} REDOR NMR spectra were recorded using a spectrometer equipped with a four-frequency (HFPN) transmission-line probe. The probe has a 10.55-mm long, 5.12-mm i.d. analytical coil and a Chemagnetics/Varian magic-angle spinning stator. The spectrometer was controlled by a Tecmag pulse programmer. Radio frequency (rf) pulses for 1H (499.882 MHz) and 19F (470.274 MHz) were amplified by 50-W American Microwave Technology power amplifiers (AMT 3137) followed by second-stage amplification using 2-kW and 1-kW Creative Electronics (CE) tube amplifiers, respectively. For 31P(202.355 MHz) and 15N (50.654 MHz), rf pulses were amplified by 1-kW and 2-kW American Microwave Technology power amplifiers. A 12-Tesla static magnetic field was provided by an 89-mm bore Magnex superconducting solenoid.
For lumazine synthase complexed with phosphonate 15, 15N{31P} REDOR NMR spectra were recorded using a three-channel Chemagnetics console (Fort Collins, CO) modified with a four-frequency (HPCN) transmission-line probe (at 300, 121, 75, and 30 MHz, respectively) (37). An Oxford magnet was used to produce a 7.05-Tesla static magnetic field.
15N{31P} REDOR NMR for Lumazine Synthase Complexed with Phosphonate 14
The sample was packed in a 4-mm ceramic rotor. 15N{31P} REDOR NMR was performed for 208 rotor cycles of dipolar evolution with magic-angle spinning at 8130 Hz. REDOR S and S0 spectra each resulted from the accumulation of 596,916 scans. The spinning speed was under active control to within ±3 Hz. Other parameters included: 2-ms 50-kHz 1H-15N Hartmann-Hahn CP match, 6-μs 31P π pulses (83 kHz), 7-μs 15N π pulses (71 kHz), and proton decoupling of 100 kHz. Standard xy8 phase cycling was used for both 31P and 15N π pulses to eliminate offset effects and pulse imperfections.
15N{31P} REDOR NMR for Lumazine Synthase Complexed with Phosphonate 15
The sample was packed into a high-performance 7.5 mm outside-diameter zirconia rotor and spun at 5000 Hz. The spinning speed was under active control to within ±2 Hz. 15N{31P} REDOR experiments were performed for 32, 48, 64, 96, 112, 128 and 144 rotor cycles of dipolar evolution. Other parameters included: 2-ms 50-kHz 1H-15N Hartmann-Hahn CP match, 10-μs 31P π pulses (50 kHz), 10-μs 15N π pulses (50 kHz), and proton decoupling of 95 kHz. Standard xy8 phase cycling was used for for both 31P spin and 15N π pulses.
15N{31P} REDOR NMR for Lumazine Synthase Complexed with Phosphonate 16
The sample was packed in a 4-mm ceramic rotor. 15N{31P} REDOR experiments were performed for 64, 96,128, 144 and 160 rotor cycles of dipolar evolution with a magic-angle spinning at 6250 Hz. 15N{31P} REDOR experiments were also performed for 264 rotor cycles of dipolar evolution with a magic-angle spinning at 9091 Hz. The spinning speed was under active control to within ±3 Hz. Other parameters included: 2-ms 55-kHz 1H-15N Hartmann-Hahn CP match, 4.9-μs 31P π pulses (102 kHz), 7-μs 15N π pulses (80 kHz), and proton decoupling of 100 kHz. Standard xy8 phase cycling was used for both 31P spin and 15N π pulses.
Computer Simulations
Computer simulations were performed on the supercomputer cluster at the Center for Computational Research at SUNY Buffalo (www.ccr.buffalo.edu) and the NYSGrid network of supercomputers available for the researchers in the State of New York (www.nysgrid.org). Two suites of programs were used for the simulations: AutoDock 3.0.5, The Scripps Research Institute (TSRI), AutoDock (http://autodock.scripps.edu); and AMBER 9, TSRI, AMBER Molecular Dynamics Package (http://amber.scripps.edu).
AutoDock 3.0.5, a suite of programs applying an automated Lamarckian genetics-based docking method (38), was used to dock a neutral version of the 6-carbon linker ligand 16 to lumazine synthase. The genetic crossover rate was set to 0.8 and the mutation rate was set to 0.02. The population size was 150, the number of generations was 27,000, and the maximum number of energy evaluations was set to 250 × 106. The number of runs was chosen to be 200. Each run finished before the maximum number of energy evaluations was reached.
Docking of ligand 16 to each binding site of lumazine synthase began with the 1EJB coordinates of the atomic structure of pentameric lumazine synthase from S. cerevisiae (22). The structure of ligand 16 was created from ligand 15 of 1EJB by inserting a methylene group into its 5-carbon chain using a Materials Studio 4.1 Visualizer (Accelrys, San Diego). Two sets of 200 docking runs were performed: one with both chains of the ligand being flexible and the other with only the chain ending with phosphonate group allowed to be flexible (the other chain kept the conformation of the 5-carbon linker in the 1EJB structure). The partial charges necessary for the evaluation of the free energy of binding were calculated using the default Gasteiger charges (39).
The AMBER 9 suite of programs was used to perform molecular dynamics simulations on lumazine synthase complexed with inhibitors 15 or 16. Coordinates for the protein and inhibitor 15 were obtained from the 1EJB crystal structure. Inhibitor 15 was replaced by 16 in each binding site in such a way that the pseudo-5-fold symmetry of the pentamer was preserved. Fifteen Na+ ions were added to the protein-ligand complexes for neutralization. The complex was then immersed in a TIP3P box of water (40) extending 15 Å from the surface of the protein, and the resulting system was equilibrated for 120 ps at 300 K using the NPH method (constant number of particles, constant-enthalpy, constant pressure) with the density of water set to 1 g/cm3. The AMBER forcefield (2003 version) was used for the protein and water. The forcefield parameters for the ligands were obtained from GAFF (General Amber Force Field). Partial charges for the ligands were calculated using the electrostatic potential fit method in the DMol3 module of the Materials Studio 4.1 software (Accelrys, San Diego) (41). Molecular dynamics simulations were performed for several ns at 300 K using the NVT method (constant number of particles, constant volume, constant temperature), with SHAKE constraints on the hydrogen atoms and a 2-fs time step. Periodic boundary conditions were used. No atoms were fixed during the dynamics simulations.
RESULTS
Solid-State NMR
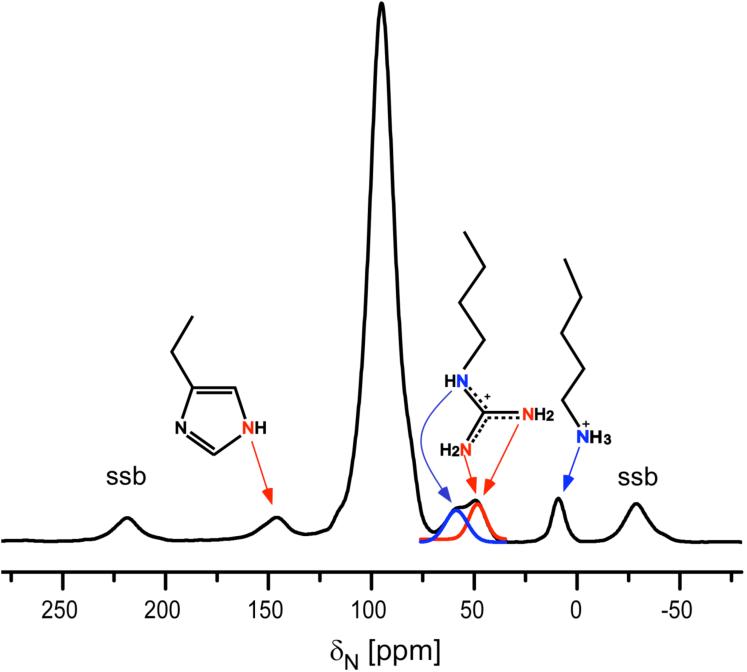
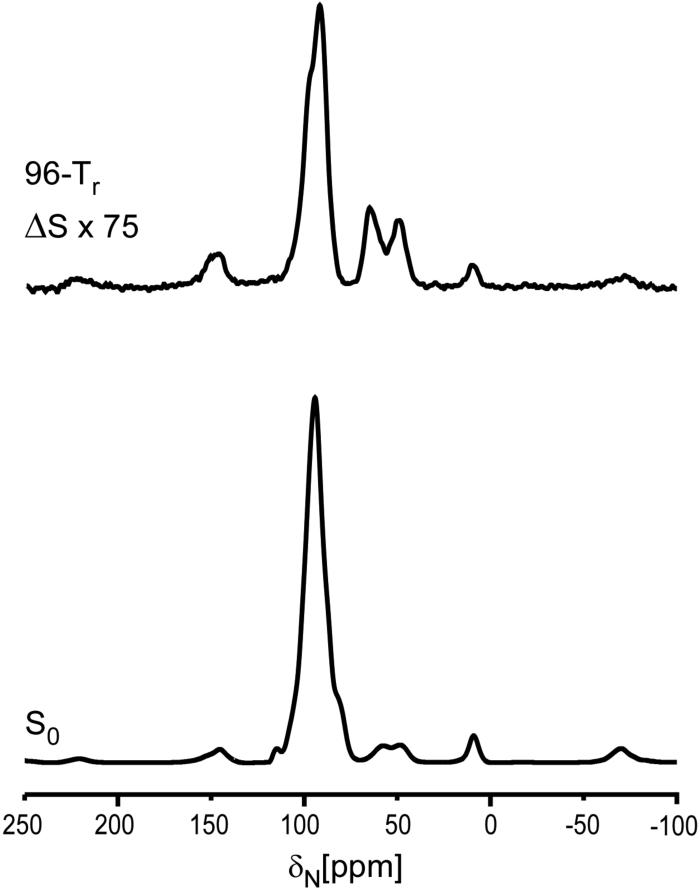
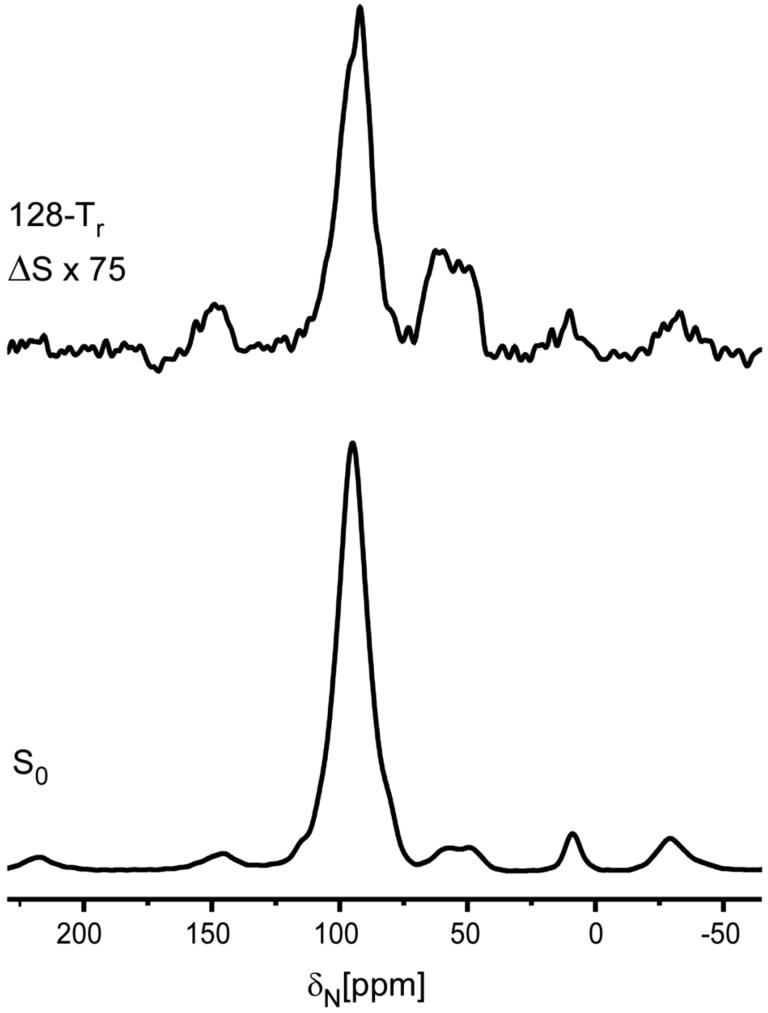
The 15N CPMAS NMR spectrum of S. cerevisiae [U-15N]lumazine synthase is shown in Figure 2. As expected, well-resolved signals are observed for histidine, arginine and lysine sidechain nitrogens (32). However, dephasing for the sidechain nitrogen peaks was low signal-to-noise in the 50-MHz 15N{31P} REDOR difference spectrum of the complex derived from the four-carbon linker compound 14 (data not shown), consistent with a small sample size (36 mg of protein) and a relatively low enzyme affinity (Ki 440 μM vs. Bacillus subtilis lumazine synthase) (26). In contrast, well-defined sidechain difference signals were observed in the 30- and 50-MHz 15N{31P} REDOR spectra (Figures 3 and 4, respectively) derived from 15 (Ki 180 μM vs. B. subtilis lumazine synthase) (26) and 16 (Ki 130 μM vs. B. subtilis lumazine synthase) (26).
Figure 2.
50-MHz 15N CPMAS NMR spectrum and sidechain nitrogen line assignments for S. cerevisiae [U-15N]lumazine synthase. Chemical shifts are referenced to solid ammonium sulfate. To convert to a liquid ammonia reference, add 20 ppm. Abbreviation: ssb, spinning side band.
Figure 3.
30-MHz 15N{31P} REDOR spectra of the 5-carbon-linker 15 complex after 19.2 ms of dipolar evolution. The REDOR difference is shown at the top of the figure, and the full echo at the bottom. The sample contained 110 mg of protein. The scan count was 262,144 and the magic angle spinning rate was 5000 Hz.
Figure 4.
50-MHz 15N{31P} REDOR spectra of the 6-carbon-linker 16 complex after 20.48 ms of dipolar evolution. The REDOR difference is shown at the top of the figure, and the full echo at the bottom. The sample contained 44 mg of protein. The scan count was 284,000 and the magic angle spinning rate was 6250 Hz.
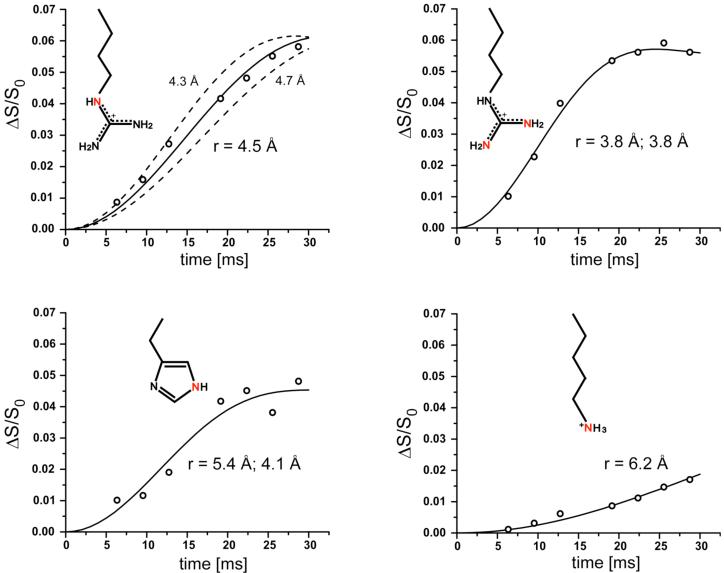
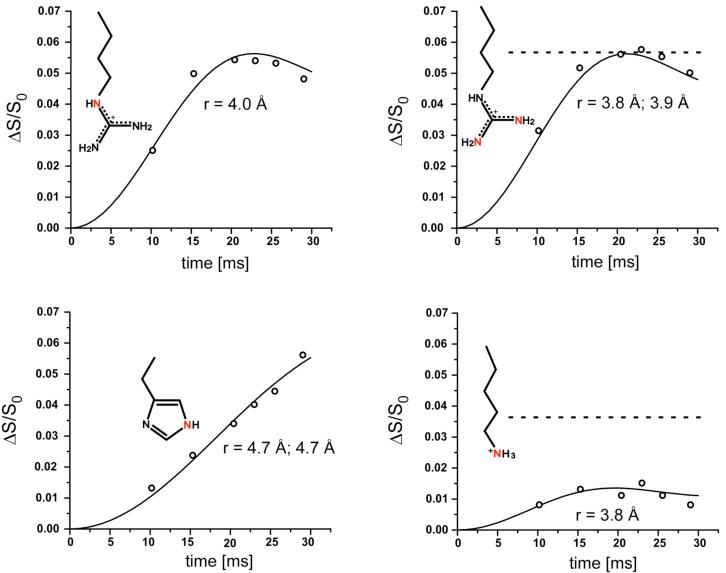
The 15N{31P} REDOR dephasing (ΔS/S0) of the sidechain nitrogens of the 5-carbon-linker 15 complex and 6-carbon-linker 16 complex with S. cerevisiae lumazine synthase are shown in Figures 5 and 6. The symbols are the experimental data and the solid lines are the calculated dephasing assuming specific N-P distances and dephasing maxima (plateaus). The resulting REDOR-determined distances are listed in Table 1.
Figure 5.
Experimental (circles) and calculated (solid lines) 15N{31P} REDOR dephasing (Δ/S0) as a function of dipolar evolution time for sidechain nitrogens (highlighted in red) of S. cerevisiae lumazine synthase complexed with the 5-carbon-linker phosphonate 15. Estimated error in N-P distances is less than ± 0.2 Å (upper left panel). The experimental dephasing was the result of the accumulation of 2,282,636 scans for both S and S0 REDOR spectra.
Figure 6.
Experimental (circles) and calculated (solid lines) 15N{31P} REDOR dephasing (Δ/S0) as a function of dipolar evolution time for sidechain nitrogens (highlighted in red) of S. cerevisiae lumazine synthase complexed with the 6-carbon-linker phosphonate 16. The experimental dephasing was the result of the accumulation of 1,613,824 scans for both S and S0 REDOR spectra. The dashed line for the upper right plot indicates that the maximum dephasing of the arginine peak is 0.055, which corresponds to 38% occupancy of the lumazine synthase active sites. The dashed line for the lower right plot shows that the corresponding expected maximum dephasing of the lysine peak is 0.034 (from 0.38/11). The observed dephasing maximum of the lysine peak is 0.013.
Table 1.
Distances between Phosphorus of the Ligand and Nitrogen Atoms of the Protein in S. cerevisiae Lumazine Synthase
| X-ray distances (1EJB) 5-carbon linker compound 15 (Å)a | REDOR distances for 5-carbon linker compound 15 (Å)b | REDOR distances for 6-carbon linker compound 16 (Å)c | |
|---|---|---|---|
| P to NZ of Lys92 | 7.4 | 6.2 | 3.8 |
| P to NE of Arg136 | 3.8 | 4.5 | 4.0 |
| P to NH of Arg136 | 5.6 | 3.8 | 3.8 |
| P to NH of Arg136 | 3.8 | 3.8 | 3.9 |
| P to NE of His148 | 6.8 | 5.4 | 4.7 |
| P to NE of His97 | 7.2 | 4.1 | 4.7 |
The distances were obtained from the published crystal structure of S. cerevisiae lumazine synthase in complex with the 5-carbon-linker compound 15 (22).
The distances were calculated from the REDOR NMR dephasing displayed in Figure 5.
The distances were calculated from the REDOR NMR dephasing displayed in Figure 6.
The REDOR dephasing of the 50-ppm arginine peaks of both complexes have well-defined plateaus. These values determine the percentage of the yeast lumazine synthase binding sites occupied by the inhibitor. The dephasing maximum for the 5-carbon-linker complex is 5.9%, and for the 6-carbon-linker complex, 5.4%. The theoretical maximum dephasing is 14% for 100% binding-site occupancy because each subunit of the enzyme has 7 arginine residues but only one is within dephasing range of the phosphorus of the ligand (22). Dephasing of 5.9% and 5.4% therefore corresponds to 41% and 38% occupancy, respectively. Similarly, the maximum dephasing for the histidine nitrogen based on 100% occupancy is 2/6 = 33%, and for 40% occupancy, 13%. The experimental fitted plateau for histidine is 13% (Figure 6, lower left).
Based on 38% occupancy, the maximum dephasing for the lysine peak is therefore (0.38)(1/11) = 3.4% for the 6-carbon-linker complex. However, the plateau of the REDOR curve of the lysine peak is well established at 1.3%, substantially less than the expected dephasing (Figure 6, lower right). One possibility to account for this discrepancy is the presence of multiple binding conformations, in some of which the NZ atoms of Lys92 are close to the phosphorus atom of the inhibitor resulting in full dephasing, while in others they are farther away than 8 Å, and only partial REDOR dephasing occurs.
Molecular Dynamics Simulations
Ligand 16 was inserted in the five binding sites of the protein using AutoDock 3.0.5. This docking process used a Lamarckian genetic algorithm and an empirical binding free energy function to create possible binding conformations and orientations of the ligand. The neutral ligands were allowed to be flexible but the protein was kept rigid. A total of 2000 conformers, 400 for each binding site, was produced. About 90% of the conformers assumed orientations and positions similar to those in the x-ray structure of the 5-carbon linker 15 complex (22), with the phosphorus atom 7-8 Å from NZ of Lys92.
Next, molecular dynamics simulations introduced flexibility to the whole system. Molecular dynamics simulations using AMBER 9 software were run for the three lumazine synthase complexes with neutral ligand having the lowest docking energies (designated as structures I, II, and III), and also for the original crystal structure 1EJB (with neutral ligand 15, Figure 7). The runs lasted about 3 ns and produced one clear case of a divergence in P-Lys92 (NZ) distances. The NZ of Lys92B in structure III moved away from the phosphorus atom of the inhibitor to a distance greater than 8 Å. The other P-Lys92 (NZ) distances stayed in the vicinity of 7-8 Å, and in only a few cases reached values less than 6 Å. These simulations were not restrained by REDOR distances, and the results are not consistent with the experimental REDOR dephasing (Figure 6, bottom right).
Figure 7.
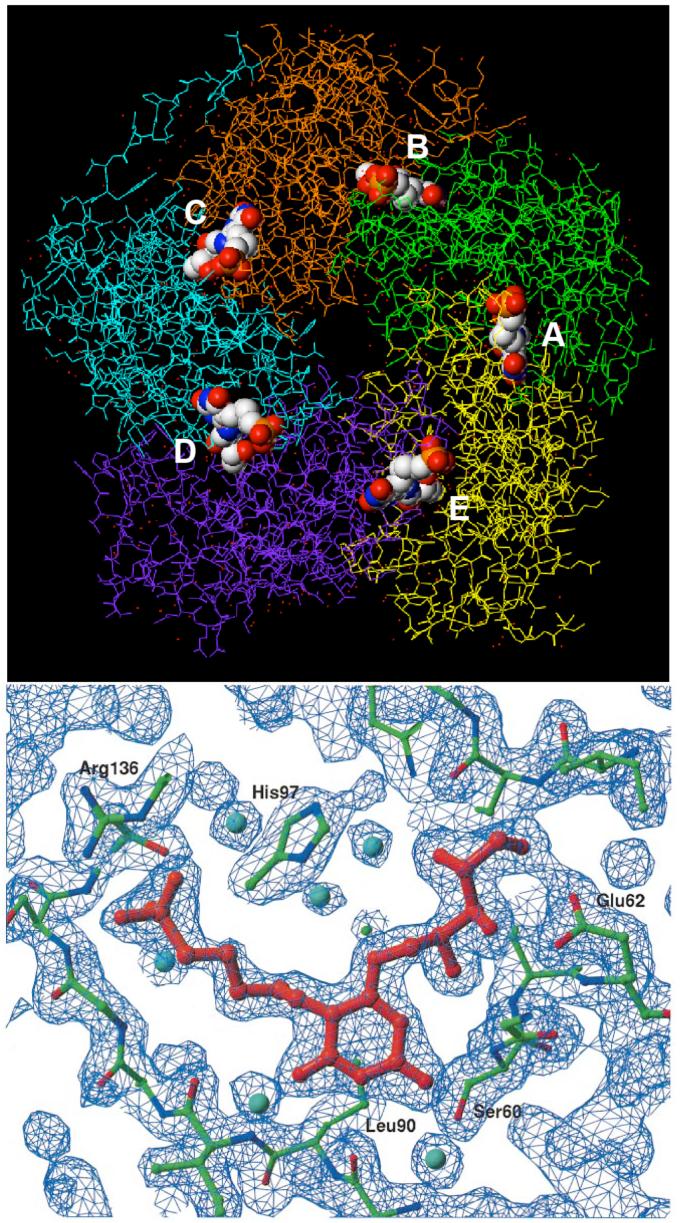
Top: crystal structure (PDB ID: 1EJB) of S. cerevisiae lumazine synthase pentamer with bound ligand 15. The five subunits are shown in stick form, while the five ligand molecules are shown as space-filling models color coded according to atom type. The N-termini in the subunits exist in different conformations in the crystalline state. The five binding sites, which contain amino acid residues from adjacent monomers, are labeled A-E. Bottom: stick model and electron density map of inhibitor 15 bound in the active site (22).
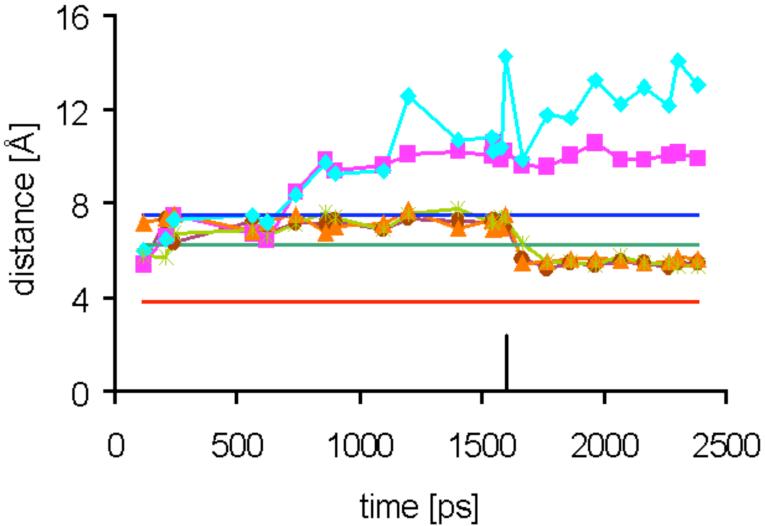
A second set of dynamics simulations included distance information from the REDOR experiment by introducing “flat bottom” restraints. The energy penalty for these restraints is defined by a well with a square bottom of value 0 between r2 and r3, and parabolic sides to lower and upper-bound distances r1 and r4, respectively. The well has linear sides elsewhere and is single-valued and continuous at r1 and r4. The force constant within the parabolic region of the well was 10 kcal/mol·Å2. Structure I underwent a succession of five restrained annealing (300K-500K-300K) runs of 300 ps duration after an initial 2 ns of unrestrained dynamics. Restraints were introduced during the annealing for those P-Lys92 (NZ) distances that reached a value less than 6.5 Å after the unrestrained dynamics. For structures II and III, restraints to all the REDOR-derived 31P-15N distances other than P-Lys92 (NZ) were introduced at the start of the simulations, which were performed at 300 K. Restraints were imposed on three P-Lys92 (NZ) distances in structure II that reached a value less than 6.5 Å after the first 1.7 ns of dynamics. No P-Lys92 (NZ) distance restraints were implemented for structure III because these distances were greater than 8 Å in all five binding sites throughout the simulation. Molecular dynamics simulations were also run for the original 1EJB structure with REDOR-derived restraints obtained for the complex of lumazine synthase with 15. The distance values of all the structures minimized after the last step of dynamics, along with the distance parameters (r1) r2-r3 (r4) of the flat-bottom restraints, are listed in Table 2. Figure 8 shows the time evolution of the distances between the phosphorus of inhibitor 16 and NZ of Lys92 for structure II during restrained molecular dynamics at 300 K.
Table 2.
Distances of the Molecular Dynamics Simulations
| Atomsa | 16-Ib Å | 16-IIc Å | 16-IIId Å | 16 Restraints Radiie | 16 REDORf Å | 15-IVg Å | 15 Restraints Radiih | 15REDORi Å | 15 X-Rayj Å |
|---|---|---|---|---|---|---|---|---|---|
| NZ LysA92-P | 9.6k | 5.3 | 8.2 k | (3.8) 4.5 - 5.0 (6.0) | 3.8 or >8 | 7.3 | (5.7) 6.2 - 7.4 (7.8) | 6.2 | 7.4 |
| NZ LysB92-P | 5.7 | 10.3 k | 10.1 k | (3.8) 4.5 - 5.0 (6.0) | 3.8 or >8 | 7.6 | (5.7) 6.2 - 7.4 (7.8) | 6.2 | 7.4 |
| NZ LysC92-P | 5.4 | 5.5 | 9.7k | (3.8) 4.5 - 5.0 (6.0) | 3.8 or >8 | 7.3 | (5.7) 6.2 - 7.4 (7.8) | 6.2 | 7.4 |
| NZ LysD92-P | 5.4 | 13.6k | 9.0k | (3.8) 4.5 - 5.0 (6.0) | 3.8 or >8 | 7.5 | (5.7) 6.2 - 7.4 (7.8) | 6.2 | 7.4 |
| NZ LysE92-P | 8.6k | 5.5 | 8.7k | (3.8) 4.5 - 5.0 (6.0) | 3.8 or >8 | 7.5 | (5.7) 6.2 - 7.4 (7.8) | 6.2 | 7.4 |
| NE2 HisA97-P | 4.7 | 5.3 | 5.3 | (4.0) 4.7 - 5.0 (7.3) | 4.7 | 5.8 | (4.7) 5.0 - 5.9 (7.3) | 5.4 | 7.2 |
| NE2 HisB97-P | 5.2 | 5.0 | 5.1 | (4.0) 4.7 - 5.0 (7.3) | 4.7 | 5.7 | (4.7) 5.0 - 5.9 (7.3) | 5.4 | 7.2 |
| NE2 HisC97-P | 4.6 | 5.3 | 5.2 | (4.0) 4.7 - 5.0 (7.3) | 4.7 | 5.8 | (4.7) 5.0 - 5.9 (7.3) | 5.4 | 7.2 |
| NE2 HisD97-P | 5.4 | 5.2 | 5.0 | (4.0) 4.7 - 5.0 (7.3) | 4.7 | 5.9 | (4.7) 5.0 - 5.9 (7.3) | 5.4 | 7.2 |
| NE2 HisE97-P | 5.1 | 4.9 | 4.8 | (4.0) 4.7 - 5.0 (7.3) | 4.7 | 5.8 | (4.7) 5.0 - 5.9 (7.3) | 5.4 | 7.2 |
| NE ArgA136-P | 4.0 | 4.6 | 4.2 | (3.5) 4.0 - 4.5 (5.0) | 4.0 | 3.9 | (3.5) 4.0 - 4.5 (5.0) | 4.5 | 3.8 |
| NE ArgB136-P | 4.4 | 3.8 | 3.8 | (3.5) 4.0 - 4.5 (5.0) | 4.0 | 4.0 | (3.5) 4.0 - 4.5 (5.0) | 4.5 | 3.8 |
| NE ArgC136-P | 4.7 | 3.8 | 4.4 | (3.5) 4.0 - 4.5 (5.0) | 4.0 | 3.8 | (3.5) 4.0 - 4.5 (5.0) | 4.5 | 3.8 |
| NE ArgD136-P | 3.9 | 3.9 | 3.6 | (3.5) 4.0 - 4.5 (5.0) | 4.0 | 3.6 | (3.5) 4.0 - 4.5 (5.0) | 4.5 | 3.8 |
| NE ArgE136-P | 4.4 | 4.0 | 3.8 | (3.5) 4.0 - 4.5 (5.0) | 4.0 | 4.0 | (3.5) 4.0 - 4.5 (5.0) | 4.5 | 3.8 |
| NH1 ArgA136-P | 4.5 | 4.3 | 4.3 | (3.5) 3.9 - 4.5 (5.0) | 3.9 | 5.2 | (3.5) 3.9 - 4.9 (5.6) | 3.8 | 5.6 |
| NH1 ArgB136-P | 3.8 | 5.6 | 5.2 | (3.5) 3.9 - 4.5 (5.0) | 3.9 | 5.2 | (3.5) 3.9 - 4.9 (5.6) | 3.8 | 5.6 |
| NH1 ArgC136-P | 4.1 | 4.7 | 3.9 | (3.5) 3.9 - 4.5 (5.0) | 3.9 | 5.4 | (3.5) 3.9 - 4.9 (5.6) | 3.8 | 5.6 |
| NH1 ArgD136-P | 4.0 | 4.7 | 5.5 | (3.5) 3.9 - 4.5 (5.0) | 3.9 | 5.4 | (3.5) 3.9 - 4.9 (5.6) | 3.8 | 5.6 |
| NH1 ArgE136-P | 4.7 | 4.2 | 3.5 | (3.5) 3.9 - 4.5 (5.0) | 3.9 | 4.5 | (3.5) 3.9 - 4.9 (5.6) | 3.8 | 5.6 |
| NH2 ArgA136-P | 4.1 | 4.6 | 4.6 | (3.5) 3.9 - 4.5 (5.0) | 3.8 | 3.5 | (3.5) 3.8 - 4.3 (4.5) | 3.8 | 3.8 |
| NH2 ArgB136-P | 4.8 | 3.8 | 3.9 | (3.5) 3.9 - 4.5 (5.0) | 3.8 | 3.6 | (3.5) 3.8 - 4.3 (4.5) | 3.8 | 3.8 |
| NH2 ArgC136-P | 4.0 | 4.1 | 3.9 | (3.5) 3.9 - 4.5 (5.0) | 3.8 | 3.5 | (3.5) 3.8 - 4.3 (4.5) | 3.8 | 3.8 |
| NH2 ArgD136-P | 4.8 | 4.1 | 3.3 | (3.5) 3.9 - 4.5 (5.0) | 3.8 | 3.7 | (3.5) 3.8 - 4.3 (4.5) | 3.8 | 3.8 |
| NH2 ArgE136-P | 4.5 | 4.2 | 3.5 | (3.5) 3.9 - 4.5 (5.0) | 3.8 | 4.3 | (3.5) 3.8 - 4.3 (4.5) | 3.8 | 3.8 |
| NE2 HisA148-P | 5.1 | 5.2 | 4.5 | (4.0) 4.7 - 5.0 (7.3) | 4.7 | 4.5 | (3.7) 4.1 - 4.6 (5.6) | 4.1 | 6.8 |
| NE2 HisB148-P | 5.1 | 5.0 | 4.8 | (4.0) 4.7 - 5.0 (7.3) | 4.7 | 4.6 | (3.7) 4.1 - 4.6 (5.6) | 4.1 | 6.8 |
| NE2 HisC148-P | 5.0 | 5.1 | 4.6 | (4.0) 4.7 - 5.0 (7.3) | 4.7 | 4.2 | (3.7) 4.1 - 4.6 (5.6) | 4.1 | 6.8 |
| NE2 HisD148-P | 5.0 | 5.2 | 4.8 | (4.0) 4.7 - 5.0 (7.3) | 4.7 | 4.5 | (3.7) 4.1 - 4.6 (5.6) | 4.1 | 6.8 |
| NE2 HisE148-P | 5.4 | 4.9 | 5.0 | (4.0) 4.7 - 5.0 (7.3) | 4.7 | 4.8 | (3.7) 4.1 - 4.6 (5.6) | 4.1 | 6.8 |
Atoms whose distances are calculated or determined at the five binding sites A, B, C, D, and E.
Distance between atoms calculated from molecular dynamics simulation of the enzyme-16 complex starting from docked conformer I.
Distance between atoms calculated from molecular dynamics simulation of the enzyme-16 complex starting from docked conformer II.
Distance between atoms calculated from molecular dynamics simulation of the enzyme-16 complex starting from docked conformer III.
REDOR restraint radii (r1) r2-r3 (r4) used in the molecular dynamics simulation involving 16.
Distance determined by 15N{31P} REDOR NMR on the enzyme-16 complex.
Distance between atoms calculated from molecular dynamics simulation of the enzyme-15 complex starting from docked conformer IV.
REDOR restraint radii (r1) r2-r3 (r4) used in the molecular dynamics simulation involving 15.
Distance determined by 15N{31P} REDOR NMR on the enzyme-15 complex.
Distances determined by crystallography on the enzyme-15 complex.
Italicized: not restrained.
Figure 8.
Time evolution of distances between the phosphorus atom of 16 and NZ of Lys92 in the five ligand binding sites A-E (colors) of the pentamer (see Figure 7 for the labeling of the binding sites) during molecular dynamics at 300 K for structure II. The restraints to all REDOR residues (excluding Lys92) were applied at the start. Lys92 restraints in three binding sites (for Lys A92, Lys C92 and Lys E92) were applied at about 1.6 ns (see black marker). The distances LysB92-P and LysD92-P (purple and light blue, respectively) remained unrestrained during the entire dynamics run. Experimental x-ray (for the lumazine synthase complex with 15) and REDOR distances (for the lumazine synthase complexes of 15 and 16) are shown as straight lines colored dark blue, green and red, respectively.
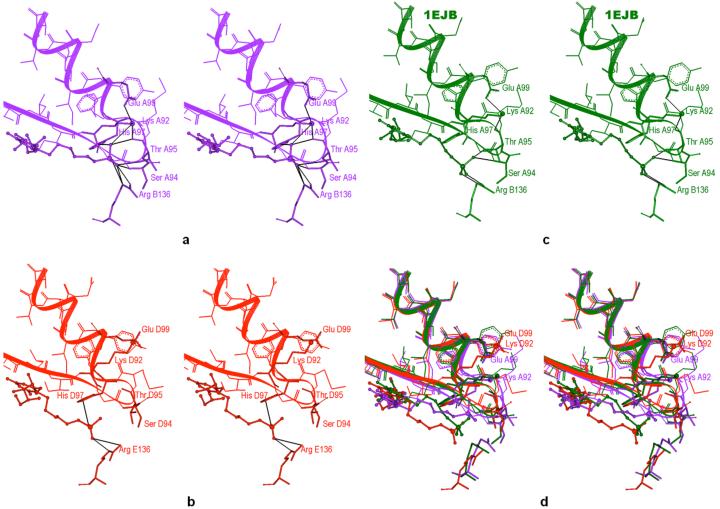
Three-dimensional pictures (3-D Visualizer by Accelrys, San Diego) reveal that the divergence in P-Lys92 (NZ) distances results from the flexibility of Lys92 side chain. In the 1EJB structure, Lys92 (NZ) forms hydrogen bonds with the oxygens of nearby residues Glu99 and Thr95 in all five binding sites (Figure 9c). Black lines in this figure represent the hydrogen bonds. In the simulated 6-carbon-linker inhibitor structure, the binding sites with low P-Lys92 (NZ) distances also have this hydrogen bonding arrangement (Figure 9a). In addition, Lys92 (NZ) is possibly engaged in hydrogen bonding with one of the oxygens of the phosphonate group of the 6-carbon-linker inhibitor. However, in the simulated binding sites with a P-Lys92 (NZ) distance approaching 12-14 Å, Lys92 has broken the hydrogen bonds with Glu99 and the backbone oxygen of Thr95 (Figure 9b). The side chain of Glu99 has also flipped away from its conformation in the 1EJB structure. The interaction between Lys92 and the 6-carbon-linker ligand 16 seems to involve a distortion of the loop 92-97 in the binding sites where the distance between the ligand phosphorus atom and NZ (Lys92) is small enough to allow for hydrogen bonding.
Figure 9.
Stereo views of the occupied binding sites of lumazine synthase. The inhibitor is rendered in ball-and-stick mode. Lys92 is shown as a stick with a larger ball representing NZ. Hydrogen bonds are in black. a) Binding site A of the 6-carbon-linker inhibitor 16 in simulated structure II after restrained dynamics. Lys92 (NZ) possibly forms a hydrogen bond with one of the oxygens of the inhibitor phosphonate group in addition to hydrogen bonding with Glu99 and Thr95. The inhibitors phosphonate group is also within hydrogen bonding distance to Ser94, Thr95 and His97 of the 92-97 loop, and to Arg 136. b) Binding site D of the 6-carbon-linker inhibitor 16 in simulated structure II after restrained dynamics. The hydrogen bonds between Lys92 (NZ) and Glu99 or Thr95 are broken. The inhibitor phosphonate group forms a hydrogen bond with His97 and Arg136. c) A binding site of the 5-carbon-linker-inhibitor 15 in the x-ray structure (1EJB). Lys92 (NZ) forms hydrogen bonds with Glu99 and Thr95. The inhibitor phosphonate group forms hydrogen bonds with Ser94, Thr95 and Arg136. d) Superposition of the binding sites shown in a - c with the same coloring scheme.
DISCUSSION
The interaction between Lys92 and the 6-carbon-linker ligand 16 seems to involve a distortion of the loop 92-97 in the binding sites, where the distance between the ligand phosphorus atom and NZ (Lys92) is small enough to allow for hydrogen bonding. The 92-97 loop displays some flexibility in the 1EJB structure: the atomic temperature factors (B-values) obtained from x-ray refinement for all the atoms of this loop are above 20 Å2, sometimes surpassing 30 Å2. The molecular dynamics simulations indicate that the Lys92 side chain in the lumazine synthase complex with ligand 16 can exist in two distinctly different states: 1) Its nitrogen can stay hydrogen bonded to Thr95 and Glu99 as in the lumazine synthase structure complexed with ligand 15. In this case a hydrogen bond with one of the oxygens of the inhibitor phosphonate group is formed. 2) The hydrogen bonds between Lys92 (NZ) and Glu99 or Thr95 can be broken and no hydrogen bonding formed between NZ and the phosphonate group of the inhibitor. Thus the explanation for the less-than-expected dephasing observed for the 15N{31P} REDOR signal in the spectrum of (Figure 6, bottom right) is related to the flexibility of Lys92. The mobility of the Lys92 sidechain could therefore facilitate the required active-site release of phosphate during the enzyme-catalyzed reaction (hypothetical Schemes 2 and 3). The higher binding affinity for the larger transition-state analogue (16 vs 15) is also consistent with an entropically expanded and mobile active site during catalysis (42).
The mobility of Lys92 and its ability to closely approach the phosphate of the ligand could not have been expected or predicted on the basis of the 1EJB crystal structure alone. The 1EJB crystal structure indicated distances of 7.35, 7.47, 7.31, 7.63, and 7.44 Å between the five phosphorus atoms of the five 15 ligands and the five Lys92 side chain nitrogen atoms in the five binding sites of the lumazine synthase pentamer (Figure 7). The present REDOR/molecular dynamics study involving 16, on the other hand, presents a picture of mobile Lys92 residues with side chain nitrogens either 3.8 Å or as much as 14 Å removed from the phosphorus atom.
With regard to the possible lumazine synthase mechanisms outlined in Schemes 2 and 3, the present study revealed a shifting pattern of hydrogen bonding of the protein to the phosphate, but it did not indicate a tendency of the phosphate of the ligand to completely dissociate from its binding site and travel toward a cyclic conformation (9 →10, Scheme 3) as previously proposed (23). This suggests that phosphate elimination occurs with the side chain in an extended conformation (5 →6, Scheme 2). The movement of the side chain toward a cyclic structure could then occur with inorganic phosphate still bound at the phosphate binding site (6 →7, Scheme 2).
Acknowledgments
This research was made possible by NIH grants GM51469 and EB001964, the Fonds der Chemischen Industrie, and the Hans Fischer Gesellschaft. The experimental work was conducted in a facility constructed with support from Research Facilities Improvement Program Grant Number C06-14499 from the National Center for Research Resources of the National Institutes of Health. The Center for Computational Research at SUNY Buffalo and the New York State Grid are gratefully acknowledged, as well as the assistance of Jon Bednasz (Center for Computational Research at SUNY Buffalo), Michael Lewis (Binghamton University), Kenneth Chiu (Binghamton University).
Funding Information. This research was made possible by NIH grants GM51469 and EB001964, the Fonds der Chemischen Industrie, and the Hans Fischer Gesellschaft. The experimental work was conducted in a facility constructed with support from Research Facilities Improvement Program Grant Number C06-14499 from the National Center for Research Resources of the National Institutes of Health.
Abbreviations
- REDOR
rotational echo double resonance
- EDTA
ethylenediaminetetraacetic acid
- CPMAS
cross polarization magic angle spinning
REFERENCES
- (1).Fischer M, Bacher A. Biosynthesis of Flavocoenzymes. Nat. Prod. Rep. 2005;22:324–350. doi: 10.1039/b210142b. [DOI] [PubMed] [Google Scholar]
- (2).Fischer M, Bacher A. Biosynthesis of Vitamin B2 in Plants. Physiol. Plant. 2006;126:304–350. [Google Scholar]
- (3).Wang A. Isolation of Vitamin B2 Auxotroph and Preliminary Genetic Mapping in Salmonella typhimurium. I Chuan Hsueh Pao. 1992;19:362–368. [PubMed] [Google Scholar]
- (4).Oltmanns O, Lingens F. Isolation of Riboflavin-Deficient Mutants of Saccharomyces cerevisiae. Z. Naturforschung. 1967;22 b:751–754. [PubMed] [Google Scholar]
- (5).Logvinenko EM, Shavlovsky GM. Production and Some Properties of Riboflavine-Dependent Mutants of the Yeast Pichia guilliermondii. Mikrobiologiya. 1967;41:978–979. [Google Scholar]
- (6).Neuberger G, Bacher A. Biosynthesis of Riboflavin. An Aliphatic Intermediate in the Formation of 6,7-Dimethy-8-ribityl Lumazine from Pentose Phosphate. Biochem. Biophys. Res. Commun. 1985;127:175–181. doi: 10.1016/s0006-291x(85)80141-8. [DOI] [PubMed] [Google Scholar]
- (7).Shavlovsky GM, Teslyar GE, Strugovshchikova LP. Regulation of Flavinogenesis in Riboflavin-Dependent Escherichia coli Mutants. Mikrobiologyia. 19821979:986–992. [PubMed] [Google Scholar]
- (8).Shavlovsky GM, Sibirny AA, Kshanovskaya BV, Koltun LV, Logvinenko EM. Genetic Classification of Riboflavin-Less Mutants of Pichia Guilliermondii Yeast. Genetika. 1979;15:1561–1568. [PubMed] [Google Scholar]
- (9).Oltmanns O, Bacher A, Lingens F, Zimmermann FK. Biochemical and Genetic Classification of Riboflavine Deficient Mutants of Saccharomyces cerevisiae. Mol. Gen. Genet. 1969;105:306–313. doi: 10.1007/BF00277585. [DOI] [PubMed] [Google Scholar]
- (10).Bandrin SV, Beburov MY, Rabinovich PM, Stepanov AI. Riboflavin Auxotrophs of Escherichia-Coli. Genetika. 1979;15:2063–2065. [PubMed] [Google Scholar]
- (11).Logvinenko EM, Shavlovsky GM, Koltun LV. Production and Some Properties of Riboflavin-Deficient Mutants of the Yeast Pichia guilliermondii. Mikrobiologiya. 1972;41:1103–1104. [PubMed] [Google Scholar]
- (12).Rollenhagen C, Bumann D. Salmonella enterica Highly Expressed Genes Are Disease Specific. Infect. Immun. 2006;74:1649–1660. doi: 10.1128/IAI.74.3.1649-1660.2006. [DOI] [PMC free article] [PubMed] [Google Scholar]
- (13).Becker D, Selbach M, Rollenhagen C, Ballmaier M, Meyer TF, Mann M, Bumann D. Salmonella Metabolism Limits Possibilities for New Antimicrobials. Nature. 2006;440:303–307. doi: 10.1038/nature04616. [DOI] [PubMed] [Google Scholar]
- (14).Neuberger G, Bacher A. Biosynthesis of Riboflavin. Enzymatic Formation of 6,7-Dimethyl-8-ribityllumazine by Heavy Riboflavin Synthase from Bacillus subtilis. Biochem. Biophys. Res. Commun. 1986;139:1111–1116. doi: 10.1016/s0006-291x(86)80292-3. [DOI] [PubMed] [Google Scholar]
- (15).Kis K, Volk R, Bacher A. Biosynthesis of Riboflavin. Studies on the Reaction Mechanism of 6,7-Dimethyl-8-ribityllumazine Synthase. Biochemistry. 1995;34:2883–2892. doi: 10.1021/bi00009a019. [DOI] [PubMed] [Google Scholar]
- (16).Bacher A, Eberhardt S, Richter G. Biosynthesis of Riboflavin. In: Neidhardt FC, editor. Escherichia coli and Salmonella: Cellular and Molecular Biology. ASM Press; Washington, D. C.: 1996. pp. 657–664. [Google Scholar]
- (17).Gerhardt S, Schott A-K, Kairies N, Cushman M, Illarionov B, Eisenreich W, Bacher A, Huber R, Steinbacher S, Fischer M. Studies on the Reaction Mechanism of Riboflavin Synthase. X-Ray Crystal Structure of an Enzyme Complex with 6-Carboxyethyl-7-oxo-8-ribityllumazine. Structure. 2002;10:1371–1381. doi: 10.1016/s0969-2126(02)00864-x. [DOI] [PubMed] [Google Scholar]
- (18).Illarionov B, Eisenreich W, Bacher A. A Pentacyclic Reaction Intermediate of Riboflavin Synthase. Proc. Natl. Acad. Sci. U.S.A. 2001;98:7224–7229. doi: 10.1073/pnas.131610698. [DOI] [PMC free article] [PubMed] [Google Scholar]
- (19).Illarionov B, Kemter K, Eberhardt S, Richter G, Cushman M, Bacher A. Riboflavin Synthase of Escherichia coli. Effect of Single Amino Acid Substitutions on Reaction Rate and Ligand Binding Properties. J. Biol. Chem. 2001;276:11524–11530. doi: 10.1074/jbc.M008931200. [DOI] [PubMed] [Google Scholar]
- (20).Plaut GWE, Harvey RA. The Enzymatic Synthesis of Riboflavin. Methods Enzymol. 1971;18B:515–538. [Google Scholar]
- (21).Volk R, Bacher A. Biosynthesis of Riboflavin. The Structure of the Four-carbon Precursor. J. Am. Chem. Soc. 1988;110:3651–3653. [Google Scholar]
- (22).Meining W, Mörtl S, Fischer M, Cushman M, Bacher A, Ladenstein R. The Atomic Structure of Pentameric Lumazine Synthase from Saccharomyces cerevisiae at 1.85 Å Resolution Reveals the Binding Mode of a Phosphonate Intermediate Analogue. J. Mol. Biol. 2000;299:181–197. doi: 10.1006/jmbi.2000.3742. [DOI] [PubMed] [Google Scholar]
- (23).Zhang X, Meining W, Cushman M, Haase I, Fischer M, Bacher A, Ladenstein R. A Structure-based Model of the Reaction Catalyzed by Lumazine Synthase from Aquifex aeolicus. J. Mol. Biol. 2003;328:167–182. doi: 10.1016/s0022-2836(03)00186-4. [DOI] [PubMed] [Google Scholar]
- (24).Fischer M, Haase I, Kis K, Meining W, Ladenstein R, Cushman M, Schramek N, Huber R, Bacher A. Enzyme Catalysis via Control of Activation Entropy: Site-directed Mutagensesis of 6,7-Dimethyl-8-ribityllumazine Synthase. J. Mol. Biol. 2003;326:783–793. doi: 10.1016/s0022-2836(02)01473-0. [DOI] [PubMed] [Google Scholar]
- (25).Zhang YL, Illarionov B, Morgunova E, Jin GY, Bacher A, Fischer M, Ladenstein R, Cushman M. N-[2,4-dioxo-6-D-ribitylamino-1,2,3,4-tetrahydropyrimidin-5-yl]oxalamic Acid Derivatives as Inhibitors of Lumazine Synthase and Riboflavin Synthase: Design, Synthesis, Biochemical Evaluation, Crystallography, and Mechanistic Implications. J. Org. Chem. 2008;73:2715–2724. doi: 10.1021/jo702631a. [DOI] [PubMed] [Google Scholar]
- (26).Cushman M, Mihalic JT, Kis K, Bacher A. Design, Synthesis, and Biological Evaluation of Homologous Phosphonic Acids and Sulfonic Acids as Inhibitors of Lumazine Synthase. J. Org. Chem. 1999;64:3838–3845. [Google Scholar]
- (27).Gullion T, Schaefer J. Rotational-Echo Double-Resonance NMR. J. Magn. Res. 1989;81:196–200. doi: 10.1016/j.jmr.2011.09.003. [DOI] [PubMed] [Google Scholar]
- (28).Gullion T, Schaefer J. Detection of Weak Heteronuclear Dipolar Coupling by Rotational-Echo Double-Resonance Nuclear Magnetic Resonance. Adv. Magn. Res. 1989;13:57–81. [Google Scholar]
- (29).Wang J, Balazs YS, Thompson LK. Solid-State REDOR NMR Distance Measurements at the Ligand Site of a Bacterial Chemotaxis Membrane Receptor. Biochemistry. 1997;36:1699–1703. doi: 10.1021/bi962578k. [DOI] [PubMed] [Google Scholar]
- (30).Garbow JR, Breslav M, Antohi O, Naider F. Conformational Analysis of the Saccharomyces cerevisiae Tridecapeptide Mating Pheromone by 13C15N Rotational-Echo Double Resonance Nuclear Magnetic Resonance Spectroscopy. Biochemistry. 1994;33:10094–10099. doi: 10.1021/bi00199a037. [DOI] [PubMed] [Google Scholar]
- (31).Li Y, Appleyard RJ, Shuttleworth WA, Evans JNS. Time-Resolved Solid-State NMR Measurements on 5-Enolpyruvylshikimate 3-Phosphate Synthase. J. Am. Chem. Soc. 1994;116:10799–10800. doi: 10.1021/bi00188a009. [DOI] [PubMed] [Google Scholar]
- (32).Goetz JM, Poliks B, Studelska DR, Fischer M, Kugelbrey K, Bacher A, Cushman M, Schaefer J. Investigation of the Binding of Fluorolumazines to the 1-MDa Capsid of Lumazine Synthase by 15N{19F} REDOR NMR. J. Am. Chem. Soc. 1999;121:7500–7508. [Google Scholar]
- (33).Michal CA, Jelinski LW. Rotational-Echo Double-Resonance in Complex Biopolymers: A Study of Nephila clavipes Dragline Silk. J. Biomol. NMR. 1998;12:231–241. doi: 10.1023/a:1008286004222. [DOI] [PubMed] [Google Scholar]
- (34).Hing AW, Tjandra N, Cottam RF, Schaefer J, Ho C. An Investigation of the Ligand-Binding Protein of Escherichia coli Using Rotational-Echo Double-Resonance NMR. Biochemistry. 1994;33:8651–8661. doi: 10.1021/bi00195a005. [DOI] [PubMed] [Google Scholar]
- (35).McDowell LM, Poliks B, Studelska DR, D. OCR, Beusen DD, Schaefer J. Rotational-Echo Double-Resonance NMR-Restrained Model of the Ternary Complex of 5-Enolpyruvylshikimate-3-phosphate Synthase. J. Bio. NMR. 2004;28:11–29. doi: 10.1023/B:JNMR.0000012864.70184.48. [DOI] [PubMed] [Google Scholar]
- (36).Mörtl S, Fischer M, Richter G, Tack J, Weinkauf S, Bacher A. Biosynthesis of Riboflavin - Lumazine Synthase of Escherichia Coli. J. Biol. Chem. 1996;271:33201–33207. doi: 10.1074/jbc.271.52.33201. [DOI] [PubMed] [Google Scholar]
- (37).Jayaraman M, Fox BM, Hollingshead M, Kohlhagen G, Pommier Y, Cushman M. Synthesis of New Dihydroindeno[1,2-c]isoquinoline and Indenoisoquinolinium Chloride Topoisomerase I Inhibitors Having High in Vivo Anticancer Activity in the Hollow Fiber Animal Model. J. Med. Chem. 2002;45:242–249. doi: 10.1021/jm000498f. [DOI] [PubMed] [Google Scholar]
- (38).Morris G, Goodsell D, Halliday R, Huey R, Hart W, Belew R, Olson A. Automated Docking using Lamarckian Genetic Algorithm and an Empirical Binding Free Energy Function. J. Comp. Chem. 1998;19:1639–1662. [Google Scholar]
- (39).Gasteiger J, Marsili M. Iterative Partial Equalization of Orbital Electronegativity—a Rapid Access to Atomic Charges. Tetrahderon. 1980;36:3219–3228. [Google Scholar]
- (40).Jorgensen W, Chandrasekhar J, Madura J, Impey R, Klein M. Comparison of Simple Potential Functions for Simulating Liquid Water. J. Chem. Phys. 1983;79:926–935. [Google Scholar]
- (41).Singh C, Kollman P. An Approach to Computing Electrostatic Charges of Molecules. J. Comut. Chem. 1984;5:129–145. [Google Scholar]
- (42).McDowell LM, Studelska DR, Poliks B, O'Connor RD, Schaefer J. Characterization of the Complex of a Trifluoromethyl-substituted Shikimate-based Bisubstrate Inhibitor and 5-Enolpyruvylshikimate-3-phosphate Synthase by REDOR NMR. Biochemistry. 2004;43:6606–6611. doi: 10.1021/bi049685w. [DOI] [PubMed] [Google Scholar]


