

Abstract
Objective: The potential differential contributions of skeletal muscle and adipose tissue to whole body insulin resistance were evaluated in subjects with polycystic ovary syndrome (PCOS).
Research Design and Methods: Forty-two PCOS subjects and 15 body mass index-matched control subjects were studied. Insulin action was evaluated by the hyperinsulinemic/euglycemic clamp procedure. Isolated adipocytes and cultured muscle cells were analyzed for glucose transport activity; adipocytes, muscle tissue, and myotubes were analyzed for the expression and phosphorylation of insulin-signaling proteins.
Results: Fifty-seven per cent of the PCOS subjects had impaired glucose tolerance and the lowest rate of maximal insulin-stimulated whole body glucose disposal compared to controls (P < 0.01). PCOS subjects with normal glucose tolerance had intermediate reduction in glucose disposal rate (P < 0.05 vs. both control and impaired glucose tolerance subjects). However, rates of maximal insulin-stimulated glucose transport (insulin responsiveness) into isolated adipocytes were comparable between all three groups, whereas PCOS subjects displayed impaired insulin sensitivity. In contrast, myotubes from PCOS subjects displayed reduced insulin responsiveness for glucose uptake and normal sensitivity. There were no differences between groups in the expression of glucose transporter 4 or insulin-signaling proteins or maximal insulin stimulation of phosphorylation of Akt in skeletal muscle, myotubes, or adipocytes.
Conclusions: Individuals with PCOS display impaired insulin responsiveness in skeletal muscle and myotubes, whereas isolated adipocytes display impaired insulin sensitivity but normal responsiveness. Skeletal muscle and adipose tissue contribute differently to insulin resistance in PCOS. Insulin resistance in PCOS cannot be accounted for by differences in the expression of selected signaling molecules or maximal phosphorylation of Akt.
Insulin resistance in polycystic ovary syndrome involves unique contributions from adipocytes (impaired sensitivity) and skeletal muscle (impaired responsiveness) as well as communication between tissues.
Polycystic ovary syndrome (PCOS) is a common endocrine disorder, afflicting 3–8% of women, that represents a major cause of infertility (1). PCOS has a metabolic impact because many women with PCOS display an increased incidence of type 2 diabetes (2,3). Even in the absence of diabetes, glucose intolerance or insulin resistance, independent of but exacerbated by obesity (4), are common occurrences in PCOS (5,6,7). Insulin resistance in PCOS presents as normal fasting glucose levels, sustained by hyperinsulinemia. Such behavior is suggestive of reduced insulin sensitivity. Studies that employ the hyperinsulinemic/euglycemic clamp technique, which predominantly measures insulin action in skeletal muscle, have demonstrated reductions in both the sensitivity and responsiveness to insulin in PCOS (8).
Potential mechanisms of this insulin resistance have been investigated in skeletal muscle and adipose tissue. Although there is some disagreement about the maximal insulin responsiveness of glucose transport in adipocytes from PCOS subjects (8,9,10), the common observation is that insulin sensitivity is reduced (9,11). This reduced sensitivity was observed in the presence of normal insulin receptor occupancy (8,9), suggesting impaired efficiency of insulin signaling (9,12). Knowledge of the mechanisms of impaired insulin signaling in PCOS subjects is limited, with modest differences from control subjects noted at the level of adipocyte insulin receptor tyrosine kinase activity (9) and skeletal muscle insulin receptor substrate-1 (IRS-1) associated phosphatidylinositol 3-kinase (PI3-K) (12) activity. The current report investigated the expression and function of insulin-signaling molecules in isolated adipocytes and skeletal muscle from PCOS subjects of varying insulin sensitivities to evaluate possible tissue differences in insulin action. Muscle cells were also cultured to study features of insulin action that may be intrinsic to PCOS.
Subjects and Methods
Subjects
Normal cycling (control) nondiabetic, nonhirsute female subjects were screened by medical history, physical examination, and laboratory evaluation. Nondiabetic PCOS subjects were recruited. The diagnosis of PCOS was based on the following criteria recommended by the 1990 National Institutes of Health Conference on PCOS (13): 1) evidence of chronic anovulation or oligoamenorrhea; 2) clinical or biochemical evidence of hyperandrogenism; and 3) exclusion of pregnancy, thyroid disease, prolactinoma, Cushing’s syndrome, and late-onset nonclassic congenital hyperplasia. None of the subjects had taken oral contraceptives, glucocorticoids, antiandrogens, ovulation-inducing agents, or antidiabetic or antiobesity medications in the 2 months before screening. All procedures were performed in the early or midfollicular phase (d 2–8) of the subjects’ menstrual cycle, except in those subjects who did not have regular menses. The experimental protocol was approved by the Human Research Protection Program of the University of California, San Diego. Informed written consent was obtained from all subjects after explanation of the protocol.
Materials
Human biosynthetic insulin was supplied by Eli Lilly, Inc. (Indianapolis, IN). Collagenase was from Worthington (Freehold, NJ). BSA was from Roche Diagnostic Corp. (Indianapolis, IN). Cell culture materials were purchased from Irvine Scientific (Irvine, CA), except for skeletal muscle basal medium (Lonza, Walkersville, MD). [3H] 3-O-methylglucose (3-OMG) and [3H] 2-deoxyglucose were obtained from Perkin-Elmer (Boston, MA). Antibodies were obtained from the following sources: sarcomeric α-actin (Sigma, St. Louis, MO); myosin heavy chain (Chemicon, Temecula, CA); glucose transporter 4 (GLUT 4) (Biogenesis, Kingston, NH); pS473-and pT308-Akt (New England Biolabs, Beverly, MA); IRS-1, protein kinase C (PKC) ζ, and cbl associated protein (CAP) (Upstate Biotechnology Inc., Charlottesville, VA); Akt 1/2 (Santa Cruz Biotechnology, Santa Cruz, CA); and cbl (BD Transduction Labs, San Diego, CA). Horseradish peroxidase-conjugated antimouse and antirabbit IgGs were from Santa Cruz Biotechnology, and SuperSignal enhanced chemiluminescence substrate was from Pierce (Rockford, IL). Electrophoresis reagents were from Bio-Rad (Richmond, CA) or Invitrogen (Carlsbad, CA).
In vivo evaluation of glucose tolerance and insulin action
All studies were performed after a 12- to 14-h overnight fast. Glucose tolerance was determined in all subjects at 2 h after a 75-g oral glucose tolerance test. Maximal insulin action was measured by a 3-h hyperinsulinemic (300 mU/m2 · min) euglycemic (5.0–5.5 mmol/liter) clamp; the glucose disposal rate (GDR) was measured during the last 30 min of the clamp (14). Percutaneous needle biopsies of vastus lateralis muscle were performed before and after 3 h of insulin infusion (14), and muscle tissue was either immediately frozen in liquid nitrogen or processed for culture.
Adipose tissue biopsy and preparation of human adipocytes
Adipose tissue was obtained in the fasting state by biopsy of the lower sc abdominal depot. Isolated adipocytes were prepared by a modification (15) of the method of Rodbell (16). Cells were fixed in 2% osmium tetroxide and counted with a Multisizer 2 (Beckman Coulter, Fullerton, CA) fitted with a 400-μm aperture tube (17). Osmium fixed adipocytes were sized manually using a light microscope with a calibrated ocular scale or with the sizing function of the Multisizer.
Adipocyte 3-OMG transport
Adipocytes (∼4–5 × 10⁵ cells/ml) were incubated for 60 min at 37 C in the absence or presence of insulin (0.17 or 8.5 nm). Transport activity was assessed by measuring initial rates of the uptake of 3-OMG (15–20 μm) as described previously (18).
Skeletal muscle cell culture
The methods for muscle cell isolation from freshly biopsied tissue and cell growth have been described previously (19). At 80–90% confluency, cells were fused for 4 d in α-MEM containing 2% fetal bovine serum, 100 U/ml penicillin, and 100 μg/ml streptomycin. Within 4 d, approximately 90% of the cells take on the multinucleated morphology characteristic of differentiated myotubes (19).
Glucose uptake assay
Cells were washed in serum-free medium and incubated with or without insulin (0–33 nm) for 90 min at 37 C in a 5% CO2 incubator. Uptake of the nonmetabolized analog 2-deoxyglucose (final concentration = 0.01 mm) was measured in triplicate over 10 min at room temperature (20). An aliquot of the suspension was removed for protein analysis. The uptake of l-glucose is used to correct for the contribution of diffusion.
Protein extraction
Fifty to 100 mg of muscle tissue was homogenized using a polytron at half maximum speed for 1 min on ice in 500 μl of 1X solubilization buffer (20). Tissue lysates were solubilized for 30 min at 4 C with vortexing and centrifuged for 10 min at 14,000 × g. The supernatants were stored at −70 C. Muscle cells were washed in serum free α-MEM containing 0.1% BSA and incubated for 15 min at 37 C in the presence or absence of insulin (33 nm). After this treatment, separate samples of cells were rapidly washed with 4 C PBS and then lysed in extraction buffer (20). Protein concentration was determined according to the method of Bradford (21), and extracts were stored at −70 C.
Electrophoresis and Western blotting
Procedures for the electrophoresis, transfer, and Western blotting of proteins are similar to standard methods. Detection was by enhanced chemiluminescence, followed by densitometric analysis. Quantification of band intensity was performed using Alpha Innotech ChemiImager 4000 v.4.04 software (Alpha Innotech Corporation, San Leandro, CA). For analysis of protein phosphorylation, membranes were probed first with a phosphospecific antibody, then stripped and reprobed with antibody against the total protein.
Statistical analysis
Statistical analysis was performed using the Prism v4.0 program (GraphPad, San Diego, CA). Statistical significance was evaluated with Student’s t test and repeated measures ANOVA. Data are presented as mean ± sem. Significance was accepted at P < 0.05. Because of limitations in tissue and cell availability, not all analyses could be performed in all subjects. The number of subjects studied for each analysis is given in the figure legends. Clinical characteristics of the subsets of subjects studied in the different experiments did not differ from the average of the total group.
Results
Subjects
Clinical characteristics of the subjects are summarized in Table 1. Because the PCOS subjects were predominantly either overweight [body mass index (BMI) >27 kg/m2 in five of 42] or obese (BMI >30 kg/m2 in 32 of 42), normal ovulatory control subjects were recruited to be BMI-matched to the PCOS subjects. Although control women were slightly older, there were no associations between age and the metabolic endpoints measured in this study. Twenty-four of the PCOS subjects satisfied the American Diabetes Association criteria (22) for the diagnosis of impaired glucose tolerance (IGT). Although there was metabolic heterogeneity in the PCOS subjects, the IGT and normal glucose tolerant (NGT) subjects were comparable with regard to multiple measures of androgen status (Table 1). The distribution between ethnic groups was similar in the control and PCOS subjects (data not shown).
Table 1.
Clinical characteristics of subjects
| Control (n = 15) | PCOS
|
|||
|---|---|---|---|---|
| Combined | NGT (n = 18) | IGT (n = 24) | ||
| Age (yr) | 32 ± 1 | 29 ± 1a | 29 ± 1a | 29 ± 1a |
| BMI (kg/m2) | 33.9 ± 1.8 | 35.4 ± 1.1 | 33.7 ± 1.6 | 36.7 ± 1.4 |
| HbA1c (%) | 5.4 ± 0.1 | 5.3 ± 0.1 | 5.3 ± 0.1 | 5.7 ± 0.2 |
| Fasting glucose (mg/dl) | 92 ± 2 | 94 ± 2 | 90 ± 2 | 95 ± 4 |
| Fasting insulin (μU/ml) | 14.2 ± 4.8 | 27.3 ± 2.8a | 21.2 ± 2.2 | 31.8 ± 4.2a,b |
| 2-h glucose (mg/dl) | 119 ± 4 | 153 ± 5a | 115 ± 4 | 180 ± 5a,b |
| F-G score | 2.2 ± 0.6 | 14 ± 1a | 13 ± 2a | 14 ± 2a |
| Total T (ng/ml) | 0.25 ± 0.04 | 0.55 ± 0.05a | 0.58 ± 0.07a | 0.53 ± 0.08 |
| DHEA-S (ng/ml) | 145 ± 24 | 248 ± 19a | 248 ± 28a | 248 ± 26a |
| SHBG (nmol/liter) | 17.6 ± 3.6 | 17.5 ± 1.9 | 18.1 ± 3.9 | 17.3 ± 2.4 |
Results are presented as average ± sem. To convert to SI units, multiply by the following conversion factor: 0.05551 for glucose, 7.175 for insulin, 3.47 for testosterone, 0.0027 for DHEA-S. HbA1c, Glycosylated hemoglobin; F-G score, Ferman-Galloway score; T, testosterone; DHEA-S, dehydroepiandrosterone sulfate.
P < 0.05 vs. control.
P < 0.05 NGT vs. IGT.
Whole body insulin action
The metabolic heterogeneity of the PCOS subjects was present at the level of whole body insulin action, which, at the maximal insulin infusion rate employed here, is primarily reflective of the behavior of skeletal muscle. Although when combined the maximal insulin-stimulated GDRs for the PCOS subjects were significantly lower than those of control subjects, the subgroup with IGT displayed the most severe insulin resistance (Fig. 1). The NGT-PCOS subjects were intermediate. Variations in insulin sensitivities were also observed at fasting insulin levels because the homeostasis model assessment of insulin resistance (HOMA-IR) index was elevated in the NGT subgroup (2.59 ± 0.48 vs. 5.26 ± 0.51, P < 0.01), and even higher in the IGT subjects (7.71 ± 0.85; P < 0.0001 vs. control, <0.025 vs. NGT).
Figure 1.
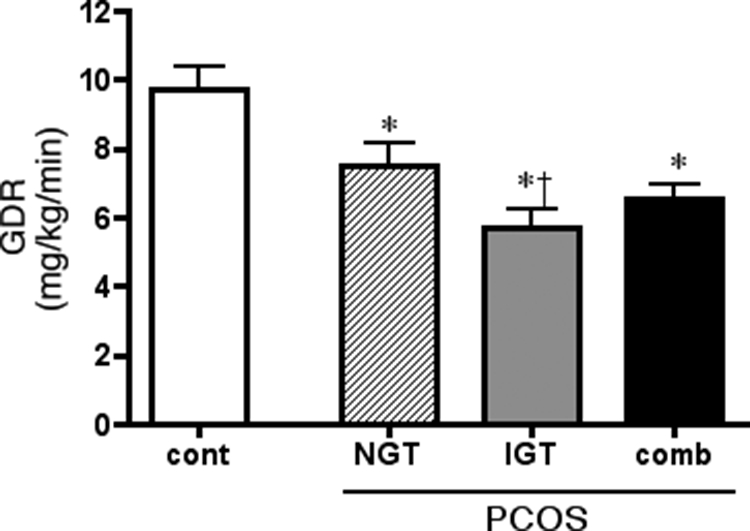
Maximally insulin-stimulated whole body glucose disposal in normal cycling control (cont) and PCOS (NGT and IGT) subjects as determined from the hyperinsulinemic/euglycemic clamp procedure. Results are average + sem; number of subjects is given in Table 1. comb, Combined results for NGT and IGT subgroups. *, P < 0.0001 vs. control; †, P < 0.01 IGT vs. NGT.
Adipocyte glucose transport
Initial rates of glucose transport were measured in freshly isolated adipocytes (Fig. 2). Unlike the situation in vivo, absolute transport activities did not differ between groups, in either the absence or presence of a maximally stimulating insulin concentration (Fig. 2A). These results were the same whether normalized to cell number or to cell surface area. Average adipocyte sizes were similar in the three groups: control, 1050 ± 127 pl/cell; NGT, 925 ± 84 pl/cell; IGT, 980 ± 51 pl/cell. However, differences between control and PCOS groups were observed at a submaximal insulin level (Fig. 2B). In control adipocytes, 0.17 nm insulin attained approximately 50% of the maximal insulin effect, whereas in PCOS adipocytes the same insulin concentration was able to reach only 15–20% of the final effect. There was no difference between NGT and IGT groups for these measures of adipocyte insulin sensitivity and responsiveness (Fig. 2), although they differed at the level of insulin-stimulated whole body glucose disposal (Fig. 1).
Figure 2.

Glucose transport in adipocytes isolated from control (cont) and PCOS subjects. A, Absolute rates of 3-OMG transport in the absence (open bars) and presence (solid bars) of a maximally stimulating (8.5 nm) concentration of insulin. B, Insulin sensitivity. Results are presented as percentage of the maximal insulin effect attained in each individual’s cells at a submaximal (0.17 nm) insulin level. Results are average + sem; n = 8 for control, n = 10 for NGT, and n = 16 for IGT. *, P < 0.05 vs. paired basal; †, P < 0.05 vs. control.
Skeletal muscle phenotype
To understand further the contribution of skeletal muscle to the impaired insulin-stimulated whole body glucose disposal in PCOS, skeletal muscle cells were studied in culture under controlled conditions. There were no differences between myotubes from control and PCOS subjects for the expression of markers of the muscle phenotype (α-actin) and fiber type (slow isoform of myosin heavy chain) (data not shown). There were also no differences between the NGT-PCOS and IGT-PCOS subgroups for the expression of either protein.
Glucose uptake
In contrast to differences in whole body insulin action (HOMA-IR and GDR), glucose uptake into myotubes was comparable in cells from NGT-PCOS and IGT-PCOS subjects in either the absence (P = 0.81) or presence (P = 0.80) of a maximally stimulating insulin concentration. When the data for all PCOS subjects were pooled, basal and insulin-stimulated glucose uptake into muscle cells were each reduced by approximately 50% compared with the control (Fig. 3), which reflected the difference seen in vivo for insulin-stimulated whole body glucose disposal (Fig. 1). Insulin dose-response curves from control and PCOS cells, normalized to the maximal effect for each individual set of cells, were superimposable (Fig. 3B). This impaired insulin responsiveness together with normal insulin sensitivity in cultured PCOS muscle cells contrasts with the normal responsiveness and impaired sensitivity for glucose transport stimulation seen in freshly isolated adipocytes (Fig. 2).
Figure 3.
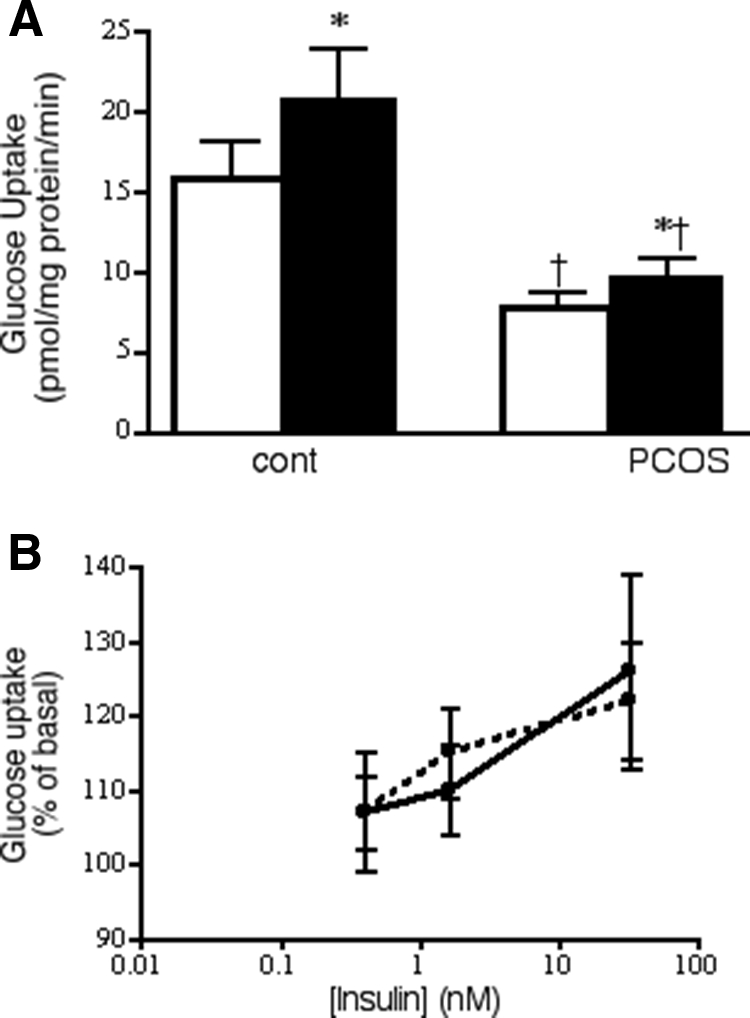
Insulin action on glucose uptake in cultured myotubes from control (cont) and PCOS (combined) subjects. A, Absolute values of basal and maximal insulin (33 nm) stimulated glucose uptake. Results represent average + sem; normal, n = 8; PCOS, n = 24. B, Insulin dose-response curves. Results were normalized to maximal effect attained in each individual set of cells. Control, Open symbols, solid line; PCOS, solid symbols, broken line. Results are average ± sem; n = 8 for both control and PCOS. *, P < 0.05 vs. paired basal; †, P < 0.05 vs. control in the same condition.
Glucose transporter expression
In PCOS subjects, the impaired maximally insulin-stimulated whole body glucose disposal (Fig. 1) was not reflected in the expression of GLUT4, the insulin-responsive transporter protein, in skeletal muscle, which did not differ between groups (see supplemental data, Fig. 1, published on The Endocrine Society’s Journals Online web site at http://jcem.endojournals.org). The same was true in cultured muscle cells, despite reduced insulin-stimulated glucose uptake activity in PCOS cells. In isolated adipocytes, there was an agreement between total GLUT4 protein expression and maximally insulin-stimulated glucose transport activity. Total protein expression of GLUT4 did not differ between the NGT and IGT subgroups in any of the tissues or cells studied.
Insulin signaling
Insulin signaling to acute stimulation of glucose transport is proposed to occur through two pathways. Most extensively studied is the “classic” route linking the insulin receptor to IRS-1, PI3-K and Akt, with atypical PKCs representing a branch path (23). An alternative signaling cascade involving the scaffolding proteins CAP and cbl and leading to activation of small G proteins has been identified (24). The expression of key proteins involved in these two pathways was evaluated in skeletal muscle tissue and myotubes as well as isolated adipocytes. Samples were obtained in the fasting (muscle tissue) or basal (myotubes and adipocytes) state. In adipocytes, skeletal muscle tissue, or muscle cells, there were no differences between any of the groups with regard to the protein expression of IRS-1, Akt 1/2, PKCζ, CAP, or cbl (supplemental data, Fig. 2).
Insulin-induced phosphorylation of Akt is an important step in mediating the stimulation of glucose transport (25). The insulin concentration that was maximally stimulating for glucose transport (8.5 nm) resulted in a large increase in phosphorylation of S473-Akt in adipocytes (Fig. 4A) that was similar across groups, in agreement with the glucose transport response. The extent of insulin stimulation of S473-Akt in skeletal muscle, determined at the end of the clamp procedure, was similar in the control and PCOS groups (Fig. 4A), even as GDR was reduced in PCOS (Fig. 1). The same behavior, no differences between groups, was observed in myotubes (Fig. 4A). Akt serine phosphorylation was similar between the NGT and IGT subgroups (data not shown).
Figure 4.

Insulin stimulation of Akt phosphorylation. Adipocyte and muscle cell proteins extracted after 15-min incubation in the absence (open bars) or presence (solid bars) of insulin. Muscle tissue collected before and after 3-h insulin infusion. Phosphorylation of pS473-Akt (A) or pT308-Akt (B) was determined by Western blotting. Blots were stripped and reprobed for Akt-1/2. Basal and maximal insulin (33 nm) stimulated phosphorylation, results were normalized against the amount of Akt for each individual and condition. Results represent average + sem. For pS-Akt: isolated adipocytes, n = 11 for control, 21 for PCOS; skeletal muscle, n = 9 and 22; muscle cells, n = 6 and 13. For pT-Akt: adipocytes, n = 8 and 17; muscle tissue, n = 9 and 17; myocytes, n = 6 and 17. *, P < 0.05 vs. basal.
Similar behavior was observed for T308 phosphorylation of Akt. There were no differences in basal T308-Akt phosphorylation between control and PCOS subjects in adipocytes, skeletal muscle, and muscle cells (Fig. 4B). Insulin-stimulated p T308-Akt was comparable between control and PCOS subjects in the cells and tissues studied (Fig. 4B).
Discussion
Metabolic heterogeneity for the extent of glucose intolerance and insulin resistance is common in PCOS. Although our NGT-PCOS and IGT-PCOS subgroups were similar with regard to reproductive hormones, they could be differentiated by accepted measures of insulin action, the hyperinsulinemic/euglycemic clamp, and the HOMA-IR index. Alternatively, multiple metabolic phenotypes of PCOS may also be discriminated, at least in part, by the degree of hyperandrogenemia (26). The findings of the current study would be most representative of those with moderate hyperandrogenemia compared with others that have included greater degrees of excess androgen production (12,27,28). That insulin resistance was seen at both low (HOMA-IR) and high (GDR) insulin levels suggests that our PCOS population expresses impairments in both insulin sensitivity and insulin responsiveness.
The goal of the present studies was to investigate potential sites of insulin resistance in PCOS through systematic evaluation of insulin action in major target tissues, adipocytes, and skeletal muscle. The current finding of impaired insulin sensitivity but normal insulin responsiveness for stimulation of glucose transport in adipocytes from PCOS subjects is in agreement with our previous work (9) and partially with that of others; impaired sensitivity is a common observation (8,10). There are several interesting aspects of these results in adipocytes. One is that impaired sensitivity is a shared feature of insulin action in both the whole body and adipocytes, whereas responsiveness in adipocytes from these subjects does not reflect maximal insulin action in the whole body. The second point is that the metabolic heterogeneity between PCOS-NGT and IGT subjects seen in vivo for HOMA-IR and GDR is lost when studied ex vivo.
To understand more about insulin action in skeletal muscle, we studied skeletal muscle cells grown in culture and differentiated into myotubes. We, and others, have demonstrated that myotubes retain many of the phenotypic, morphological, and metabolic properties of skeletal muscle from the donor subjects, including impairments in glucose metabolism (29) and insulin action (20,30) in myotubes from type 2 diabetic subjects. We found that myotubes from PCOS subjects displayed defects in maximally insulin-stimulated glucose uptake that were reflective of insulin-stimulated whole body glucose disposal, which is predominately into skeletal muscle (31). Impairments in insulin responsiveness for glucose uptake appear to be an intrinsic property of skeletal muscle in PCOS because myotubes were cultured for an extended time removed from the hyperinsulinemic, hyperandrogenic environment present in vivo. On the other hand, insulin action in PCOS myotubes differs in two ways from what was seen in the intact subject. One is that insulin sensitivity was comparable between PCOS and controls. The other was that, just as was seen in adipocytes, differences between NGT and IGT subjects present in vivo were no longer apparent. One difference between NGT-PCOS and IGT-PCOS subjects lost in vitro is the postprandial hyperglycemia of IGT; hyperglycemia has been shown to impair insulin action in myotubes (20). In contrast, Corbould et al. (27) reported that glucose uptake was higher in myotubes from PCOS subjects. One possible explanation for this difference is that, whereas we found a similar extent of differentiation in control and PCOS cells, Corbould et al. (27) reported significantly higher expression of markers of the mature muscle phenotype in PCOS muscle cells. Differences in the extent of differentiation could complicate comparisons of insulin action.
The impaired insulin responsiveness of glucose uptake seen both in the whole body and cultured muscle cells occurred in the presence of normal total cell or skeletal muscle tissue content of GLUT4 protein, in agreement with a recent observation in muscle tissue (32). The normal adipocyte content of GLUT4 in PCOS subjects is consistent with the normal insulin responsiveness for glucose transport but does not explain the impaired sensitivity. It appears that the distinct forms of insulin resistance in skeletal muscle and adipocytes have a common root, impairments in the efficiency of insulin signaling. Tissue specificity/differences in insulin action could extend to the ovary and the debate over ovarian hypersensitivity or resistance to insulin (33,34).
The acute actions of insulin to regulate glucose metabolism are propagated through several pathways (23). In sc PCOS adipocytes, IRS-1 protein expression was reported to be either normal or slightly reduced (35), just as we found. We also found no differences in IRS-1 and Akt 1/2 protein expression in muscle tissue and myotubes, which is in agreement with other reports (12,27,32,36). The same was true for the other proteins investigated in the PI3-K/Akt pathway, some of which have not been reported on previously in PCOS in either skeletal muscle or adipocytes. Little is known about the function and regulation of the CAP/cbl pathway in human tissues, but we found that their protein expression did not vary between groups in either adipocytes or skeletal muscle tissue/cells. Thus, the evidence suggests that insulin resistance in PCOS is not accompanied by major changes in the expression of proteins involved in insulin-signaling pathways in either skeletal muscle or adipocytes.
Given the lack of differences in insulin-signaling protein expression, the activities of these proteins become important. We previously reported a modest reduction in the tyrosine kinase activity of the adipocyte insulin receptor in PCOS subjects. However, this difference could not account for the altered impaired insulin sensitivity of the subjects (9). The current results indicate that more downstream events, insulin stimulation of S473 and T308 phosphorylation in Akt, are intact. The shortcoming of this observation is that the measurement was made at a maximal insulin concentration where the glucose transport response in adipocytes was normal, and not at a submaximal level where impaired sensitivity was apparent. The importance of this point is emphasized by the fact that, whereas we found S473 and T308 phosphorylation of Akt in skeletal muscle and muscle cells after insulin treatment to be normal in PCOS subjects, Hojlund et al. (32) saw reduced insulin-stimulated phosphorylation of Akt. The steady-state insulin level attained by these investigators (∼400 pm) was lower than that reached from the insulin infusion rate we employed (∼7000 pm). Taken together, the two reports reveal impaired insulin sensitivity but normal responsiveness for Akt phosphorylation in PCOS muscle. Yet defects in insulin signaling at Akt can only account for a portion of whole body insulin resistance in PCOS because impaired glucose uptake responsiveness is present even as maximally stimulated Akt phosphorylation is normal, both in vivo and in vitro. Another potential candidate is PKCζ, whose insulin-stimulated phosphorylation is impaired after chronic testosterone exposure (37).
By studying skeletal muscle in vivo and in cultured cells, we were able to see that impaired sensitivity for glucose disposal is apparent only in the whole body context and is not intrinsic to PCOS muscle. The reduced sensitivity in adipocytes may be an acquired feature because it is not present in preadipocytes (28) and can be reversed by overnight culture under controlled conditions (38).
An exciting advance in the understanding of metabolic regulation has been the establishment of the adipocyte as an active secretory cell (39). Many of the factors released from adipocytes, termed adipokines, have been shown to influence insulin action in multiple tissues, in either a positive [adiponectin (40) and adenosine (41,42,43)] or negative [TNFα (44)] manner. The fact that abnormal insulin sensitivity in adipocytes from PCOS subjects can be reversed under acute conditions by addition of a nonmetabolized adenosine analog (45) supports an important role of adipocyte-secreted factors. In addition, circulating levels and adipocyte content of adiponectin are reduced in subjects with PCOS in association with the extent of their insulin resistance (46). Conversely, TNFα (44) levels are elevated in PCOS subjects. The current findings, made at both the whole body and isolated cell level, suggest that insulin resistance in PCOS results from the combined effects of specific defects in adipose tissue and skeletal muscle and that communication between multiple tissues may play an important role in modulating this insulin resistance. This could include alterations in the secretion of insulin-sensitizing factors by the adipocyte.
Supplementary Material
Acknowledgments
We thank Paivi Burke, Leslie Carter, and Theo Lee for excellent technical assistance.
Footnotes
This work was supported by grants from the Medical Research Service, Department of Veterans Affairs, VA San Diego Healthcare System (to R.R.H.); the American Diabetes Association (to T.P.C. and R.R.H.); Takeda Pharmaceuticals North America (to R.R.H.); and Grant M01 RR-00827 in support of the General Clinical Research Center from the General Clinical Research Branch, Division of Research Sources, National Institutes of Health.
Current affiliation for V.A.: MedStar Research Institute, Washington, D.C.
Disclosure Statement: T.P.C., V.A., S.M., and R.J.C have nothing to declare. R.R.H. consults for and received lecture fees and grant support from Takeda Pharmaceuticals North America.
First Published Online October 14, 2008
Abbreviations: BMI, Body mass index; CAP, cbl associated protein; GDR, glucose disposal rate; GLUT4, glucose transporter 4; HOMA-IR, homeostasis model assessment of insulin resistance; IGT, impaired glucose tolerance; IRS-1, insulin receptor substrate-1; NGT, normal glucose tolerant; 3-OMG, 3-O-methylglucose; PCOS, polycystic ovary syndrome; PI3-K, phosphatidylinositol 3-kinase; PKC, protein kinase C.
References
- Azziz R, Woods KS, Reyna R, Key TJ, Knochenhauer ES, Yildiz BO 2004 The prevalence and features of the polycystic ovary syndrome in an unselected population. J Clin Endocrinol Metab 89:2745–2749 [DOI] [PubMed] [Google Scholar]
- Legro RS, Gnatuk CL, Kunselman AR, Dunaif A 2005 Changes in glucose tolerance over time in women with polycystic ovary syndrome: a controlled study. J Clin Endocrinol Metab 90:3236–3242 [DOI] [PubMed] [Google Scholar]
- Legro RS, Kunselman AR, Dodson WC, Dunaif A 1999 Prevalence and predictors of risk for type 2 diabetes mellitus and impaired glucose tolerance in polycystic ovary syndrome: a prospective, controlled study in 254 affected women. J Clin Endocrinol Metab 84:165–169 [DOI] [PubMed] [Google Scholar]
- Salehi M, Bravo-Vera R, Sheikh A, Gouller A, Poretsky L 2004 Pathogenesis of polycystic ovary syndrome: what is the role of obesity? Metabolism 53:358–376 [DOI] [PubMed] [Google Scholar]
- Apridonidze T, Essah PA, Iuorno MJ, Nestler JE 2005 Prevalence and characteristics of the metabolic syndrome in women with polycystic ovary syndrome. J Clin Endocrinol Metab 90:1929–1935 [DOI] [PubMed] [Google Scholar]
- Chang RJ, Nakamura RM, Judd HL, Kaplan SA 1983 Insulin resistance in nonobese patients with polycystic ovarian disease. J Clin Endocrinol Metab 57:356–359 [DOI] [PubMed] [Google Scholar]
- DeUgarte CM, Bartolucci AA, Azziz R 2005 Prevalence of insulin resistance in the polycystic ovary syndrome using the homeostasis model assessment. Fertil Steril 83:1454–1460 [DOI] [PubMed] [Google Scholar]
- Dunaif A, Segal KR, Shelly DR, Green G, Dobrjansky A, Licholai T 1992 Evidence for distinctive and intrinsic defects in insulin action in polycystic ovary syndrome. Diabetes 41:1257–1266 [DOI] [PubMed] [Google Scholar]
- Ciaraldi TP, El-Roeiy A, Madar Z, Reichart D, Olefsky JO, Yen SSC 1992 Cellular mechanisms of insulin resistance in polycystic ovarian syndrome. J Clin Endocrinol Metab 75:577–583 [DOI] [PubMed] [Google Scholar]
- Marsden PJ, Murdoch A, Taylor R 1994 Severe impairment of insulin action in adipocytes from amenorrheic subjects with polycystic ovary syndrome. Metabolism 43:1536–1542 [DOI] [PubMed] [Google Scholar]
- Marsden PJ, Murdoch AP, Taylor R 1999 Adipocyte insulin action following ovulation in polycystic ovarian syndrome. Hum Reprod 14:2216–2222 [DOI] [PubMed] [Google Scholar]
- Dunaif A, Wu XK, Lee A, Diamanti-Kandarakis E 2001 defects in insulin receptor signaling in vivo in the polycystic ovary syndrome (PCOS). Am J Physiol Endocrinol Metab 281:E392–E399 [DOI] [PubMed] [Google Scholar]
- Zawadzki J, Dunaif A 1992 Diagnostic criteria for polycystic ovary syndrome: towards a rational approach. In: Dunaif A, Givens JR, Haseltine F, eds. Polycystic ovary syndrome. Boston: Blackwell Scientific; 377–384 [Google Scholar]
- Thornburn AW, Gumbiner B, Bulacan F, Wallace P, Henry RR 1990 Intracellular glucose oxidation and glycogen synthase activity are reduced in non-insulin dependent (type II) diabetes independent of impaired glucose uptake. J Clin Invest 85:522–529 [DOI] [PMC free article] [PubMed] [Google Scholar]
- Ciaraldi TP, Kolterman OG, Olefsky JM 1981 Mechanism of the post-receptor defect in insulin action in human obesity: decrease in the intrinsic activity of the glucose transport system. J Clin Invest 68:875–880 [DOI] [PMC free article] [PubMed] [Google Scholar]
- Rodbell M 1964 Metabolism of isolated fat cells. I. Effects of hormones on glucose metabolism and lipolysis. J Biol Chem 239:375–380 [PubMed] [Google Scholar]
- Hirsch J, Gallian E 1968 Methods for the determination of adipose cell size in man and animals. J Lipid Res 9:110–119 [PubMed] [Google Scholar]
- Ciaraldi TP, Kolterman OG, Scarlett JA, Kao M, Olefsky JM 1982 Role of glucose transport in the post-receptor defect of non-insulin dependent diabetes mellitus. Diabetes 31:1016–1022 [DOI] [PubMed] [Google Scholar]
- Henry RR, Abrams L, Nikoulina S, Ciaraldi TP 1995 Insulin action and glucose metabolism in non-diabetic control and NIDDM subjects: comparison using human skeletal muscle cell cultures. Diabetes 44:936–946 [DOI] [PubMed] [Google Scholar]
- Ciaraldi TP, Abrams L, Nikoulina S, Mudaliar S, Henry RR 1995 Glucose transport in cultured human skeletal muscle cells. Regulation by insulin and glucose in nondiabetic and non-insulin-dependent diabetes mellitus subjects. J Clin Invest 96:2820–2827 [DOI] [PMC free article] [PubMed] [Google Scholar]
- Bradford MM 1976 A rapid and sensitive method for the quantitation of microgram quantities of protein utilizing the principle of protein-dye binding. Anal Biochem 71:248–254 [DOI] [PubMed] [Google Scholar]
- American Diabetes Association 2004 Diagnosis and classification of diabetes mellitus. Diabetes Care 27:S5–S10 [DOI] [PubMed] [Google Scholar]
- Farese RV, Sajan MP, Standaert ML 2005 Atypical protein kinase C in insulin action and insulin resistance. Biochem Soc Trans 33:350–353 [DOI] [PubMed] [Google Scholar]
- Saltiel AR, Pessin JE 2003 Insulin signaling in microdomains of the plasma membrane. Traffic 4:711–716 [DOI] [PubMed] [Google Scholar]
- Hanada M, Feng J, Hemmings BA 2004 Structure, regulation and function of PKB/Akt —a major therapeutic target. Biochim Biophys Acta 1697:3–16 [DOI] [PubMed] [Google Scholar]
- Asagami T, Holmes TH, Reaven GM 2008 Differential effects of insulin sensitivity on androgens in obese women with polycystic ovary syndrome or normal ovulation. Metabolism 57:1355–1360 [DOI] [PMC free article] [PubMed] [Google Scholar]
- Corbould A, Kim Y-B, Youngren JF, Pender C, Kahn BB, Lee A, Dunaif A 2005 Insulin resistance in the skeletal muscle of women with PCOS involves intrinsic and acquired defects in insulin signaling. Am J Physiol Endocrinol Metab 288:E1047–E1054 [DOI] [PubMed] [Google Scholar]
- Corbould A, Dunaif A 2007 The adipose cell lineage is not intrinsically insulin resistant in polycystic ovary syndrome. Metabolism 56:716–722 [DOI] [PMC free article] [PubMed] [Google Scholar]
- Henry RR, Ciaraldi TP, Abrams-Carter L, Mudaliar S, Park KS, Nikoulina SE 1996 Glycogen synthase activity is reduced in cultured skeletal muscle cells of non-insulin-dependent diabetes mellitus subjects. J Clin Invest 98:1231–1236 [DOI] [PMC free article] [PubMed] [Google Scholar]
- Gaster M, Petersen I, Hojlund K, Poulsen P, Beck-Nielsen H 2002 The diabetic phenotype is conserved in myotubes established from diabetic subjects: evidence for primary defects in glucose transport and glycogen synthase activity. Diabetes 51:921–927 [DOI] [PubMed] [Google Scholar]
- DeFronzo RA, Jacot E, Jequier E, Maeder E, Wahren J, Felber JP 1981 The effects of insulin on disposal of intravenous glucose. Results from indirect calorimetry and hepatic and femoral venous catheterization. Diabetes 30:1000–1007 [DOI] [PubMed] [Google Scholar]
- Hojlund K, Glintborg D, Andersen NR, Birk JB, Treebak JT, Frosig C, Beck-Nielsen H, Wojtaszewski JFP 2008 Impaired insulin-stimulated phosphorylation of Akt and AS160 in skeletal muscle of women with polycystic ovary syndrome is reversed by pioglitazone treatment. Diabetes 57:357–366 [DOI] [PubMed] [Google Scholar]
- Diamanti-Kandarakis E, Argyrakopoulou G, Economou F, Kandaraki E, Koutsilieris M 2008 Defects in insulin signaling pathways in ovarian steroidogenesis and other tissues in polycystic ovary syndrome. J Steroid Biochem Mol Biol 109:242–246 [DOI] [PubMed] [Google Scholar]
- Poretsky L 2006 Commentary: polycystic ovary syndrome-increased or preserved insulin sensitivity to insulin? J Clin Endocrinol Metab 91:2859–2860 [DOI] [PubMed] [Google Scholar]
- Chu YL, Sun YY, Qiu HY, Li HF 2004 Tyrosine phosphorylation and protein expression of insulin receptor substrate-1 in the patients with polycystic ovary syndrome. AZhonghua Fu Chan Ke Za Zhi 39:176–179 [PubMed] [Google Scholar]
- Beeson M, Sajan MP, Gomez-Daspet J, Luna V, Dizon M, Grebenev D, Powe JL, Lucidi S, Miura A, Kanoh Y, Bandyopadhyay G, Standaert ML, Yeko TR, Farese RV 2004 Defective activation of protein kinase C-z in muscle by insulin and phosphatidylinositol-3,4,5,-(PO4)3 in obesity and polycystic ovary syndrome. Metab Syndr Relat Disord 2:49–56 [DOI] [PubMed] [Google Scholar]
- Corbould A 2007 Chronic testosterone treatment induces selective insulin resistance in subcutaneous adipocytes of women. J Endocrinol 192:585–594 [DOI] [PubMed] [Google Scholar]
- Lystedt E, Westergren H, Brynhildsen J, Lindh-Astrand L, Gustavsson J, Nystronm FH, Hammar M, Stralfors P 2005 Subcutaneous adipocytes from obese hyperinsulinemic women with polycystic ovary syndrome exhibit normal insulin sensitivity but reduced maximal insulin responsiveness. Eur J Endocrinol 153:831–835 [DOI] [PubMed] [Google Scholar]
- Kershaw EE, Flier JS 2004 Adipose tissue as an endocrine organ. J Clin Endocrinol Metab 89:2548–2556 [DOI] [PubMed] [Google Scholar]
- Kadowaki T, Yamauchi T, Kubota N, Hara K, Ueki K, Tobe K 2006 Adiponectin and adiponectin receptors in insulin resistance, diabetes and the metabolic syndrome. J Clin Invest 116:1784–1792 [DOI] [PMC free article] [PubMed] [Google Scholar]
- Ciaraldi TP 1988 The role of adenosine in insulin action coupling in rat adipocytes. Mol Cell Endocrinol 60:31–41 [DOI] [PubMed] [Google Scholar]
- Thong FS, Lally JS, Dyck DJ, Greer F, Bonen A, Graham TE 2007 Activation of the A1 adenosine receptor increases insulin-stimulated glucose transport in isolated rat soleus muscle. Appl Physiol Nutr Metab 32:701–710 [DOI] [PubMed] [Google Scholar]
- Han D-H, Hansen PA, Nolte LA, Holloszy JO 1998 Removal of adenosine decreases the responsiveness of muscle glucose transport to insulin and contractions. Diabetes 47:1671–1675 [DOI] [PubMed] [Google Scholar]
- Gonzalez F, Thusu K, Abdel-Rahman E, Prabhala A, Tomani M, Dandona P 1999 Elevated levels of tumor necrosis factor α in normal-weight women with polycystic ovary syndrome. Metabolism 48:437–441 [DOI] [PubMed] [Google Scholar]
- Ciaraldi TP, Morales AJ, Hickman MG, Odom-Ford R, Olefsky JM, Yen SSC 1997 Cellular insulin resistance in adipocytes from obese polycystic ovary syndrome subjects involves adenosine modulation of insulin sensitivity. J Clin Endocrinol Metab 82:1421–1425 [DOI] [PubMed] [Google Scholar]
- Aroda V, Ciaraldi TP, Chang SA, Dahan MH, Chang RJ, Henry RR 2008 Circulating and cellular adiponectin in polycystic ovary syndrome: relationship to glucose tolerance and insulin action. Fertil Steril 89:1200–1208 [DOI] [PMC free article] [PubMed] [Google Scholar]
Associated Data
This section collects any data citations, data availability statements, or supplementary materials included in this article.