

Abstract
The membrane glycoprotein component of the cellular proteome represents a promising source for potential disease biomarkers and therapeutic targets. Here we describe the development of a method that facilitates the analysis of membrane glycoproteins and apply it to the differential analysis of breast tumor cells with distinct malignant phenotypes. The approach combines two membrane extraction procedures, and enrichment using ConA and WGA lectin affinity columns, prior to digestion and analysis by LC–MS/MS. The glycoproteins are identified and quantified by spectral counting. Although the distribution of glycoprotein expression as a function of MW and pI was very similar between the two related cell lines tested, the approach enabled the identification of several distinct membrane glycoproteins with an expression index correlated with either a precancerous (MCF10AT1), or a malignant, metastatic cellular phenotype (MCF10CA1a). Among the proteins associated with the malignant phenotype, Gamma-glutamyl hydrolase, CD44, Galectin-3-binding protein, and Syndecan-1 protein have been reported as potential biomarkers of breast cancer.
Keywords: glycoproteins, membrane proteins, malignancy associated proteins, spectral count
1. Introduction
The attachment of specific carbohydrate structures plays a major role in determining glycoprotein function. Alterations in glycosylation patterns have been associated with the development and progression of specific diseases, including cancer.1-5 Examples of glycoproteins as clinical biomarkers and therapeutic targets in cancer include CA125 in ovarian cancer,6,7 Her2/neu in breast cancer, and prostate-specific antigen (PSA) in prostate cancer.8,9 Monitoring glycoproteins could play an important role in detecting and evaluating tumor progression in addition to assessing tumor load and therapy. Due to the important role that glycoproteins play in cellular processes and disease progression there has been an increased interest in developing methodologies that can be used to specifically study this class of proteins.10-12
Membrane proteins play critical roles in many biological functions and are often the molecular targets for drug discovery. Membrane proteins are often extensively glycosylated, especially those that are part of the extracellular membrane.13,14 Unfortunately, the recovery of membrane proteins from cellular or tissue sources is particularly difficult. The hydrophobic nature, and hence poor solubility, of membrane proteins has severely limited the proteomic profiling of this class of proteins from complex biological mixtures. Two-dimensional polyacrylamide gel electrophoresis (2-D PAGE) coupled with a variety of solubilizing reagents has previously been the most employed technique for the identification of membrane proteins. However, due to the hydrophobic nature and their tendency to precipitate at their isoelectric point, this approach is limited by low recovery and low sequence coverage rates. Chromatophoresis, a hybrid liquid phase/gel phase method, circumvents some of the issues of membrane protein precipitation, but an all liquid-phase approach would seem to be more promising.13,15
In this study, we demonstrate the use of combining membrane extraction and lectin affinity methods as a simple, effective method for the detailed analysis of human cellular membrane glycoproteins. To evaluate the method we applied it to the differential analysis of membrane glycoproteins in a model of breast cancer progression. The model tested here consists of two related human breast cell lines, MCF10AT1 which is representative of a normal, premalignant phenotype (MCF10AT1), and MCF10CAla, a malignant and metastatic phenotype.16,17 To optimize the extraction of membrane glycoproteins from the cell lines, we compared two different cell lysis methods for membrane protein solubilization and extraction and linked these to affinity column enrichment using ConA and WGA lectins. Enriched glycoprotein samples were then analyzed by LC–MS/MS, and a label-free, spectral count method was applied for the quantitation of specific membrane glycoproteins.
The approach enabled us to identify and confirm 55 unique glycoproteins, and to identify several that were differentially expressed with respect to the cellular phenotype. The findings demonstrate the utility of the membrane glycoprotein extraction and enrichment technique for the global screening of complex biological samples. The initial results also highlight potential roles for specific glycoproteins in an aggressive breast tumor cell phenotype.
2. Experimental Section
2.1. Cell Culture
Human breast cancer cells, MCF10CA1a cells and MCF10AT1 cells were grown as monolayers on plastic in DMEM/F12 medium (1:1 mixture of DMEM and Ham’s F-12 medium) supplemented with 5% horse serum, 10 mg/mL of insulin, 20 ng/mL epidermal growth factor, and 0.5 mg/mL of hydrocortisone. The cells were then collected by scraping and washed twice with PBS buffer before being stored at −80 °C.
2.2. Lysis
2.2.1. Lysis Method 1
The packed cell pellets (0.15–0.2 mL containing ~25 million cells) were suspended in 1.5 mL of lysis buffer. The lysis buffer contains 10 mM Tris-HCl, pH-7.5, 150 mM NaCl. 1% Nonidet P-40 and protease inhibitor cocktail (Roche) with a ratio of 1:100 were added at the moment just before the pellets were lysed. The pellets were suspended for 30 min at room temperature, after which a tissue tearor (Biospec Products, Inc.) was used for 15 s pulses each for a total of 1 min. For each 15 s pulse, the sample was placed on ice for 30 s cooling periods. The lysate was then centrifuged at 16 100× g for 30 min at 4 °C, and the supernatant was collected. Cell lysates were prefiltered, using a 0.45 μm filter (Millipore) prior to analysis. If not used immediately, the lysate was stored at −80 °C.
2.2.2. Lysis Method 2
In lysis method 2, we used the MEM-PER Eukaryotic membrane protein extraction reagent kit (Pierce, Rockford, IL). Following the procedure specified in the manual, 300 μL of Reagent A was added to the cell pellet and the solution was pipetted up and down to obtain a homogeneous cell suspension. The mixture was incubated 10 min at room temperature with occasional vortexing. The lysed cells were maintained on ice. Two parts Reagent C with a volume of 600 μL was diluted with 1 part Reagent B with a volume of 300 μL; 900 μL of diluted Reagent C were then added to each tube of lysed cells and vortexed. The tubes were inclubated on ice for 30 min with vortexing every 5 min. The tubes were centrifuged at 10 000× g for 3 min at 4 °C. The supernatant was then transferred to new tubes and the supernatant incubated for 20 min at 37 °C to separate the membrane protein fraction. The tubes were centrifuged at room temperature for 2 min at 10 000× g to isolate the hydrophobic fraction from the hydrophilic fraction. The hydrophilic phase (top layer) was removed from the hydrophobic protein phase (bottom layer) and saved in a new tube. The phase separations were performed as quickly as possible because the interface between the layers slowly disappeared at room temperature. The separated fractions were stored at −80 °C.
2.3. Lectin Affinity Glycoprotein Extraction
Agarose-bound wheat germ agglutinin (WGA) and agarose-bound Concanavalin A (ConA) were purchased from Vector Laboratories (Burlingame, CA). Agarose-bound WGA (1 mL) and 1 mL of agarose-bound ConA were packed into a disposable screw endcap spin column with filters at both ends. The column was first washed with 3 mL of binding buffer (20 mM Tris, 0.15 M NaCl, pH 7.4). Protease inhibitor stock solution was prepared by dissolving one complete EDTA-free protease inhibitor cocktail tablet (Roche, Indianapolis, IN) in 1 mL of H2O. The stock solution was added to binding buffer and elution buffer at a ratio of (v/v) 1:50. A 500 μL sample diluted with 5 mL of binding buffer was loaded onto the column and incubated for 15 min. The first sample passed through the binding buffer was collected and then passed through the lectin affinity column and resuspended. The column was washed with 6 mL of binding buffer twice to wash off the nonspecific binding proteins. Finally, the captured glycoproteins were released with 2 mL of elution buffer (0.3 M N-acetylglucosamine and 0.3 M methyl-R-d-mannopyroside in 20 mM Tris and 0.5 M NaCl, pH 7.0). This step was repeated twice, and the eluted fractions were pooled. The sample was concentrated using Microcon YM-10 (Millipore Corp., Bradford, MA) according to the manufacturer’s protocol to 400 μL. The final eluted samples were subjected to quantitation by Bradford assay (Bio-Rad, Hercules, CA).
2.4. Protein Digestion by Trypsin
Ten microliters of 50 mM ammonium bicarbonate (Sigma) was mixed with each concentrated 10 uL sample to obtain pH 7.8. A 2 μL portion of 150 mM DTT (Sigma) was added and the resulting mixture incubated at 60 °C for 60 min. Another 180 μL ammonium bicarbonate was added. TPCK modified sequencing grade porcine trypsin (1:50) (Promega, Madison, WI) was added and briefly vortexed prior to a 12–16 h incubation at 37 °C on an agitator. The digestion and reduction reaction was terminated by adding 1 μL of TFA to the digest.
2.5. Mass Spectrometry-Protein Identification by LC–MS/MS
A Paradigm MG4 micropump (Michrom Biosciences Inc., Auburn, CA) was used for chromatographic separation of peptide mixtures. For nanoLC–ESI–MS/MS experiments, a nanotrap platform (Michrom) was set up prior to the electrospray source. It included a peptide nanotrap (0.2 × 50 mm2, Michrom) and a separation column (0.1 mm × 150 mm, C18, Michrom). The peptide sample was injected and first desalted on the trap column packed with C4 (300 μm i.d. × 50 mm) (Michrom Biosciences Inc.) with 3% solvent B (0.3% formic acid in ACN) at 50 μL/min for 5 min. The peptides were then eluted onto an analytical C18 column (100 μm i.d. × 150 mm) (Michrom Biosciences Inc.) using a 60 min gradient at a flow rate of 0.3 μL/min where solvent A was 0.3% formic acid in HPLC grade. The 60 min gradient was 3–11% in 2 min, 11–30% B in 33 min, 30–40% B in 5 min, then 40–95% in 2 min, and hold at 95% B for 1 min then back to 3% B in 2 min, it stabilizes in 3% B for 10 min. A Finnigan LTQ mass spectrometer (Thermo) was used to acquire spectra. A 75 μm metal spray tip (Michrom) was used, and spray voltage was set at 2.5 kV. The instrument was operated in data-dependent mode with dynamic exclusion enabled. For each cycle of one full mass scan (range of m/z 400–2000), the five most intense ions in the spectrum were selected for tandem MS analysis, unless they appeared in the dynamic or mass exclusion lists. The data acquisition and generation of peak list files were automatically performed by Xcaliber. Multiple analyses (at least 10 LC/MS/MS runs) were performed for each of the ConA extracted samples. Dynamic exclusion was employed in the LC/MS/MS analysis to increase the number of identified proteins.
2.6. Database Searching and Quantitation by Label-Free Spectral Counting
All MS/MS spectra were searched against the human protein database from Swiss-Prot release version 53.0 of 03-Jul-07 which contains 269 293 sequence entries and comprises 98 902 758 amino acids. The search was performed using SEQUEST algorithm, Version 27 incorporated in Bioworks software, version 3.1 SR1 (Thermo Finnigan). Peptide fragment lists were generated and submitted to Swiss-Prot database searching. The search parameters were as follows: (1) database species, Homo sapiens; (2) allowing two missed cleavages; (3) possible modifications, oxidation of M; (4) peptide ion mass tolerance 1.50 Da; (5) fragment ion mass tolerance 0.0 Da; (6) peptide charges +1, +2, and +3. The filter function in Bioworks browser was used to set a single threshold to consider fully tryptic peptides assigned with Xcorr values as follows: 1.9 for singly charged ions, 2.5 for doubly charged ions, and 3.5 for triply charged ions, while no ions at higher charged states were considered. All SEQUEST search parameters and data filtering were the same in all digest fractions. Protein IDs were accepted if, and only if, the ID was positively identified by at least 2 peptides detected. If the protein was identified by a single matching peptide, the spectrum was manually validated. Positive protein identification was validated by the Trans-Proteomics pipeline.18 This software includes both the PeptideProphet and ProteinProphet programs that were developed by Keller et al.18 (http://peptideprophet.sourceforge.net/). All the reported proteins have an identification probability higher than 90%.
Spectral count is an isotope label free quantitation method to measure relative abundance between proteins in a complex protein mixture. We performed a comparative analysis between two samples using the spectral count method. The spectral count of individual proteins in both samples is acquired using DTASelect v2.0. Confident protein IDs are confirmed with Trans-Proteomics pipeline analysis. For ConA extracted samples, proteins were considered positive if either at least two peptides matched or there were 5 out of a total of 20 runs positive for MCF10AT1 and MCF10CA1a. For WGA extracted samples, proteins were considered positive if either more than two peptides matched or a total spectral count of more than 5 was evident. Spectral count fold-change was calculated as the ratio of the count for the target protein and the average spectral count for each sample. A 2-fold change was considered as differentially expressed between the two samples.
3. Results and Discussion
3.1. Cell Lines
The MCF10AT1 cell line was derived from MCF10A by T-24 c-Ha-ras gene transfection. It is a preneoplastic human breast cell line and represents early breast cancer progression since the human cell line MCF10A originated from spontaneous immortalization of breast epithelial cells obtained from a single patient with fibrocystic disease. This cell line forms preneoplastic lesions in immune-compromised mice that represent a premalignant stage but with the potential for neoplastic progression.17 MCF10CA1a is a fully malignant human breast cancer cell line which rapidly forms invasive carcinomas with metastatic potential and displays histologic variations ranging from undifferentiated carcinomas to well differentiated adenocarcinomas.16 The identification of proteins that are associated with the respective phenotypes of MCF10CA1a and MCF10AT1 may reveal key functions that are involved in breast cancer progression.
3.2. Comparison of Two Lysis Methods for Membrane Glycoprotein Extraction
The aim of using different membrane lysis methods here was to determine which lysis method is more appropriate to combine with a glycoprotein capture strategy using lectin affinity columns which enable the enrichment of subsets of glycoproteins. We compared two different membrane lysis methods. Lysis method 1 uses a lysis buffer containing Tris-HCl, NaCl, Nonidet P-40 and protease inhibitor cocktail. NP-40 is a nonionic surfactant used in the isolation of membrane complexes. It has a polar polyethylenglycol chain and a nonpolar tail to interact with membranes, leading to the formation of lipids trapped in water-soluble micelles. We used a high quality Nonidet P40 that has been purified to reduce levels of unwanted peroxides or carbonyl compounds or salts which can shift the pI of proteins and /or interfere with extraction from the membrane. After solubilization, the use of high-speed centrifugation in the lysis procedure eliminates a significant proportion of the total cellular proteins and serves to concentrate the membrane fraction.
Lysis method 2 used a commercially available extraction kit. The Mem-PER Eukaryotic Membrane Protein Extraction Reagent Kit is designed for the enrichment of integral membrane proteins from cultured mammalian or yeast cells, or from mammalian tissue, using a mild detergent-based protocol. Cell membrane proteins are solubilized with two proprietary detergents provided in the kit. The cocktail is incubated at 37 °C to separate the hydrophobic proteins from the hydrophilic proteins through phase partitioning. Extraction efficiencies will vary depending on the number of times the integral membrane protein(s) of interest spans the lipid bilayer.
After the samples were lysed, cell lysates of MCF10CA1a and MCF10AT1 cells were passed through a Con A lectin column to capture oligomannosyl saccharides found in N-glycans.19,20 The bound materials were eluted with corresponding sugars in an effort to reduce possible contamination with nonspecifically adsorbed proteins. After ConA lectin extraction, the Bradford assay method was used for the quantitation of membrane glycoproteins (Table 1). For lysis method 1, the average extracted protein yields were 16.7 and 45.4 μg, respectively, for MCF10AT1 and MCF10CA1a samples. For lysis method 2, the average protein yields were 11.4 and 11.6 μg, respectively. Thus, the extracted protein yields from method 2 were 31.7 and 74.4% less efficient than achieved with method 1 for MCF10AT1 and MCF10CA1a, respectively. The recovery range of glycoproteins from the ConA lectin affinity columns was 0.58% to 2.2% relative to the total protein content from the original cell lysate. WGA lectin extraction was only applied to samples extracted with lysis method 1. The procedure was the same as Con A lectin column enrichment. The yield of extracted proteins was 57.8 and 52.0 μg, respectively, for MCF10AT1 and MCF10CA1a samples which corresponds to a recovery rate from total protein sample of 0.38–0.58%.
Table 1.
Comparison between Two Different Lysis Methodsa
| method 1 | after lectin (μg) | method 2 | after lectin (μg) |
|---|---|---|---|
| MCF10AT1 | 15.9 | MCF10AT1 | 11.8 |
| MCF10AT1–2 | 16.8 | MCF10AT1–2 | 10.5 |
| MCF10AT1–3 | 18.4 | MCF10AT1–3 | 12.0 |
| MCF10AT1–4 | 15.5 | ||
| Average | 16.7 | 11.4 | |
| MCF10CA1a | 42.3 | MCF10CA1a | 29.0 |
| MCF10CA1a-2 | 41.2 | MCF10CA1a-2 | 5.8 |
| MCF10CA1a-3 | 52.8 | ||
| Average | 45.4 | 11.6 |
After samples were lysed by different methods and using the same amount of starting material, 5 cell lysates of MCF10CA1a (three replicates for method one and two replicates for method 2) and 7 cell lysates of MCF10AT1 cells (four replicates for method one and three replicates for method two) were passed through Con A lectin columns respectively. The bound materials were eluted with corresponding sugars. The final eluted samples were subjected to quantitation using the Bradford assay. The table shows total protein yields after ConA lectin affinity column enrichment. The average protein yields were calculated based on the different methods for each sample.
The major advantage of the approach described herein includes the use of an all liquid phase procedure to extract and isolate membrane glycoproteins. However, there are some drawbacks to be noted. The data analysis shows that proteins isolated for each procedure and lectin used is different. Especially in the case of lysis method 2, the two replicate isolations are quite different. This may be in part due to the difficulty of isolating the separated phases where the interface between the layers slowly disappears at room temperature. Another concern for the method described is that lysis method 1 may potentially incorporate many cytoplasmic proteins in the generated lysate. Although the first lysis method included many other cellular components, after the second dimension lectin enrichment, those proteins are eliminated because they do not bind to the column. In the current study, we only focused on the protein yield after lectin enrichment, and in this context, protein assay lysis method 1 provided better recovery. Thus, we have concluded that membrane lysis method 1 is more appropriate to combine with a glycoprotein capture strategy using the lectin affinity column. In the remainder of the work we therefore only focused on samples from lysis method 1.
3.3. Protein Identification
The proteins extracted by Con A and WGA lectin affinity columns were analyzed by mass spectrometry. The bound fractions from the lectin column were enzymatically digested and analyzed by nano-LC–MS/MS. For each cycle of one full mass scan (range of m/z 400 – 2000), the five most abundant peptides in the spectrum were selected and sequenced. Figure 1A is a representative nano-LC/MS/MS base peak chromatogram, showing the detection of the more abundant ions across a 60 min gradient separation. Figure 1B shows a representative MS/MS spectrum of a peptide sequence from endoplasmin precursor, an N-linked glycoprotein as annotated in the Swiss-Prot database. It was one of the most abundant proteins identified in the eluted fraction of both MCF10AT1 and MCF10CA1a cell lines. Eighteen other ion peaks were also detected and assigned to this protein.
Figure 1.

LC–MS/MS analysis. (A) Representative nano-LC–MS/MS base peak chromatogram, showing the detection of the peptide ions across the 60 min gradient separation (45 min shown here). (B) MS/MS sequencing data of a peptide from Endoplasmin precursor identified in the eluted fraction of MCF10CA1a and MCF10AT1 cell lines.
To evaluate the reproducibility of nano-LC–MS/MS analysis alone, five standard glycoproteins were mixed together to run nano-LC–MS/MS to detect the retention time of peptides. Five standard glycoproteins, Alpha-1-acid glycoprotein precursor, Alpha-2-HS-glycoprotein precursor, Fetuin-B precursor, 164 kDa protein and Thyroglobulin precursor were digested by trypsin and combined together. A dilution series of the combined glycopeptide mixture was performed to obtain 1, 5, 20, and 100 ng of each protein and then analyzed using LC–MS/MS. Figure 2 shows representative MS spectra of the +2 precursor mass of K.HTLNQIDSVK.V from the protein Alpha-2-HS-glycoprotein precursor in four independent runs. The retention times of this peptide in these runs were 19.56, 19.60, 19.59, and 19.63 min, which are not significantly different. On the basis of the results, the standard deviation of the elution time of a peptide was estimated to be less than 7 s in our experimental system employing a capillary C18 column.
Figure 2.

Reproducibility of nano-LC–MS/MS of standard glycoproteins. The retention times of a +2 charged precursor mass of K.HTLNQIDSVK.V from the protein Alpha-2-HS-glycoprotein precursor from four independent runs were measured to be 19.56, 19.60, 19.59, and 19.63 min.
Data acquisition using tandem mass spectrometry is generally triggered by ion abundance levels. In the separation of complex peptide mixtures, coelution is prevalent, where the selection of ions for MS/MS is dependent on the width of the chromatographic peaks or the concentration of peptides delivered to the mass spectrometer. Although the chromatographic separation process has been shown to be reproducible, in very complex peptide mixtures, the number of ions coeluting can significantly exceed the number of ions for which tandem mass spectra can be acquired. Data acquisition can thus be biased against the low abundance ion signals thus making the protein identification process less reproducible. Analysis therefore needs to be repeated several times to cover a typical mass range and potentially improve the dynamic range of the analysis and the acquisition of low-abundance peptide ion signals. In a recent study by Yates and co-worker,21 it has been shown that a repetition of 10 times is required to reach a reasonable level of completeness in an analysis. In this study, we applied ten separate runs of the same lectin purified sample on the LC–MS/MS for each cell line to compensate for the mass spectral bias.
The LC/tandem mass spectrometry technique requires strict attention to data interpretation and handling to ensure accurate identification of components in a complex biological material. Multiple analyses of samples and manual data validation with stringent criteria are particularly important for correct identification. In this study, all the proteins listed are calculated by peptideprophet and proteinprophet and with at least 90% confidence for both the protein and peptide identification. The Xcorr for each ion charge was set at the accepted values for a high confidence of protein identification. For each ConA lectin extracted protein sample, at least ten replicates were run and the results were combined to increase the confidence of the IDs. Protein IDs were accepted if, and only if, the ID was positively identified in at least 2 peptides detected. If the protein was identified by a single matching peptide, the spectrum was manually validated. The protein was considered present in the sample if its corresponding peptides passed all the stringent criteria (described in the Experimental Procedures) and the protein was observed in at least five MS/MS analyses out of a total of 20 runs for both MCF10AT1 and MCF10CA1a. For ConA extracted proteins, a total of 171 proteins were positively identified in our study, with around 80 proteins being detected in MCF10AT1 samples and around 150 proteins in MCF10CA1a samples for each run respectively. A table (Table S1) summarizing all of the protein IDs obtained from analysis of all of the samples is available in the Supporting Information. For WGA extracted samples, proteins were considered positive if either there were more than two peptides matched, or the total spectral count was more than 5. A total of 167 proteins were positively identified from the WGA extraction; 87 and 146 proteins respectively for MCF10AT1 and MCF10CA1a.
3.4. Analysis of Isolated Proteins from ConA and WGA for CA1a and AT1
We examined two lectin affinity columns (ConA and WGA) for selective enrichment of complementary subsets of glycoproteins. ConA recognizes α-linked mannose, including high mannose-type and mannose core structures which are common to N-linked glycosylated proteins. WGA can interact with some glycoproteins via sialic acid residues and it also binds oligosaccharides containing terminal N-acetylglucosamine.22 For ConA extractions, we only considered proteins detected in more than 5 out of 20 total runs in MCF10AT1 and MCF10CA1a samples. In this manner, a total of 88 unique proteins were identified in MCF10AT1 samples and 152 proteins in MCF10CA1a samples. For WGA extractions, we only considered proteins with a confidence of 90% for both peptide and proteins. We also calculated the spectral count of the samples where a spectral count over 5 was considered as a true identification. A total of 87 unique proteins in AT1 samples and 146 proteins in CA1a samples were considered as confident IDs. The distribution of proteins between the two different lectin extraction methods was compared (Figure 3). There was an overlap of 72 proteins between the two groups of proteins isolated with the two lectin columns. Among them, 24 proteins were common for both MCF10AT1 and MCF10CA1a samples. More proteins were identified in the MCF10CA1a samples compared with the MCF10AT1 samples, 237 and 134 proteins, respectively. However, with our strict identification criteria, the total number of proteins identified in the ConA and WGA purified mixture were almost the same, 171 and 167 proteins, respectively.
Figure 3.

Distribution of proteins isolated by WGA and ConA for MCF10AT1 and MCF10CA1a. All the protein IDs are calculated by peptideprophet and proteinprophet with a confidence above 90%. The graph indicates the number of proteins observed in different samples. Shared proteins are those that were observed in both or all isolates.
The distributions of the molecular weights and pI range of the isolated proteins are shown in Figure 4. With the ConA lectin enrichment, the distributions of the molecular weights of the isolated proteins ranged from ~11 to ~300 kDa for MCF10AT1 samples (Figure 4A), which is very similar to that of MCF10CA1a (Figure 4C). Similarly, analysis of the pI values of these proteins for MCF10AT1 (Figure 4B) and for MCF10CA1a (Figure 4D) indicated the capacity to capture proteins with a wide range of values, ranging from pH 4 to pH 12. Considering both the molecular weight and pI ranges of the proteins selected by ConA, there did not appear to be any major overall differences between MCF10AT1 and MCF10CA1a samples. In the case of the WGA enrichment, a total of 167 unique identifications were obtained. The distributions of the molecular weights and pI range of the isolated proteins are shown in Figure 4E–H. The distributions of the molecular weights of the isolated proteins ranged from ~11 to ~460 kDa for both MCF10AT1 and MCF10CA1a samples (Figure 4E and G), a wider range than observed in ConA extracted samples. The pI ranges of the proteins selected by WGA were very similar for both MCF10CA1a and MCF10AT1 samples. No major difference in the pI range of the proteins selected by ConA or WGA was observed.
Figure 4.

Distribution of detected molecular weights and pI values of proteins identified in the MCF10AT1 (A, B) and MCF10CA1a (C, D) using ConA column and MCF10AT1 (E, F) and MCF10CA1a (G, H) using a WGA column.
3.6. Comparison of Isolation of Two Cellular Glycoproteins
The Swiss-Prot database provides direct access to the protein description from the Website (http://ca.expasy.org/sprot/). On the basis of descriptions provided by this site, 25 proteins (28.4% of the total proteins) within the ConA extraction fraction of the MCF10AT1 samples were predicted to be glycoproteins. In the case of the MCF10CA1a samples, the ConA fraction contained 34 proteins that were predicted to be glycoproteins. This represented approximately 22.3% of the identified proteins bound by the lectin column. Among the glycoproteins enriched by ConA, 17 were isolated in both samples. Interestingly, of the nonglycoproteins, 62.6% proteins were phosphoproteins. Within the WGA fractions there were 23 and 27 predicted glycoproteins identified in MCF10AT1 and MCF10CA1a samples respectively.
The analysis of protein identifications based on the use of two different lectin column enrichments indicates that although the distribution of glycoprotein expression as a function of MW and pI was very similar between the two related cell lines tested, WGA enriched proteins provided a wider range of MW compared with ConA enrichment. Also, both cell line samples have their own specific glycoprotein expression patterns for ConA and WGA enrichment separately.
3.7. Spectral Count Method and Differentially Expressed Glycoprotein Analysis
The spectral count method is a mass spectrometry (MS)-based label-free approach. It counts the total number of MS/MS spectra of peptides from a given protein in an LC/LC–MS/MS analysis, and this can be used to measure relative abundance between proteins in a complex protein mixture. A number of studies have demonstrated a high correlation between spectral count and protein abundance with an R square value around 0.99.21,23 It is linearly correlated with the protein abundance over a dynamic range of 2 orders of magnitude. In addition, among three sampling statistics that are correlated with protein abundance (i.e., spectral count, peptide count, sequence coverage), the spectral count method has the highest reproducibility and is the best performer in relative protein quantitation.23
We performed a comparative analysis between the two cell line samples using spectral count analysis. The spectral count of individual proteins in both samples was acquired using DTASelect v2.0. For ConA extracted proteins, the average spectral count was calculated by dividing the total spectral count by the number of the independent analyses. For WGA extracted proteins, all proteins with a total spectral count less than 5 were considered absent and thus eliminated. Confident proteins IDs were confirmed with Trans-Proteomics pipeline analysis. For differentially expressed glycoproteins, the fold change based on spectral count was calculated as the ratio of the target protein count and the average spectral count for each sample. Fold changes >2-fold were considered as relative differential expression within the two samples. The differentially expressed glycoproteins with their fold change are shown in Table 2 for ConA extraction and Table 3 shows data from WGA extracted differentially expressed glycoproteins. ConA extraction identified 27 differentially expressed glycoproteins, and WGA extraction identified 22 differentially expressed glycoproteins.
Table 2.
Differentially Expressed Glycoproteins IDa
| protein name | access # | glycoprotein | location | ave. MCF10AT1 | ave. MCF10CA1a | ratio |
|---|---|---|---|---|---|---|
| Calumenin | O43852 | N-linked (GlcNAc…). | Endoplasmic reticulum lumen | 48 | 23 | 0.48 |
| Dipeptidyl-peptidase 1 | P53634 | N-linked (GlcNAc…). | Lysosome | 0 | 49 | – |
| CD44 antigen | P16070 | N-linked (GlcNAc…). | Membrane | 2 | 5 | 2.5 |
| Endoplasmin | P14625 | N-linked (GlcNAc…). | Endoplasmic reticulum lumen | 784 | 2297 | 2.93 |
| ERO1-like protein alpha | Q96HE7 | N-linked (GlcNAc…) | Membrane | 2 | 13 | 6.5 |
| Gamma-glutamyl hydrolase | Q92820 | N-linked (GlcNAc…) | Lysosome | 1 | 25 | 25 |
| N-acetylglucosamine-6-sulfatase | P15586 | N-linked (GlcNAc…) | Lysosome | 0 | 10 | – |
| Beta-hexosaminidase alpha chain | P06865 | N-linked (GlcNAc…). | Lysosome | 6 | 14 | 2.3 |
| Galectin-3-binding protein | Q08380 | N-linked (GlcNAc…). | Secreted | 0 | 24 | – |
| Prolyl 4-hydroxylase subunit alpha-1 | P13674 | N-linked (GlcNAc…). | Endoplasmic reticulum lumen | 9 | 276 | 30.7 |
| Prolyl 4-hydroxylase subunit alpha-2 | O15460 | N-linked (GlcNAc…). | Endoplasmic reticulum lumen | 0 | 45 | – |
| Procollagen-lysine,2-oxoglutarate 5-dioxygenase 1 | Q02809 | N-linked (GlcNAc…). | Membrane | 0 | 53 | – |
| Procollagen-lysine,2-oxoglutarate 5-dioxygenase 3 | O60568 | N-linked (GlcNAc…). | Rough endoplasmic reticulum membrane | 2 | 75 | 37.5 |
| Reticulocalbin-1 | Q15293 | N-linked (GlcNAc…). | Endoplasmic reticulum lumen | 202 | 13 | 0.064 |
| Sulfatase-modifying factor 2 | Q8NBJ7 | N-linked (GlcNAc…). | Endoplasmic reticulum lumen | 4 | 21 | 5.25 |
| UDP-glucose:glycoprotein glucosyltransferase 1 | Q9NYU2 | N-linked (GlcNAc…). | Endoplasmic reticulum lumen | 7 | 16 | 2.3 |
| Legumain | Q99538 | N-linked (GlcNAc…) | Lysosome | 0 | 6 | – |
| Nucleotide exchange factor SIL1 | Q9H173 | N-linked (GlcNAc…) | Endoplasmic reticulum | 0 | 6 | – |
| Beta-galactosidase | P16278 | N-linked (GlcNAc…). | Lysosome | 27 | 3 | 0.11 |
| Aspartyl/asparaginyl beta-hydroxylase | Q12797 | N-linked (GlcNAc…). | Endoplasmic reticulum membrane | 14 | 7 | 0.5 |
| Syndecan-1 | P18827 | N-linked (GlcNAc…) | Membrane | 55 | 3 | 0.054 |
| O-linked (Xyl…) | ||||||
| 4F2 cell-surface antigen heavy chain | P08195 | N-linked (GlcNAc…). | Membrane | 7 | 3 | 0.43 |
| Aminopeptidase N | P15144 | N-linked (GlcNAc…). | Cell membrane | 6 | 0 | 0 |
| Dipeptidyl-peptidase 2 | Q9UHL4 | N-linked (GlcNAc…). | Lysosome | 9 | 1 | 0.11 |
| Syndecan-4 | P31431 | O-linked (Xyl…) | Membrane | 4 | 0 | 0 |
| Basigin | P35613 | N-linked (GlcNAc…). | Cell membrane | 5 | 0 | 0 |
| Serpin H1 | P50454 | N-linked (GlcNAc…). | Endoplasmic reticulum lumen | 54 | 4 | 0.074 |
The average spectral count was calculated by dividing the total spectral count by the number of the independent analyses. Spectral count fold-change was calculated as the ratio of the average spectral count for the target protein for each sample. A two fold change was considered as differentially expressed between the two samples. N-linked glycoproteins are as annotated in the Swiss-Prot database.
Table 3.
Differentially Expressed Glycoproteins for WGA Extractiona
| protein name | access # | glycoprotein | location | MCF10AT1 | MCF10CA1a | ratio |
|---|---|---|---|---|---|---|
| Dipeptidyl-peptidase 1 | P53634 | N-linked (GlcNAc…). | Lysosome | 4 | 38 | 9.5 |
| CD44 antigen | P16070 | N-linked (GlcNAc…). | Membrane | 8 | 91 | 11.4 |
| Galectin-3-binding protein | Q08380 | N-linked (GlcNAc…). | Secreted | 0 | 18 | – |
| Procollagen-lysine,2-oxoglutarate 5-dioxygenase 1 | Q02809 | N-linked (GlcNAc…). | Membrane | 5 | 52 | 10.4 |
| Epithelial-cadherin | P12830 | N-linked (GlcNAc…). | Cell membrane | 18 | 0 | 0 |
| Beta-galactosidase | P16278 | N-linked (GlcNAc…). | Lysosome | 18 | 9 | 0.5 |
| 4F2 cell-surface antigen heavy chain | P08195 | N-linked (GlcNAc…) | Membrane | 31 | 14 | 0.45 |
| Aminopeptidase N | P15144 | N-linked (GlcNAc…). | Cell membrane | 13 | 0 | 0 |
| N-acetylglucosamine-6-sulfatase precursor | P15586 | N-linked (GlcNAc…). | Lysosome | 1 | 5 | 5 |
| Neutral amino acid transporter B(0) | Q15758 | N-linked (GlcNAc…). | Membrane | 13 | 4 | 0.31 |
| Sodium/potassium-transporting ATPase subunit beta-3 | P54709 | N-linked (GlcNAc…). | Membrane | 34 | 5 | 0.15 |
| CD109 antigen | Q6YHK3 | N-linked (GlcNAc…). | Cell membrane | 23 | 9 | 0.39 |
| Integrin alpha-2 | P17301 | N-linked (GlcNAc…). | Membrane | 6 | 36 | 6 |
| Integrin alpha-6 | P23229 | N-linked (GlcNAc…). | Membrane | 89 | 37 | 0.42 |
| Low-density lipoprotein receptor | P01130 | N-linked (GlcNAc…). | Membrane | 8 | 26 | 3.25 |
| Procollagen-lysine,2-oxoglutarate 5-dioxygenase 2 | O00469 | N-linked (GlcNAc…). | Rough endoplasmic reticulum membrane | 6 | 18 | 3 |
| Dolichyl-diphosphooligosaccharide-protein glycosyltransfera | P04843 | N-linked (GlcNAc…). | Endoplasmic reticulum membrane | 31 | 14 | 0.45 |
| Dolichyl-diphosphooligosaccharide-protein glycosyltransfera | P04844 | N-linked (GlcNAc…). | Endoplasmic reticulum membrane | 13 | 0 | 0 |
| Sodium-and chloride-dependent taurine transporter. | P31641 | N-linked (GlcNAc…). | Membrane | 18 | 8 | 0.44 |
| Integrin beta-1 | P05556 | N-linked (GlcNAc…). | Cell membrane | 4 | 46 | 11.5 |
| Synaptic glycoprotein SC2. | Q9NZ01 | N-linked (GlcNAc…). | Endoplasmic reticulum membrane | 0 | 27 | – |
| Tyrosine-protein kinase-like 7 | Q13308 | N-linked (GlcNAc…). | Membrane | 0 | 26 | – |
Protein identifications are considered if either there are more than two peptides matched or a total spectral count of more than 5 is considered. The spectral count fold-change was calculated as the ratio of the count for the target protein for each sample. Fold changes >2-fold were considered as relative differential expression within the two samples. N-linked glycoproteins as annotated in the Swiss-Prot database.
Differentially expressed proteins with large changes in expression were further evaluated as possible candidate biomarkers to distinguish MCF10CA1a and MCF10AT1 cells. We focused on several proteins previously associated with cancer that displayed the largest-fold change. Gamma-glutamyl hydrolase (GGH) is a lysosomal enzyme involved in the metabolism of folates and antifolates.24-26 There have been reports suggesting that GGH may be useful as a tumor marker in breast and lung cancer.27 In studies by Baggott et al., it was shown that in patients with metastatic breast cancer, mean plasma conjugase (GGH) activity was significantly higher than observed in control subjects without disease, and also in women whose cancer was in remission.28 Furthermore, the specific activity of the enzyme was higher in infiltrating carcinoma tissue than in normal adjacent tissue. Thus, it is possible that the amount of GGH in the plasma quantitatively reflects the tumor burden. He et. al also reported that expression of GGH in cells of pulmonary neuroendocrine tumors are correlated with poor prognosis.29 Only 28% of patients with GGH-positive tumors, as determined by immunohistochemistry, survived for nine years, whereas those whose tumor was GGH-negative had an 83% survival probability at 9 years; this difference was statistically significant at p < 0.01. In our studies, we found that this protein shows up in eight out of 10 runs of the aggressive MCF10CA1a cell sample, with an average spectral count of 25. While in MCF10AT1 samples, only 3 out of 10 runs identified this protein, with an average spectral count of 1. These data show that this protein is more highly expressed in MCF10CA1a relative to MCF10AT1, a finding which is consistent with previous studies.29,30 The LC/MS/MS spectrum of several peptides identified as Gamma-glutamyl hydrolase is shown in Figure 5.
Figure 5.

LTQ analysis of several peptides identified as Gamma-glutamyl hydrolase. MS/MS sequencing data of peptides identified in the eluted fraction in 8 out of 10 runs of the aggressive MCF10CA1a cell sample and 3 out of 10 runs in MCF10AT1 samples, with an average spectral count of 25 and 1, respectively.
Galectin-3-binding Protein (LG3BP_HUMAN) is a large oligomeric glycoprotein first identified by Iacobelli et al. as a tumor-associated antigen in breast cancer.31 Although its functions are not well clarified, it was recently demonstrated to induce promatrilysin (matrix metalloproteinase 7) expression in prostate32 cancers. In studies by Mbeunkui et al.,33 Galectin-3-binding protein was found to be strongly expressed in the aggressive cell lines MCF10DCIS.COM and MCF10CA cl. D, but undetected in the MCF10A and MCF10AT cell lines. This protein is one of the most significant markers of metastasis in the MCF10 cell line series. In our studies for the ConA extracted proteins, we found that this protein was absent in MCF10AT1 samples but present in 6 out of 10 runs of the MCF10CA1a samples, with an average spectral count of 24. Similar results were observed in the WGA extracted proteins, the spectral count in MCF10AT1 and MCF10CA1a were 0 and 18 respectively. The high expression of Galectin-3-binding protein in the aggressive MCF10CA1a cell line is consistent with previous studies. The LC–MS/MS spectra of several Galectin-3-binding protein peptides identified are shown in Figure 6.
Figure 6.
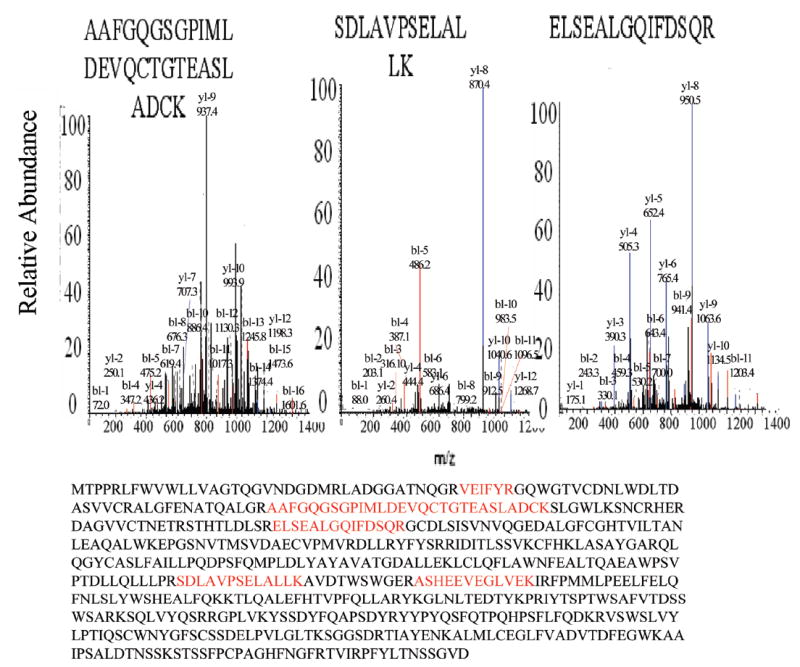
LTQ analysis of several peptides identified as Galectin-3-binding Protein. MS/MS sequencing data of peptides identified in the eluted fraction in 6 out of 10 runs of the aggressive MCF10CA1a cell sample with an average spectral count of 24 but absent in MCF10AT1 samples for Con A extracted proteins. In the WGA extracted proteins, the spectral count in MCF10AT1 and MCF10CA1a were 0 and 18 respectively.
CD44 is a transmembrane glycoprotein that is widely expressed in virtually all cell types. It functions as an extracellular matrix receptor involved in cell-cell and cell-matrix interactions and may also participate in growth regulation by presenting growth factors to their cell surface receptors.34 The interaction of CD44 with the cytoskeleton and various signaling molecules plays a pivotal role in promoting invasive and metastatic specific tumor phenotypes such as MMP-mediated matrix degradation, tumor cell growth, migration, and invasion.35-38 We and others have shown that the expression of certain CD44 variant (CD44v) isoforms is closely associated with breast cancer progression.39-43 In our analysis of ConA extracted proteins, there was only one peptide detected for each run, but in 10 out of 20 runs CD44 protein was detected with an average spectral count of 2–5 in MCF10AT1 and MCF10CA1a samples. However, a much larger ratio was found in the WGA extracted protein samples, where the spectral count in MCF10AT1 and MCF10CA1a was 8 and 91 respectively. The relatively high expression of CD44 in MCF10CA1a cells is consistent with a role for CD44 in breast cancer progression. The LC–MS/MS spectrum of several CD44 peptides identified is shown in Figure 7.
Figure 7.

LTQ analysis of peptide identified as CD44 antigen. In the analysis of ConA extracted proteins, MS/MS sequencing data of peptide identified in the eluted fraction was in 10 out of 20 runs with an average spectral count of 2–5 in MCF10AT1 and MCF10CA1a samples. In the WGA extracted protein samples, the spectral count in MCF10AT1 and MCF10CA1a was 8 and 91, respectively.
Syndecan is a four-membered cell membrane proteoglycan that carries various modifications of its ectodomain with heparan sulfate (HS) glucosaminoglycan chains. The protein is involved in both normal and pathological events as a cell surface receptor. Among the family of syndecans, syndecan-1 has most extensively been studied and its expression has been correlated with many types of cancers. Previous research has suggested that loss of syndecan-1 has a strong association with aggressive phenotypes of cancers and poor prognosis44,45 Mukunyadzi et al.46 demonstrated diminished levels of syndecan-1 expression in 100% of specimens of invasive SCCA (squamous cell carcinoma.) of the head and neck and observed that expression of syndecan-1 was higher in well-differentiated tumors compared with poorly differentiated specimens. A correlation between reduced syndecan-1 expression and histological dedifferentiation has been described by other authors.47 These data suggest that loss of syndecan-1 occurs during the process of cellular transformation to dysplasia and carcinoma. Consistent with these studies, we found that the expression of syndecan-1 was significantly decreased in the metastatic MCF10CA1a cell line relative to the nonmetastatic MCF10AT1 cell line. The LC–MS/MS spectrum of syndecan-1 protein peptide identified is shown in Figure 8.
Figure 8.
LTQ analysis of peptide identified as Syndecan-1 Protein. MS/MS sequencing data of peptide identified in the eluted fraction in 7 out of 10 runs of MCF10AT1 cell sample with an average spectral count of 55 and in 3 out of 10 runs in MCF10CA1a samples for Con A extracted proteins. In the WGA extracted proteins, the spectral count in MCF10AT1 and MCF10CA1a were 17 and 9, respectively.
Membrane proteins have important roles in many cellular processes. They are essential for cells to maintain the integrity of their infrastructure, and to segregate processes within intracellular compartments. Around 70% of all known pharmaceutical drug targets are membrane proteins. Study of the membrane proteome is important for both the understanding of the biology of diseases and for biomarker discovery, but also for enhancement of the drug discovery process. Two-dimensional polyacrylamide gel electrophoresis (2-D PAGE) coupled with highly solubilizing reagents has previously been the most employed technique for the identification of membrane proteins. However, the first separation dimension of 2D PAGE, isoelectric focusing is inherently difficult with membrane proteins because of their hydrophobic nature and their tendency to precipitate at their isoelectric point. In addition, extraction of tryptic peptides resulting from in-gel digestion of a membrane protein from a 2D gel for MS-based identification is difficult due to the hydrophobic nature of the resulting peptides, resulting in low recovery and low sequence coverage. In recent work by O’Neill48 intact membrane proteins were separated by hydrophobicity in the first dimension using nonporous reversed phase high-performance liquid chromatography (RP-HPLC) to generate unique chromatographic profiles. The subsequent fractions of eluent were separated using sodium dodecyl sulfate-polyacrylamide gel electrophoresis (SDS-PAGE) to create distinct banding patterns. This hybrid liquid phase/gel phase method also known as chromatophoresis circumvents issues of membrane protein precipitation and provides a simple strategy aimed at isolating and characterizing a traditionally underrepresented protein class. Other studies have involved surface biotinylation prior to membrane isolation.49 Three methods, including the use of detergents,50,51 organic solvents,15,52,53 and organic acids,54 have been used to solubilize enriched membrane fractions. These solubilization methods are compatible with subsequent proteolytic digestion and chemical cleavage, chromatography separation, and MS analysis, but these procedures often have low yields and proteins from specific membrane compartments cannot be isolated.
Many studies have been applied to improve protein characterization and quantitation. Stable isotope labeling of amino acids in cell culture (SILAC) is a common strategy for protein quantification. Although this method can provide accurate quantitative results, it suffers from an experimental dynamic range limitation of 20:1 and also can be applied to growing cells in culture thus limiting its application. The Click-It glycoprotein labeling method55 is a useful quantitation technique for glycoprotein studies. In this technique, azide-modified sugars can be incorporated into protein glycan structures metabolically or enzymatically. During nascent protein synthesis the azide-modified amino acid (L-AHA) can be incorporated into the peptide, and a “click” reaction between the azide and an alkyne1 can be utilized to sensitively detect such labeled glycoproteins. In comparison, the label-free approaches to quantitative proteomics have gained prominence in recent years since no additional chemistry or sample preparation steps are required. Quantitation of protein levels from different samples based on the number of MS/MS spectra that identify the protein of interest (spectral counting) was used in this work.
In this study, we have developed an approach that extracts membrane proteins using a nonionic detergent then enriches glycoproteins by passage through lectin affinity columns. The protein recovery method is followed by digestion of proteins into peptides for analysis by mass spectrometry. A spectral counting, label-free technique was used for quantitiative comparisons. This strategy, which is based on the intrinsic properties of membrane proteins, enables the bypassing of inefficient steps normally employed for membrane protein characterization. The approach avoids many of the difficulties associated with the hydrophobic nature, and hence poor solubility, of membrane glycoproteins and also the limited amount of such proteins that may be available in a complex biological mixture. The use of an all liquid phase procedure makes the detailed analyses of membrane glycoproteins compatible with mass spectrometry analysis and the application of a label-free spectral count technique facilitates the identification of potential biomarkers by revealing differential expression profiles that correlate with the distinct phenotype of cancer cells.
4. Conclusion
In this work, an aggressively malignant human breast cancer cell line, MCF10CA1a, and a preneoplastic human breast cell line MCF10AT1 were examined for differential expression of membrane glycoproteins using a newly optimized combination of protein extraction and enrichment approaches. Such methods have not been previously reported for the comparison of premalignant versus malignant breast cells. A total of 171 proteins were positively identified in ConA lectin enriched protein samples and 167 proteins in WGA enriched samples. It was found that a lysis method that used a nonionic detergent and protease inhibitor cocktail provided better results than a commercial membrane extraction kit. The application of multiple downstream lectins in affinity columns will enable maximal glycoprotein yields. While no overall differences in the pI or molecular weight ranges of the glycoproteins were revealed by comparison of the malignant and nonmalignant cell lines, a label free spectral counting technique identified as many as 27 differentially expressed specific membrane glycoproteins. Among the proteins associated with the malignant phenotype, Gamma-glutamyl hydrolase, CD44, Galectin-3-binding protein and Syndecan-1 protein have been reported as potential biomarkers of breast cancer. The findings demonstrate the utility of the membrane glycoprotein extraction and enrichment technique for the global screening of complex biological samples. This work expands our tissue proteome capabilities from the analysis of soluble proteins in previous studies56,57 to the examination of membrane proteins. Although this work was performed in cell lines, it is feasible that the described nonlabel strategy can be otpimized for small amounts of tissue sample. The ability to enhance analysis of differentially expressed membrane glycoproteins in human tumor cells and tissues will facilitate biomarker and therapeutic target discovery.
Acknowledgments
This work was supported in part by the National Cancer Institute under grants R01CA100104 (D.M.L.), R01CA90503 (F.R.M.), and R01CA108597 (S.G.) and the National Institute of Health under grant R01GM49500 (D.M.L.).
Footnotes
Supporting Information Available: Table S1 summarizing all of the protein IDs obtained from analysis of all of the samples. This material is available free of charge via the Internet at http://pubs.acs.org.
References
- 1.Ng RCY, Roberts AN, Wilson RG, Latner AL, Turner GA. Br J Cancer. 1987;55:249–254. doi: 10.1038/bjc.1987.48. [DOI] [PMC free article] [PubMed] [Google Scholar]
- 2.Drake RR, Schwegler EE, Malik G, Diaz J, Block T, Mehta A, Semmes OJ. Mol Cell Proteomics. 2006;5:1957–1967. doi: 10.1074/mcp.M600176-MCP200. [DOI] [PubMed] [Google Scholar]
- 3.Kasbaoui L, Harb J, Bernard S, Meflah K. Cancer Res. 1989;49:5317–5322. [PubMed] [Google Scholar]
- 4.Kellokumpu S, Sormunen R, Kellokumpu M. Febs Lett. 2002;516:217–224. doi: 10.1016/s0014-5793(02)02535-8. [DOI] [PubMed] [Google Scholar]
- 5.Peracaula R, Tabares G, Royle L, Harvey DJ, Dwek RA, Rudd PM, de Llorens R. Glycobiology. 2003;13:457–470. doi: 10.1093/glycob/cwg041. [DOI] [PubMed] [Google Scholar]
- 6.O’Brien TJ, Beard JB, Underwood LJ, Dennis RA, Santin AD, York L. Tumor Biol. 2001;22:348–366. doi: 10.1159/000050638. [DOI] [PubMed] [Google Scholar]
- 7.Nustad K, Bast RC, Obrien TJ, Nilsson O, Seguin P, Suresh MR, Saga T, Nozawa S, Bormer OP, deBruijn HWA, Nap M, Vitali A, Gadnell M, Clark J, Shigemasa K, Karlsson B, Kreutz FT, Jette D, Sakahara H, Endo K, Paus E, Warren D, Hammarstrom S, Kenemans P, Hilgers J. Tumor Biol. 1996;17:196–219. doi: 10.1159/000217982. [DOI] [PubMed] [Google Scholar]
- 8.Cirisano FD, Karlan BY. J Soc Gynecol Invest. 1996;3:99–105. [PubMed] [Google Scholar]
- 9.Bubley GJ, Carducci M, Dahut W, Dawson N, Daliani D, Eisenberger M, Figg WD, Freidlin B, Halabi S, Hudes G, Hussain M, Kaplan R, Myers C, Oh W, Petrylak DP, Reed E, Roth B, Sartor O, Scher H, Simons J, Sinibaldi V, Small EJ, Smith MR, Trump DL, Vollmer R, Wilding G. J Clin Oncol. 1999;17:3461–3467. doi: 10.1200/JCO.1999.17.11.3461. [DOI] [PubMed] [Google Scholar]
- 10.Qiu RQ, Zhang X, Regnier FE. J Chromatogr B: Anal Technol Biomed Life Sci. 2007;845:143–150. doi: 10.1016/j.jchromb.2006.08.007. [DOI] [PubMed] [Google Scholar]
- 11.Zhang H, Yi EC, Li XJ, Mallick P, Kelly-Spratt KS, Masselon CD, Camp DG, Smith RD, Kemp CJ, Aebersold R. Mol Cell Proteomics. 2005;4:144–155. doi: 10.1074/mcp.M400090-MCP200. [DOI] [PubMed] [Google Scholar]
- 12.Hancock WS, Hincapie M, Plavina T. Mol Cell Proteomics. 2006;5:S348–S348. [Google Scholar]
- 13.Lotan R, Nicolson GL. Biochim Biophys Acta. 1979;559:329–376. doi: 10.1016/0304-4157(79)90010-8. [DOI] [PubMed] [Google Scholar]
- 14.Metzelaar MJ, Wijngaard PLJ, Peters PJ, Sixma JJ, Nieuwenhuis HK, Clevers HC. J Biol Chem. 1991;266:3239–3245. [PubMed] [Google Scholar]
- 15.Blonder J, Terunuma A, Conrads TR, Chan KC, Yee C, Lucas DA, Schaefer CF, Yu LR, Issaq HJ, Veenstra TD, Vogel JC. J Invest Dermatol. 2004;123:691–699. doi: 10.1111/j.0022-202X.2004.23421.x. [DOI] [PubMed] [Google Scholar]
- 16.Santner SJ, Dawson PJ, Tait L, Soule HD, Eliason J, Mohamed AN, Wolman SR, Heppner GH, Miller FR. Breast Cancer Res Treat. 2001;65:101–110. doi: 10.1023/a:1006461422273. [DOI] [PubMed] [Google Scholar]
- 17.Dawson PJ, Wolman SR, Tait L, Heppner GH, Miller FR. Am J Pathol. 1996;148:313–319. [PMC free article] [PubMed] [Google Scholar]
- 18.Keller A, Nesvizhskii AI, Kolker E, Aebersold R. Anal Chem. 2002;74:5383–5392. doi: 10.1021/ac025747h. [DOI] [PubMed] [Google Scholar]
- 19.Mega T, Oku H, Hase S. J Biochem. 1992;111:396–400. doi: 10.1093/oxfordjournals.jbchem.a123768. [DOI] [PubMed] [Google Scholar]
- 20.Ohyama Y, Kasai KI, Nomoto H, Inoue Y. J Biol Chem. 1985;260:6882–6887. [PubMed] [Google Scholar]
- 21.Liu HB, Sadygov RG, Yates JR. Anal Chem. 2004;76:4193–4201. doi: 10.1021/ac0498563. [DOI] [PubMed] [Google Scholar]
- 22.Bakry N, Kamata Y, Simpson LL. J Pharmacol Exp Ther. 1991;258:830–836. [PubMed] [Google Scholar]
- 23.Zhang B, VerBerkmoes NC, Langston MA, Uberbacher E, Hettich RL, Samatova NF. J Proteome Res. 2006;5:2909–2918. doi: 10.1021/pr0600273. [DOI] [PubMed] [Google Scholar]
- 24.Galivan J, Ryan TJ. In: Handbook of Proteolytic Enzymes. Barrett AJ, Rawlings ND, Woessner JF, editors. Academic Press; San Diego: 1998. pp. 783–786. [Google Scholar]
- 25.Galivan J, Ryan TJ, Chave K, Rhee M, Yao R, Yin DZ. Pharmacol Ther. 2000;85:207–215. doi: 10.1016/s0163-7258(99)00063-7. [DOI] [PubMed] [Google Scholar]
- 26.McGuire JJ, Coward JK. In: Folates and Pterins. Blakley RL, Benkovic SJ, editors. Vol. 1. Wiley; New York: 1984. pp. 136–189. [Google Scholar]
- 27.Schneider E, Ryan TJ. Clin Chim Acta. 2006;374:25–32. doi: 10.1016/j.cca.2006.05.044. [DOI] [PubMed] [Google Scholar]
- 28.Baggott JE, Heimburger DC, Krumdieck CL, Butterworth CE. Am J Clin Nutr. 1987;46:295–301. doi: 10.1093/ajcn/46.2.295. [DOI] [PubMed] [Google Scholar]
- 29.He P, Varticovski L, Bowman ED, Fukuoka J, Welsh JA, Miura K, Jen J, Gabrielson E, Brambilla E, Travis WD, Harris CC. Hum Pathol. 2004;35:1196–1209. doi: 10.1016/j.humpath.2004.06.014. [DOI] [PubMed] [Google Scholar]
- 30.Finak G, Sadekova S, Pepin F, Hallett M, Meterissian S, Halwani F, Khetani K, Souleimanova M, Zabolotny B, Omeroglu A, Park M. Breast Cancer Res. 2006;8 doi: 10.1186/bcr1608. [DOI] [PMC free article] [PubMed] [Google Scholar]
- 31.Iacobelli S, Arno E, Dorazio A, Coletti G. Cancer Res. 1986;46:3005–3010. [PubMed] [Google Scholar]
- 32.Bair EL, Nagle RB, Ulmer TA, Laferte S, Bowden GT. Prostate. 2006;66:283–293. doi: 10.1002/pros.20343. [DOI] [PubMed] [Google Scholar]
- 33.Mbeunkui F, Metge BJ, Shevde LA, Pannell LK. J Proteome Res. 2007;6:2993–3002. doi: 10.1021/pr060629m. [DOI] [PMC free article] [PubMed] [Google Scholar]
- 34.Lesley J, Hyman R, Kincade PW. Adv Immunol. 1993;54:271–335. doi: 10.1016/s0065-2776(08)60537-4. [DOI] [PubMed] [Google Scholar]
- 35.Lesley J, Hascall VC, Tammi M, Hyman R. J Biol Chem. 2000;275:26967–26975. doi: 10.1074/jbc.M002527200. [DOI] [PubMed] [Google Scholar]
- 36.Yang BH, Yang BL, Savani RC, Turley EA. Embo J. 1994;13:286–296. doi: 10.1002/j.1460-2075.1994.tb06261.x. [DOI] [PMC free article] [PubMed] [Google Scholar]
- 37.Liao HX, Lee DM, Levesque MC, Haynes BF. J Immunol. 1995;155:3938–3945. [PubMed] [Google Scholar]
- 38.Bourguignon LYW. J Mammary Gland Biol Neoplasia. 2001;6:287–297. doi: 10.1023/a:1011371523994. [DOI] [PubMed] [Google Scholar]
- 39.Iida N, Bourguignon LYW. J Cell Physiol. 1995;162:127–133. doi: 10.1002/jcp.1041620115. [DOI] [PubMed] [Google Scholar]
- 40.Al-Hajj M, Wicha MS, Benito-Hernandez A, Morrison SJ, Clarke MF. Proc Natl Acad Sci U S A. 2003;100:3983–3988. doi: 10.1073/pnas.0530291100. [DOI] [PMC free article] [PubMed] [Google Scholar]
- 41.Woodman AC, Sugiyama M, Yoshida K, Sugino T, Borgya A, Goodison S, Matsumura Y, Tarin D. Am J Pathol. 1996;149:1519–1530. [PMC free article] [PubMed] [Google Scholar]
- 42.Kaufmann M, Heider KH, Sinn HP, Vonminckwitz G, Ponta H, Herrlich P. Lancet. 1995;345:615–619. doi: 10.1016/s0140-6736(95)90521-9. [DOI] [PubMed] [Google Scholar]
- 43.Dall P, Heider KH, Hekele A, Vonminckwitz G, Kaufmann M, Ponta H, Herrlich P. Cancer Res. 1994;54:3337–3341. [PubMed] [Google Scholar]
- 44.Liebersbach BF, Sanderson RD. J Biol Chem. 1994;269:20013–20019. [PubMed] [Google Scholar]
- 45.Shinyo Y, Kodama J, Hasengaowa, Kusumoto T, Hiramatsu Y. Gynecol Oncol. 2005;96:776–783. doi: 10.1016/j.ygyno.2004.11.004. [DOI] [PubMed] [Google Scholar]
- 46.Mukunyadzi P, Liu K, Hanna EY, Suen JY, Fan CY. Modern Pathol. 2003;16:796–801. doi: 10.1097/01.MP.0000081731.17549.53. [DOI] [PubMed] [Google Scholar]
- 47.Soukka T, Pohjola J, Inki P, Happonen RP. J Oral Pathol Med. 2000;29:308–313. doi: 10.1034/j.1600-0714.2000.290704.x. [DOI] [PubMed] [Google Scholar]
- 48.O’Neill KA, Miller FR, Barder TJ, Lubman DM. Proteomics. 2003;3:1256–1269. doi: 10.1002/pmic.200300446. [DOI] [PubMed] [Google Scholar]
- 49.Zhao YX, Zhang W, Kho YJ, Zhao YM. Anal Chem. 2004;76:1817–1823. doi: 10.1021/ac0354037. [DOI] [PubMed] [Google Scholar]
- 50.Han DK, Eng J, Zhou HL, Aebersold R. Nat Biotechnol. 2001;19:946–951. doi: 10.1038/nbt1001-946. [DOI] [PMC free article] [PubMed] [Google Scholar]
- 51.Quach TTT, Li N, Richards DP, Zheng J, Keller BO, Li L. J Proteome Res. 2003;2:543–552. doi: 10.1021/pr0340126. [DOI] [PubMed] [Google Scholar]
- 52.Wigley WC, Vijayakumar S, Jones JD, Slaughter C, Thomas PJ. Biochemistry. 1998;37:844–853. doi: 10.1021/bi972293n. [DOI] [PubMed] [Google Scholar]
- 53.Zhang N, Chen R, Young N, Wishart D, Winter P, Weiner JH, Li L. Proteomics. 2007;7:484–493. doi: 10.1002/pmic.200600518. [DOI] [PubMed] [Google Scholar]
- 54.Washburn MP, Wolters D, Yates JR. Nat Biotechnol. 2001;19:242–247. doi: 10.1038/85686. [DOI] [PubMed] [Google Scholar]
- 55.www.invitrogen.com
- 56.Zhao J, Zhu K, Lubman DM, Miller FR, Shekhar MPV, Gerard B, Barder TJ. Proteomics. 2006;6:3847–3861. doi: 10.1002/pmic.200500195. [DOI] [PubMed] [Google Scholar]
- 57.Hamler RL, Zhu K, Buchanani NS, Kreunin P, Kachman MT, Miller FR, Lubman DM. Proteomics. 2004;4:562–577. doi: 10.1002/pmic.200300606. [DOI] [PubMed] [Google Scholar]