

Abstract
Fetal growth restriction is often caused by uteroplacental insufficiency that leads to fetal hypoxia and nutrient deprivation. Elevated IGF binding protein (IGFBP)-1 expression associated with fetal growth restriction has been documented. In this study we tested the hypothesis that hypoxia and nutrient deprivation induce IGFBP-1 phosphorylation and increase its biological potency in inhibiting IGF actions. HepG2 cells were subjected to hypoxia and leucine deprivation to mimic the deprivation of metabolic substrates. The total IGFBP-1 levels measured by ELISA were approximately 2- to 2.5-fold higher in hypoxia and leucine deprivation-treated cells compared with the controls. Two-dimensional immunoblotting showed that whereas the nonphosphorylated isoform is the predominant IGFBP-1 in the controls, the highly phosphorylated isoforms were dominant in hypoxia and leucine deprivation-treated cells. Liquid chromatography-tandem mass spectrometry analysis revealed four serine phosphorylation sites: three known sites (pSer 101, pSer 119, and pSer 169); and a novel site (pSer 98). Liquid chromatography-mass spectrometry was used to estimate the changes of phosphorylation upon treatment. Biacore analysis indicated that the highly phosphorylated IGFBP-1 isoforms found in hypoxia and leucine deprivation-treated cells had greater affinity for IGF-I [dissociation constant 5.83E (times 10 to the power)−10 m and 6.40E−09 m] relative to the IGFBP-1 from the controls (dissociation constant ∼1.54E−07 m). Furthermore, the highly phosphorylated IGFBP-1 had a stronger effect in inhibiting IGF-I-stimulated cell proliferation. These findings suggest that IGFBP-1 phosphorylation may be a novel mechanism of fetal adaptive response to hypoxia and nutrient restriction.
The use of HepG2 cells demonstrates that IGF binding protein-1 hyper-phosphorylation may be a novel mechanism of fetal adaptive response to hypoxia and under-nutrition.
IGF binding protein (IGFBP)-1 is a major IGFBP in pregnancy that modulates the cellular actions of IGFs (1). IGFBP-1 is synthesized predominantly by the maternal and fetal liver and by the maternal decidua during pregnancy (2,3). Recent in vivo data show that fetal overexpression of IGFBP-1 inhibits fetal growth in mice (4,5) and that IGFBP-1 contributes to fetal growth restriction (FGR) by inhibiting IGF-mediated fetal growth (6,7,8,9).
IGFBP-1 is a metabolically regulated protein and is suggested to have an important role in glucose homeostasis (10). The expression of IGFBP-1 is dynamically influenced by nutritional status, increasing during fasting, malnutrition, and diabetes while decreasing upon insulin treatment (11,12,13). Inhibition of IGFBP-1 production by insulin (14,15) is one of the potential mechanisms in regulation of fetal growth (16,17,18).
Recent studies also suggest that induction of the IGFBP-1 expression under hypoxia and other catabolic conditions is an evolutionarily conserved mechanism. The biological significance of IGFBP-1 induction is to reduce the availability of IGFs to their receptors, and to divert the limited energy resources away from growth and development toward those metabolic processes essential for survival (7,9,19,20).
The biological effect of IGFBP-1 depends not only on the total protein levels, but also on its proteolysis (21) and phosphorylation state (22,23). It has been reported that phosphorylation of IGFBP-1 at certain sites can increase its binding affinity for IGF-I and, thus, restricts IGF-I’s bioavailability for binding its receptor (24). In addition, phosphorylation makes IGFBP-1 more resistant to proteolysis (25), therefore, accentuating its inhibitory effect on IGF-I.
Exposing HepG2 cells to hypoxia and leucine derivation treatment significantly induced IGFBP-1 mRNA and protein expression (26,27,28), however, it is not clear whether hypoxia and leucine deprivation treatments also affect the phosphorylation states and biological activity of IGFBP-1. The objectives of this study were to examine possible changes in IGFBP-1 phosphorylation status induced by hypoxia and leucine deprivation, determine the major phosphorylation sites, and investigate the biological and physiological relevance.
Materials and Methods
Materials
All chemicals used were of electrophoresis or analytical grade. Human hepatocellular carcinoma cell line HepG2 and human embryonic kidney (HEK) 293 cells were purchased from American Type Culture Collection (Manassas, VA). Antihuman IGFBP-1 monoclonal antibody (Mab 6303) was from Medix Biochemica (Kauniainen, Finland), and antihuman IGFBP-1 polyclonal was a gift from Dr. R. Baxter of the Kolling Institute of Medical Research (Sydney, Australia). Horseradish peroxidase (HRP)-conjugated secondary antibodies were goat antirabbit or goat antimouse (Bio-Rad Laboratories, Inc., Hercules, CA). ELISA kits for total and serine phosphorylated IGFBP-1 were from Diagnostic Systems Laboratories, Inc. (Webster, TX). The total albumin ELISA kit was from Bethyl Laboratories, Inc. (Montgomery, TX). The total protein was measured by Bradford assay (Bio-Rad Laboratories).
Phosphopeptide enrichment was performed using titanium dioxide (TiO2) (Titansphere TiO; GL Sciences Inc., Tokyo, Japan). The interaction of IGF-I and IGFBP-1 was analyzed using surface plasmon resonance (SPR) using Biacore X instrument (Biacore, Inc., Piscataway, NJ) with sensor chips CM5. The amine coupling was performed using N-hydroxysuccinimide, N-ethyl-N-(3-diethylaminopropyl) carbodiimide, and ethanolamine hydrochloride. The sensor chips and all the chemicals for Biacore were from GE Healthcare Bio-Sciences AB (Piscataway, NJ). Recombinant human IGF-I (rIGF-I) was a gift from Dr. George Bright of Tercica Inc. (Brisbane, CA).
HepG2 cell culture and treatment conditions
HepG2 cells were grown at 37 C under 95% air, 5% CO2 in DMEM/F-12 with 10% (vol/vol) fetal bovine serum (FBS) (Life Technologies, Inc.; Invitrogen Corp., Carlsbad, CA). Cells grown to approximately 90% confluence were trypsinized, counted, replated on 100 × 20-mm plates (Falcon; BD Biosciences, Franklin Lakes, NJ) at a density of 1.4 × 10⁴ cells per ml, and incubated in DMEM/F-12 containing 10% FBS for 24 h until approximately 70% confluence.
Hypoxic treatments
Before treatment, the cells were rinsed twice and incubated for 3 h in FBS-free DMEM/F-12. The media were then replaced with new FBS-free DMEM/F-12 and cells immediately placed in a modular incubator chamber (Billups-Rothenberg Inc., Del Mar, CA) that was flushed with 1% O2, and 5% CO2 with the bulk N2. The cells in the sealed hypoxic chamber were placed in the incubator (20% O2) with cells cultured normally (controls). Oxygen content in the hypoxic chamber was monitored at 12-h intervals with a Hudson 5590 Oxygen Monitor (Hudson, Ventronics Division, Temecula, CA). The partial pressure measurements for pO2 and pCO2, as well as pH evaluations, were made using an ABL700 series blood gas analyzer (Radiometer, Copenhagen, Denmark). After treatment, conditioned media (CM) were collected at 48 h (26,27). Samples were centrifuged at 1200 rpm for 10 min and aliquots of the supernatants stored at −20 C.
Leucine deprivation treatments
Media containing various concentrations of the essential amino acid leucine were prepared from DMEM/F-12 lacking methionine, leucine, lysine, and glutamine, and various salts (Sigma-Aldrich Corp., St. Louis, MO). Cell media were formulated by adding the missing amino acids and salt components to make it consistent with normal DMEM/F-12, except for leucine, which was added in 450 (equivalent to DMEM/F-12), 140, 70, and 0 μm concentrations. Once cells were approximately 70% confluent, they were washed and incubated for 3 h with the specially formulated FBS-free DMEM/F-12 (with 450 μm leucine). Cells were then rinsed with FBS-free DMEM/F-12 (0 μm leucine) and finally incubated with FBS-free DMEM/F-12 containing various concentrations of leucine as described earlier. The CM were collected after 16 h incubation (27), centrifuged at 1200 rpm for 10 min, and stored at −20 C.
Western immunoblot and ligand blot analysis for IGFBP-1
All protein separations were conducted using 1.5 mm 12% sodium dodecyl sulfate polyacrylamide gels using MagicMark XP (Invitrogen) Mr marker. Crude amniotic fluid from a healthy pregnancy was used as a positive control. For IGFBP-1 expression, equal volumes (10 or 15 μl) of direct CM samples were obtained from cells grown in incubator air (2O% O2) and hypoxia (1% O2), and from cells cultured with leucine (450 μm leucine) and leucine deprived (0 μm leucine) conditions in all analysis unless specified otherwise. Immunoblot analysis was performed using wet transfer (29), and membranes were blocked using 4% BSA. IGFBP-1 Mab 6303 (1:10,000 dilution) was used as the primary antibody and HRP-conjugated goat antimouse IgG (1:8,000 dilution) as the secondary antibody. Western Lighting Enhanced Chemiluminescence (ECL) Reagent Plus (PerkinElmer, Boston, MA) and Kodak XOMAT LS films (Eastman Kodak Co., Rochester, NY) were used for detection of proteins.
To detect other IGFBPs, 5 μl CM sample from HepG2 cells was used for ligand blot analysis using biotin-labeled rIGF-I (10 ng/ml) (30). Crude amniotic fluid was used as a positive control, and proteins were detected using HRP-conjugated streptavidin (1:1000 dilution) and the ECL Reagent Plus kit.
Two-dimensional (2-D) immunoblot analysis and evaluation of IGFBP-1 variants
Equal volumes (100 μl) of CM were desalted and concentrated 10-fold using 10-kDa Mr cutoff (MWCO) Centricon tubes (PALL Life Sciences, Ann Arbor, MI). Desalted samples were reconstituted with rehydration buffer {8 m urea, 2% (3-[(3-cholamidopropyl) dimethylammonio]- 1-propanesulfonate (CHAPS) (Bio-Rad), 50 mm dithiothreitol, 0.2% Biolyte (Bio-Rad), (pH 3–10 ampholyte), and 0.001% bromophenol blue} and transferred onto a polyvinylidene fluoride membrane by wet transfer (31). Membranes were blocked in 4% nonfat dry milk and then incubated overnight with IGFBP-1 polyclonal antibody (1:10,000 dilution). The goat antirabbit HRP-conjugated antibody (1:8000 dilution) was used as a secondary antibody, and proteins were visualized using the ECL Plus system.
The 16-bit digital images of the gels and immunoblots were acquired in the linear range under white light using the FluoroChem 8800 imaging system (Alpha Innotech Corp., San Leandro, CA). Three-dimensional (3-D) qualitative evaluation of IGFBP-1 isoforms on the blots was performed using PG220 software (Nonlinear Dynamics Ltd., Newcastle upon Tyne, UK).
The phosphorylation state of IGFBP-1 in CM was confirmed by pretreatment of the samples (100 μl) with calf intestinal alkaline phosphatase (AKP) (Sigma-Aldrich) (200 U) for 6 h at 37 C. The reaction was stopped by addition of rehydration buffer. The dephosphorylated protein samples were further analyzed for IGFBP-1 isoforms using 2-D immunoblotting as described previously.
Immunoassays for total and phosphorylated IGFBP-1
The phosphorylated IGFBP-1 ELISA is based on first capturing total phosphorylated and nonphosphorylated IGFBP-1 with an anti-IGFBP-1 monoclonal antibody (32); the captured serine phosphorylated IGFBP-1 is then selectively detected by a specific antiphosphoserine antibody labeled with HRP (33). Total IGFBP-1 levels in CM were normalized to total protein by the Bradford method. The total albumin levels in the same set of CM samples were analyzed by ELISA as per the manufacturer’s instructions.
Mass spectrometric (MS) analysis of IGFBP-1 phosphorylation
Sample preparation
For MS analysis of IGFBP-1 phosphorylation, samples were from control (2O% O2) and hypoxia (1% O2) and from cells cultured with leucine treatments (450 and 0 μm Leu) conditions. Equal volumes of CM (400 μl) were desalted (10 kDa MWCO) at 4 C with ammonium bicarbonate (ABC) buffer (pH 8.0). Samples were then separated on one-dimensional gels. To identify the band corresponding to IGFBP-1 on the gel, the lane with amniotic fluid (positive control) was excised for immunoblot analysis using Mab 6303. The remaining gel was fixed for 30 min (10% methanol and 7% acetic acid) and stained overnight with SYPRO Ruby (Invitrogen) stain. Gel images were captured under UV excitation with a SYPRO-500 filter. Using the immunoblot as a guide, the specific band on the gel corresponding to IGFBP-1 [∼28 kDa molecular mass (MW)] from different treatments was manually excised under UV light.
For in-gel digestion, the gel slices were cut into small cubes (∼1 mm3), transferred to siliconized Eppendorf tubes (Hamburg, Germany), and sequentially washed with 100 mm ABC buffer (pH 8.0), followed by acetonitrile (ACN). The samples were dried in a vacuum centrifuge. For reduction and alkylation, the gel pieces were treated with 10 mm dithiothreitol, followed by 100 mm iodoacetamide. Subsequently, proteins were digested with aspartate N-endoproteinase (Asp-N) (Sigma-Aldrich) (25 ng/μl), followed by sequencing grade trypsin (12.5 ng/μl) (Promega Corp., Madison, WI) at 37 C overnight. The gel was extracted with 30 μl ABC, 50% ACN, and 5% formic acid sequentially. The extracted peptides were dried and stored at −80 C.
Enrichment of IGFBP-1 phosphopeptides
Phosphorylated IGFBP-1 peptides were enriched using TiO2. In brief, the pelleted IGFBP-1 peptides after digestion were dissolved in 20 μl loading buffer [80% ACN and 1% trifluoroacetic acid (TFA)] and incubated with 1 μl TiO2 slurry (5 μm, ∼1 mg, in 50% ACN) for 20 min at room temperature on a shaker. The solution and TiO2 particles were transferred to a pipette tip with a piece of filter paper inserted at its end to serve as a frit. The tip was placed in a microcentrifuge tube and centrifuged for 5 min. The particles were washed using 20 μl loading buffer (50 mg/ml dihydroxybenzoic acid and 0.2% TFA in 40% ACN) and centrifuged again. The phosphopeptides were eluted using 20 μl elution buffer [5% ammonium hydroxide (pH 11.0)] and centrifuged for 10 min. To the receiving tube, 5 μl 5% TFA was added before eluting the bound phosphopeptides. The samples were dried in SpeedVac and reconstituted in 0.1% formic acid in water or in 50 mm EDTA in water before liquid chromatography-mass spectrometry (LC-MS) or liquid chromatography-tandem mass spectrometry (LC-MS/MS) analysis.
LC-MS/MS and LC-MS analysis for IGFBP-1 phosphoresidue identification
The enriched phosphopeptides were analyzed on a CapLC (Waters Corp., Milford, MA) coupled with a Quadrupole Time-of-Flight mass spectrometer (Global Ultima; Micromass, Manchester, UK) using a 5 μm × 0.5 mm C18 precolumn and a 75 μm × 150 mm analytical column (LC Packings, Amsterdam, The Netherlands) with a 300-nl/min flow rate through the analytical column. LC-MS/MS analysis was performed using a gradient elution and the data-dependent acquisition function (34). For estimations of the phosphorylation changes upon treatments, LC-MS analysis were performed on the same instrument setting. The selected ion chromatograms for different phosphopeptide peaks were plotted, and the spectra were summed. The intensities of the phosphopeptide peaks in the summed spectra were used for the semiquantitative determination of the relative amounts of phosphopeptide in the samples from control to treatment conditions.
LC-MS/MS spectra were processed using the Maxnt 3 function in Masslynx software (version 4.0; Waters). Mascot (http://mascot.bio.nrc.ca/search_e.php; Matrix Science, Boston, MA) and PEAKS software were used to search Swiss-prot database for protein identification. Peptide mass/charge (m/z) tolerance was set to 1.2 and the peptide fragment ion tolerance to 0.1 Da. Asp-N and/or trypsin was designated as the protease, and up to one missed cleavage was allowed. Carbamidomethylation on cysteine residue was included as a fixed modification, whereas oxidation of methionine and phosphorylation of serine/threonine/tyrosine and tyrosyl residues were selected as a variable modification. Phosphopeptides identified were manually inspected to verify that the majority of high abundance peaks were y or b sequence ions, or y − H2O/H3PO4 or b − H2O/H3PO4 ions when appropriate. For all the phosphopeptides, their phosphorylation sites were verified manually.
SPR for binding characteristics of IGFBP-1 with IGF-I
The comparative measurements of the binding rate constants characteristic of IGFBP-1 and rIGF-I were performed using a Biacore X instrument. Seventy microliters of rIGF-I (10 μg/ml) diluted in 100 mm acetate buffer (pH 4.0) were immobilized to the Sensor Chip CM5 surface by amine coupling as per the manufacturer’s protocol. The rIGF-I immobilization was performed on a “sample flow cell,” that achieved approximately 4000–5000 resonance unit signals in three different experiments.
All CM samples were buffer exchanged with HBS EP buffer (pH 7.4) [10 mm HEPES, 150 mm NaCl, 3.4 mm EDTA, and 0.005% surfactant P20 (pH 7.4)], concentrated 10-fold, and serially diluted at analysis in the HBS EP buffer. The overabundance of IGFBP-1 and negligible IGFBP-3 secreted by HepG2 cells (35) discounted interference if any in Biacore analysis. IGF-I binding assay was additionally performed on dephosphorylated IGFBP-1, obtained by AKP treatment of hypoxia (1% pO2) and leucine deprivation (0 μm Leu) treated CM. The AKP reactions were performed as described earlier, except here the reactions were terminated using EDTA (final concentration, 50 mm) followed by immediate buffer exchange with HBS EP buffer.
In a typical binding experiment, 70 μl CM with various concentrations of analyte (70–700 nm) was injected for a 60-sec association phase in both reference and sample cells. The interaction of IGFBP-1 with the immobilized IGF-I was monitored until equilibrium was attained. The dissociation phase was initiated by passage of HBS EP buffer for a period of 1–3 min. The biosensor surfaces were regenerated by a 60-sec injection of 10–30 μl glycine buffer [50 mm (pH 2.0)] after each injection.
CM samples from three independent cell culture experiments for hypoxic and leucine deprivation treatments were analyzed in triplicate in random order and tested on at least three different sensor chips. A low immobilization level as well as a high flow rate (50 μl/min) and analyte concentrations limited the mass transport phenomenon. Furthermore, the resonance unit response was always reported as the difference between signals occurring from the sample and the reference cell (with no ligand). Therefore, bulk refractive index, background and nonspecific binding of the soluble ligands were always subtracted. Representative curves were generated for the association and dissociation phases, and kinetic data were analyzed using the BIAevaluation software version 3.0 (Biacore) as per 1:1 Langmuir binding model.
Biological assay of IGFBP-1 activity
The biological activity of IGFBP-1 in CM samples from HepG2 cells was studied using MTS assay (CellTiter 96 AOueous Non-Radioactive Cell Proliferation Assay; Promega). HEK293 cells were cultured in DMEM supplemented with 10% FBS, penicillin, and streptomycin in a humidified-air atmosphere containing 5% CO2. CM were collected from HepG2 cells grown in incubator air (2O% O2) and hypoxia (1% O2). The total IGFBP-1 concentrations in CM samples were estimated by ELISA as described previously. To eliminate possible effects of other factors in the CM from HepG2 cells, IGFBP-1 was depleted and used as a control. For this purpose, CM were incubated with a polyclonal rabbit antihuman IGFBP-1 antibody overnight at 4 C (1:500 dilution); 50 μl protein A-Sepharose was then added and rocked for another 4 h at 4 C. The CM were centrifuged, and the supernatants collected were used as controls. This IGFBP-1 depleted CM sample was also added to the IGF-I (25 nm) group. Various concentrations of IGFBP-1 (8.3, 25, or 75 nm) were added singly or with 25 nm IGF-I. The assays were terminated after 48 h following the manufacturer’s instructions.
Statistical evaluation
Statistical significance among each experimental group was determined by the unpaired t test. Values are represented as means ± sd. Statistical analysis was performed using GraphPad Prism 3.0 software (GraphPad Software Inc., San Diego, CA), and significance was accepted at P < 0.05.
Results
Effect of hypoxia and leucine deprivation on IGFBP-1 expression and phosphorylation in HepG2 cells
Air monitoring of the hypoxic chambers ensured desired levels of O2 in hypoxic treatments. Upon completion of the treatments (48 h), pO2 tension levels of CM showed an average (sem) 43.3 (1.53) and 133.3 (7.36) torr (mm Hg) for 1 and 20% O2 levels, respectively. The levels of pC02 remained relatively stable within time points tested, and pHs of the media between the hypoxic and control treatments were also comparable.
In agreement with previous reports (17,36,37), immunoblot analysis qualitatively indicates (Fig. 1A, lanes 1 and 2) that IGFBP-1 expression was induced in hypoxia (26,27). Similarly, leucine deprivation (0 μm leucine) also increased IGFBP-1 levels compared with cells cultured with high concentrations of leucine (450 μm leucine) (Fig. 1B, lanes 1 and 2). Modest increases in IGFBP-1 levels were found (data not shown) in cells cultured in lower leucine concentrations (70 and 140 μm leucine). Furthermore, ligand blot analysis results in Fig. 1C show detection of mainly IGFBP-1 (lane 1), suggesting a predominance of this protein and negligible levels of other IGFBPs in HepG2 CM (35).
Figure 1.

One-dimensional Western immunoblot. A, Samples are equal volumes of FBS-free CM from HepG2 cells cultured in incubator air (control, 20% O2) (lane 1) or under hypoxic (1% O2) (lane 2) conditions for 48 h. Lane 3 is amniotic fluid as a positive control. B, CM from HepG2 cells treated with 450 μm leucine (lane 1) and without (0 μm) leucine (lane 2). C, IGF-I ligand blot of CM from HepG2 cells (lane 1) and amniotic fluid as a positive control (lane 2). IGFBPs identified by their Mr are indicated. ELISA data indicating concentration of albumin as percentage (%) of total protein in samples from cells in incubator air (control, (20% O2) and hypoxic (1% O2) conditions, and with leucine (control, 450 μm) (D) and without (0 μm) leucine (E). Decreased levels of albumin in CM confirmed the effectiveness of the treatment conditions.
ELISA estimations in Fig. 1, D and E, show reduced concentration of albumin for both hypoxia and leucine deprivation. Albumin is a major mediator of the acute phase response to disturbances of homeostasis, mainly due to altered hepatic metabolism (38). Decreased plasma albumin being characteristic of a negative acute phase reaction and mimicked by HepG2 cells (37,39) in hypoxia confirmed effectiveness of the treatment, physiologically.
Identification of various IGFBP-1 phosphoisoforms isoforms in hypoxia and leucine deprivation
2-D immunoblot analysis was performed qualitatively to examine possible differential phosphorylation states in IGFBP-1 induced under hypoxic and leucine deprivation conditions. Data with CM from the control HepG2 cells show three spots (∼28 kDa) between pH 4.5 and 5.5, representing a mixture of non and variably phosphorylated IGFBP-1 variants (Fig. 2, A1 and B1). The 3-D densitometric view of the 2-D image shown in Fig. 2, A and B (panel 2), showed three major peaks. The change in IGFBP-1 isoelectric point (pI) caused by phosphorylation is estimated to be pH −0.09 for the first phosphorylation, −0.08 for the second and third, and −0.07 for the fourth subsequent (Scansite Mr and pI calculator; http://scansite.mit.edu). The pI difference between units illustrated in the 3-D view was manually estimated as pH approximately 0.1. Greater intensity toward the higher pH is indicative of less phosphorylated states (40). The peak in the most alkaline region is the nonphosphorylated variant. The other two spots represent medium and highly phosphorylated IGFBP-1 isoforms. It is evident from these results that HepG2 cells secrete a mixture of three major forms of IGFBP-1 with the nonphosphorylated isoform as the dominant one. To confirm this, the same CM sample was treated with AKP. As shown in panel 3, AKP treatment resulted in a single nonphosphorylated form. The results of the hypoxia group are shown in Fig. 2A, panels 4 and 5. There was an intense spot/peak in the more acidic region, representing the dominance of a highly phosphorylated isoform of IGFBP-1. AKP treatment shifted the majority of the IGFBP-1s to the alkaline region (panel 6), confirming the phosphorylation status.
Figure 2.

2-D Western immunoblot showing separation of the IGFBP-1 phosphoisoforms based on pI using CM from HepG2 cells. The samples were concentrated in 10 kDa MWCO centrifugal tubes and loaded on 7-cm immobilized pH gradient strips (pH 4–7). A, CM from cells grown in incubator air (control, 20% O2) (1) or hypoxic (1% O2) (4) conditions. The blot shown in A4 appears to have a higher intensity of IGFBP-1 with a single dominant phosphoisoforms shifted in pI toward acidic end compared with the control (A1). Shown in A2 and A5 are the 3-D densitometric views of the specified area. Blots in A3 and A6 are the same sample of A2 and A4, after treatment with AKP. B1 shows CM from cells grown in control (450 μm leucine), B4 in leucine deprived cells (0 μm leucine). Shown in B2 and B5 are the 3-D densitometric views of the specified spot areas. Blots in B3 and B6 are the same samples in B1 and B4 after treatment with AKP.
Figure 2B shows representative 2-D immunoblots of IGFBP-1 isoforms under the control (450 μm Leu) with three distinct IGFBP-1 isoforms (panel 1); the least or nonphosphorylated isoform is clearly the dominant form (Fig. 2B, panel 2). AKP treatment resulted in shifting of the other spots to the alkaline region (Fig. 2B, panel 3). In the leucine-deprived group (0 μm leucine), a higher proportion of medium and highly phosphorylated variants were observed. Two of the three spots found at around pH 4.5 had higher intensity (Fig. 2B, panels 4 and 5) compared with those of the control (Fig. 2B, panels 1 and 2). Although there was no marked reduction in the levels of nonphosphorylated isoform as seen in hypoxic experiments, a significant increase in intensity of some spots suggests higher levels of phosphorylated isoforms. AKP treatment shifted these phospho-IGFBP-1s to the alkaline region (Fig. 2B, panel 6). These data suggest that hypoxia and leucine deprivation increase the phosphorylation of IGFBP-1 in HepG2 cells.
It should be noted that a polyclonal IGFBP-1 is used in 2-D immunoblot analysis. The use of this polyclonal was essential because the monoclonal 6303 antibody was not efficient in detecting IGFBP-1 on 2-D immunoblots, possibly due to harsh sample preparation conditions in 2-D gel analysis.
Total and phosphorylated IGFBP-1 concentrations by ELISA
The effects of hypoxia and leucine deprivation on total IGFBP-1 and serine phosphorylated IGFBP-1 levels were determined and are represented as fold change in Fig. 3. As anticipated, the concentrations of total IGFBP-1 increased in both hypoxia and in leucine deprivation group. The levels of serine phosphorylated IGFBP-1 relative to their respective controls showed proportional increases (Fig. 3, A and B). The data indicate that an induction of total IGFBP-1 is accompanied by a proportional increase in IGFBP-1 phosphorylation.
Figure 3.
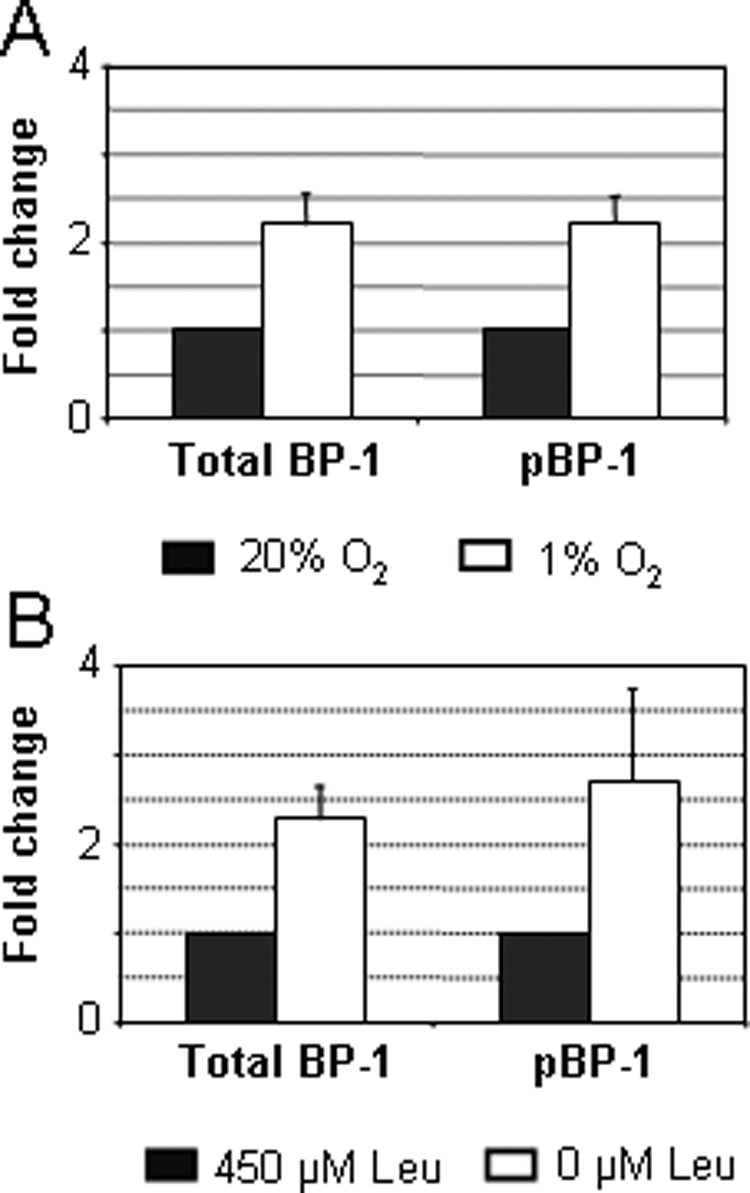
ELISA data indicating the change in total and phosphorylated IGFBP-1 isoforms from incubator air (control, 20% O2) to hypoxic (1% O2) condition (A) and control [450 μm leucine (Leu)] to leucine deprived (0 μm Leu) conditions (B).
Mass spectrometry for identification of phosphorylation sites of IGFBP-1
Three phosphorylation sites, Ser 101, Ser 119, and Ser 169, have been reported for IGFBP-1 (41). Upon sequential Asp-N and trypsin digestions, the following three phosphopeptides were detected, and the amino acid sequences [phosphoserine (pS) shown in parentheses] were confirmed by LC-MS/MS: DASAPHAAEAGSPESPEpS(101)TEITEEELL, 949.73 m/z, +3; DNFHLMAPpS(119)EE, 685.30 m/z, +2; and AQETpS(169) GEEISK, 629.78 m/z, +2. The phosphopeptides shown with their mass to charge ratios (m/z) were detected in samples from hypoxic (control, 20% O2 and hypoxia, 1% O2) and in leucine deprivation (450 and 0 μm leucine) treatments.
A new doubly phosphorylated peptide, DASAPHAAEAGSPEpS (98)PEpS(101)TEITEEELL, 976.42 m/z. +3 was also detected but only when analyzed with EDTA added to the sample. The modified protocol (34) increases the detection sensitivity of multiphosphorylated peptides. Using the CM from hypoxia treatments, the LC-MS/MS spectra are shown with a peak at 949.73 m/z for the single phosphorylated peptide at Ser 101 (Fig. 4A) and at 976.42 m/z for Ser 98 with Ser 101 (Fig. 4B). This doubly phosphorylated phosphopeptide was detected in two out of three samples from hypoxia but not with the controls (20% O2), or leucine deprivation (450 and 0 μm leucine) treatments.
Figure 4.

LC-MS/MS spectra showing newly identified phosphorylation site pSer 98 for IGFBP-1 secreted from HepG2 cells under hypoxic (1% O2) condition. The deconvoluted spectra of ion at 949.73 m/z are for the singly phosphorylated pSer 101 with peptide sequence shown in A and 976.42 m/z is for the doubly phosphorylated pSer 101 together with pSer 98 in B. Both ions were observed as triply charged ions. In spectrum A, intense b ions confirm the amino acid sequence of the peptide; the observed b18 ion at 1771.68 and the b18–98 ion at 1673.75 that is derived from b18 ion with a loss of H3PO4 indicate the phosphorylation on Ser (101) residue. In spectrum B, the precursor ion is 80 Da heavier than the ion in the spectrum A, indicating an additional phosphorylation; the observed b15 ion at 1458.63 and the b15–98 ion at 1360.59 indicate the phosphorylation on the Ser (98) in addition to the Ser 101.
Semiquantitation of the phosphorylation changes of IGFBP-1 induced by hypoxia and leucine deprivation
We next performed LC-MS analysis of TiO2 enriched IGFBP-1 phosphopeptides in CM from different treatments. IGFBP-1 phosphopeptide peak intensity ratios were calculated from the relative phosphopeptide peak intensities between the control and treated groups. The data from these experiments are summarized in Table 1. For the hypoxia experiment, pSer101, pSer 119, and pSer 169 all showed equal to or more than double increases in peak signal intensities relative to the control. Similarly, fold increases were also recorded for leucine deprivation from two out of three samples.
Table 1.
Ratios of IGFBP-1 phosphopeptide peak intensity in hypoxia (1% O2) and leucine-deprived (0 μm leucine) samples relative to controls (20% O2 and 450 μm leucine)
| Treatment | Average fold change in IGFBP-1 phosphopeptide peak intensity | ||
|---|---|---|---|
| Hypoxia/incubator air | pSer 101 | pS119a | pS169a |
| Mean | 3.17 | 2.07 | 4.22 |
| sd | 0.66 | 0.65 | 0.96 |
| 0/450 μm leucine | pSer 101a | pS119b | pS169a |
| Mean | 1.86 | 4.43 | 2.45 |
| sd | 1.10 | 0.28 | |
The relative peak intensity measurements for each set (control and treatment condition) were done sequentially to ensure identical analytical conditions in an individual experiment. Three MS analyses were done separately using samples collected from three independent cell culture experiments for both hypoxic and leucine-deprived treatments.
Two out of three experiments.
sd not determined because the intensity in one of the two control samples (450 μm Leu) was lower than the detection level.
The doubly phosphorylated peptide with pSer98 and pSer 101 was detected in the samples from hypoxia (1% O2) as shown in Fig. 4B. Due to the absence of pSer98 in the controls (20% O2), the fold increase upon treatment was not discernable. However, these results clearly indicate that pSer 98 was hyperphosphorylated in hypoxia. Being adjacent to the major site, it is possible that pSer98 acts with pSer101 in hypoxic stress to contribute to changes in IGFBP-1 functions.
It should be noted that the MS analysis was performed using three independent preparations from three separate cell culture experiments. Furthermore, the LC-MS analyses were performed using equal volumes of CM at different times; therefore, the data should be considered an estimate. Despite this caveat, the outcome of MS analysis is highly consistent with the results obtained by immunoblotting (Fig. 2, A and B) and ELISA (Fig. 3, A and B). Altogether, our LC/MS data clearly demonstrate (Table 1) that the phosphorylation of IGFBP-1 was consistently increased in hypoxia and in leucine deprivation treatment, but more prominently in hypoxia.
IGF-I binding kinetics using SPR analysis
Biacore biosensor measurements were performed to gain insight into the influences of phosphorylation on the ligand binding kinetics of the IGFBP-1 molecule. Hypoxia and leucine deprivation treatment lowered the equilibrium dissociation constant (KD) value of IGFBP-1 (Table 2). A representative comparison of association and dissociation phases of the interaction of IGFBP-1 with IGF-I, in control vs. the hypoxia group, is shown in Fig. 5A, and with leucine (450 μm Leu) and leucine deprivation (0 μm Leu) groups in Fig. 5B. Compared with IGFBP-1 prepared from the control cells, IGFBP-1 prepared from the hypoxic cells and the leucine-deprived cells exhibited slower dissociation rates, and the resultant complexes were more stable. Kinetic analysis of the biosensorgram curves demonstrates that the IGFBP-1 binding affinity for IGF-I under basal conditions was comparable to those reported previously using Biacore analysis (42). The estimations of the off rates suggest that binding interactions of IGFBP-1 with IGF-I were affected by both hypoxia and leucine deprivation but more significantly by hypoxia (Table 2). To ascertain that the changes in ligand binding kinetics were indeed due to elevated phosphorylation, these preparations were dephosphorylated and analyzed. The results showed that KD values were returned to the control levels (Table 2), suggesting that the changes in phosphorylation states are responsible for the changes in IGF binding affinity.
Table 2.
The kinetics of the affinity of IGFBP-1 for IGF-I assessed in triplicate by Biacore analysis for CM in hypoxia (1% O2) and leucine-deprived (450 μm leucine) samples relative to controls (incubator air, 20% O2 and 450 μm leucine)
| Samples | Ka (1/msec) | KD (1/sec) | KA (1/m) | KD (m) |
|---|---|---|---|---|
| Incubator air | ||||
| Mean | 4.89E+03 | 7.46E−04 | 6.57E+06 | 1.54E−07 |
| sd | 1.00E+01 | 1.05E−06 | 2.52E+04 | 1.00E−09 |
| Hypoxia | ||||
| Mean | 5.09E+03 | 2.97E−06 | 1.73E+09 | 5.83E−10 |
| sd | 1.00E+01 | 1.00E−08 | 1.00E+07 | 2.00E−12 |
| Dephosphorylated | ||||
| Mean | 1.50E+03 | 1.05E−03 | 1.38E+06 | 7.09E−07 |
| sd | 5.86E+00 | 4.16E−05 | 1.22E+03 | 1.29E−08 |
| 450 μm Leucine | ||||
| Mean | 7.64E+02 | 1.05E−03 | 6.50E+05 | 1.40E−07 |
| sd | 2.65E+00 | 5.03E−05 | 9.47E+04 | 4.93E−08 |
| 0 μm Leucine | ||||
| Mean | 1.56E+05 | 9.98E−04 | 1.57E+08 | 6.40E−09 |
| sd | 4.04E+02 | 1.80E−06 | 2.89E+05 | 5.7735E−12 |
| Dephosphorylated | ||||
| Mean | 2.43E+03 | 1.13E−03 | 1.08E+06 | 4.56E−07 |
| sd | 2.50E+01 | 2.00E−05 | 1.00E+01 | 7.21E−09 |
CM from hypoxic or leucine-deprived conditions were dephosphorylated by AKP and the kinetics reassessed. E, Times 10 to the power.
Figure 5.

The association and dissociation phases of concentration-dependent binding of IGFBP-1 to immobilized rIGF-I, comparing hypoxic or leucine depriving treatment of the HepG2 cells with controls. Analyte (IGFBP-1) is CM from HepG2 cells grown in incubator air (control, 20% O2) or hypoxia (1% O2) for 48 h (A) and control (450 μm Leu) and leucine deprived (0 μm leucine) treatments (B) for 16 h. The kinetic analysis shows alterations in dissociation phases for both hypoxic and leucine (Leu) treatments. Resp. Diff., Response unit differences.
Hypoxia treatment increases the biological potency of IGFBP-1 in inhibiting IGF actions
We next determined the functional significance of the hypoxia-induced IGFBP-1 hyperphosphorylation. Addition of IGF-I (25 nm) to cultured HEK293 cells resulted in a significant increase in cell number. Total IGFBP-1 isolated from direct CM from HepG2 cells grown in either incubator air (20% O2), or hypoxia (1% O2) inhibited IGF-I activity in a dose-dependent manner (Fig. 6). The IGFBP-1 sample derived from the hypoxia group was more potent than that from the 20% O2 group. At the highest dosage (75 nm) tested, it caused a 20% reduction in IGF-I-induced cell proliferation. In comparison, the less phosphorylated IGFBP-1 derived from the 20% O2 group only caused a 9% reduction. The difference was statistically significant (P < 0.05). A similar trend was also observed at low doses (25 nm), although the difference was not statistically significant. These functional data together with the binding kinetics data indicate that the hypoxia-induced IGFBP-1 phosphorylation increases its ability to inhibit IGF actions.
Figure 6.

Hypoxia-induced IGFBP-1 phosphorylation increases its ability to inhibiting IGF actions. IGFBP-1 prepared from HepG2 cells grown under 20% O2 (solid column) and 1% O2 (open column) and was added to cultured HEK293 cells with or with IGF-I at indicated concentrations. Values are represented as means ± sd of two independent assays, each performed in triplicates. Significance was accepted at P < 0.05 as shown in asterisk (*).
Discussion
Increased expression of IGFBP-1 has been considered a marker of metabolic irregularities in fetal nutrition (12,43,44) and in oxygen delivery (9,45) that are strongly linked to FGR (46,47,48). By subjecting human HepG2 cells to hypoxia and leucine deprivation (27,35,49,50,51), we demonstrated that hypoxia and leucine deprivation lead to altered phosphorylation states of IGFBP-1. We have identified pSer 169 as a major site of phosphorylation that may, along with pSer 101, be responsible for altering the affinity of hepatic IGFBP-1 with IGF-I. We have provided data suggesting that elevated phosphorylation of the IGFBP-1 molecule increases its IGF binding affinity. The highly phosphorylated IGFBP-1 also has greater biological activity in inhibiting IGF-I-stimulated cell proliferation. These findings suggest that IGFBP-1 phosphorylation may be a novel mechanism of fetal adaptive response to hypoxia and nutrient restriction.
Regulation of IGFBP-1 and modulation of IGF-I actions are highly dynamic and complex, particularly in human FGR (52). Besides the endocrine factors, IGFBP-1 is induced by a variety of catabolic conditions. For example, fasting, malnutrition, and protein restriction rapidly induce IGFBP-1 at the transcription level (19). The depletion of a single amino acid (arginine, cysteine, and all essential amino acids) is sufficient to induce IGFBP-1 expression in vitro. Other catabolic conditions regulating IGFBP-1 expression include endoplasmic reticulum stress and hypoxic stress (19).
Induction of IGFBP-1 to reduce IGF action is considered to be part of a regulatory mechanism during fetal development (17,53). The stress signaling events that alter IGFBP-1 expression have thus far been shown to be highly significant in signal transduction events (54). The impacts of chronic hypoxia (7,8,17,35,55) and poor nutrient transfer (20) to the fetus on regulation of the IGFBP-1 gene at the transcription level are well studied. Tazuke et al. (35) have identified a hypoxia response element located in intron 2 of the human IGFBP-1 gene responsible for the hypoxia response in cultured human HepG2 cells. Likewise, recent studies using zebrafish embryo show that the induction of IGFBP-1 gene expression by hypoxia is mediated through hypoxia-inducible factor 1 (HIF-1) both in vitro and in vivo, and the HIF-1 pathway is established in early embryonic stages (56). The functional importance of the HIF-1 pathway in hypoxia-induced IGFBP-1 gene expression (8,9) has been suggested to be a mechanism that in the human fetus could restrict IGF-mediated growth in utero.
The physiological role of IGFBP-1 depends not only on the levels of IGFBP-1 but also on its phosphorylation (57). Phosphorylation and glycosylation of proteins usually result in specific functional consequences or may be caused by a disease (58,59). IGFBP-1 phosphorylation is suggested as a key mechanism in modulation of cellular responses to IGFs (60) and subsequently in restriction of IGF-I mediated fetal growth (25,61).
HepG2 cells represent fetal liver metabolism in vitro (62,63,64) and have successfully been used in studies with IGFBP-1 involving fetal hypoxia (17,36,65). Furthermore, IGFBP-1 phosphoisoforms purified from HepG2 show similar IGF-I binding characteristics to that of the plasma (66). Considering that variable phosphorylation of IGFBP-1 could modulate IGF-I bioavailability in hypoxia, we selected HepG2 cells for the current study.
ELISA data revealed that the total serine phosphorylation of IGFBP-1 increased for hypoxia and leucine deprivation, proportional to the overall increases in IGFBP-1 secretion. Although total protein was decreased, qualitatively, IGFBP-1 and its phosphorylation were concomitantly induced with both treatments. 2-D immunoblotting combined with the ELISA results suggest that despite modest changes detected in overall phosphorylation, the proportion of multiphosphorylated isoforms is substantially increased. The affinity of IGFBP-1 for IGF-I was also increased for both hypoxic and leucine deprivation treatments, but more so, consequent to hypoxia.
The relative phosphopeptide intensity for pSer 169 increased most dramatically under hypoxia. This was followed by pSer 101. Protein phosphorylation being a complex dynamic process often involves multiple phosphorylation sites (67). Although technical challenges limit the identification of multiply phosphorylated peptides (34,68), a doubly phosphorylated peptide was identified in hypoxia. With close proximity of pSer 98 with the major functional site, pSer101 (41), it is conceivable that in hypoxia, interactions between the adjacent phosphoserines may be significant in the mechanism of kinase actions (69). Future mutagenesis study should clarify the importance of pSer 98 in IGFBP-1 structure and in the functional responses (70,71).
In the case of leucine deprivation, pSer 119 appeared to increase the greatest proportion, followed by pS169. In addition, the effects on IGFBP-1 induction and its phosphorylation were not solely dose dependent (data not shown) when tested under physiologically relevant concentrations (72). These results suggest that possibly extreme nutrient restriction may be necessary to induce IGFBP-1 phosphorylation to exert any potential metabolic effects in regulation of IGF-I. The differences in IGFBP-1 phosphorylation sites induced by hypoxic and leucine deprivation are of potential interest; distinct variations in IGFBP-1 phosphorylation were also consistent with its IGF-binding kinetics. A greater binding affinity of IGFBP-1 for IGF-I in hypoxia is also associated with stronger inhibitory activity to IGF actions.
During pregnancy, IGFBP-1 in plasma is in the non and lesser-phosphorylated forms (66,73). The putative mechanisms leading to hyperphosphorylated IGFBP-1 in stress conditions are unknown. IGFBP-1 is a substrate of multiple protein kinases (74,75,76). We speculate that the balance of kinases regulated by environmental stimuli is altered (35,77,78). As a result, the production and/or the activity of one or multiple protein kinases (79) may be induced (80). Alternatively, reduced dephosphorylation by AKP isoforms (81), such as due to aberrant glycosylation (58), may broaden action potentials resulting in hyperphosphorylated IGFBP-1. Assuming that hypoxic modulation of IGFBP-1 phosphorylation in cell culture reflects the in vivo situation, further investigations should have important implications for the mechanisms through which the fetus responds to low oxygen supply. Proteolysis and dephosphorylation of IGFBP-1 are two physiological processes that may have complementary roles in regulating the bioavailability of IGF-I. The widespread oxygen-sensing (82) and signaling mechanisms (83) together with increased phosphorylation in hypoxia could also affect IGFBP-1 proteolysis (25,84).
Several factors have so far been associated with fetal stress that could contribute to elevated levels of IGFBP-1 mRNA and protein (85,86,87). This study provides the first biochemical and physiological evidence of altered IGFBP-1 phosphorylation as a regulatory mechanism of fetal adaptive response to hypoxia and possibly to severe undernutrition in utero. Whether IGFBP-1 phosphorylation may be a potential mechanism in other catabolic conditions that lead to elevated IGFBP-1 production (88,89,90,91) needs to be investigated.
Acknowledgments
We thank Dr. Gillis Lajoie, Director, Biological Mass Spectrometry Laboratory, University of Western Ontario, for his interest and invaluable discussions throughout the project. We also thank Ms. Majida Abushehab for her technical advice in proteomic analysis, and Ms. Sylvia Katzer, who diligently proofread the manuscript.
Footnotes
M.B.G. received a Natural Sciences and Engineering Research Council of Canada (NSERC)-Discovery Grant for financial support. R.A. was the recipient of a NSERC Undergraduate Student Research Award. Research conducted in C.D.’s laboratory is supported by National Institutes of Health Grant 2RO1HL60679 and National Science Foundation Research Grant IOB 0110864.
Disclosure Statement: The authors have nothing to disclose.
First Published Online September 4, 2008
Abbreviations: ABC, Ammonium bicarbonate; ACN, acetonitrile; AKP, alkaline phosphatase; Asp-N, aspartate N-endoproteinases; CM, conditioned media; ECL, Enhanced Chemiluminescence; FBS, fetal bovine serum; FGR, fetal growth restriction; HEK, human embryonic kidney; HIF-1, hypoxia-inducible factor 1; HRP, horseradish peroxidase; IGFBP, IGF binding protein; LC-MS, liquid chromatography-mass spectrometry; LC-MS/MS, liquid chromatography-tandem mass spectrometry; MS, mass spectrometric; MW, molecular mass; MWCO, Mr cutoff; pI, isoelectric point; rIGF-I, recombinant human IGF-I; SPR, surface plasmon resonance; 3-D, three-dimensional; TFA, trifluoroacetic acid; TiO2, titanium dioxide; 2-D, two-dimensional.
References
- Iwashita M 1994 [Physiological significance of IGF-I and its binding proteins on fetal growth and maturation]. Nippon Sanka Fujinka Gakkai Zasshi 46:660–672 (Japanese) [PubMed] [Google Scholar]
- Martina NA, Kim E, Chitkara U, Wathen NC, Chard T, Giudice LC 1997 Gestational age-dependent expression of insulin-like growth factor-binding protein-1 (IGFBP-1) phosphoisoforms in human extraembryonic cavities, maternal serum, and decidua suggests decidua as the primary source of IGFBP-1 in these fluids during early pregnancy. J Clin Endocrinol Metab 82:1894–1898 [DOI] [PubMed] [Google Scholar]
- Sugawara J, Tazuke SI, Suen LF, Powell DR, Kaper F, Giaccia AJ, Giudice LC 2000 Regulation of insulin-like growth factor-binding protein 1 by hypoxia and 3′,5′-cyclic adenosine monophosphate is additive in HepG2 cells. J Clin Endocrinol Metab 85:3821–3827 [DOI] [PubMed] [Google Scholar]
- Ben Lagha N, Seurin D, Le Bouc Y, Binoux M, Berdal A, Menuelle P, Babajko S 2006 Insulin-like growth factor binding protein (IGFBP-1) involvement in intrauterine growth retardation: study on IGFBP-1 overexpressing transgenic mice. Endocrinology 147:4730–4737 [DOI] [PubMed] [Google Scholar]
- Watson CS, Bialek P, Anzo M, Khosravi J, Yee SP, Han VK 2006 Elevated circulating insulin-like growth factor binding protein-1 is sufficient to cause fetal growth restriction. Endocrinology 147:1175–1186 [DOI] [PubMed] [Google Scholar]
- Giudice LC, de Zegher F, Gargosky SE, Dsupin BA, de las Fuentes L, Crystal RA, Hintz RL, Rosenfeld RG 1995 Insulin-like growth factors and their binding proteins in the term and preterm human fetus and neonate with normal and extremes of intrauterine growth. J Clin Endocrinol Metab 80:1548–1555 [DOI] [PubMed] [Google Scholar]
- Maures TJ, Duan C 2002 Structure, developmental expression, and physiological regulation of zebrafish IGF binding protein-1. Endocrinology 143:2722–2731 [DOI] [PubMed] [Google Scholar]
- Huang ST, Vo KC, Lyell DJ, Faessen GH, Tulac S, Tibshirani R, Giaccia AJ, Giudice LC 2004 Developmental response to hypoxia. FASEB J 18:1348–1365 [DOI] [PubMed] [Google Scholar]
- Kajimura S, Aida K, Duan C 2005 Insulin-like growth factor-binding protein-1 (IGFBP-1) mediates hypoxia-induced embryonic growth and developmental retardation. Proc Natl Acad Sci USA 102:1240–1245 [DOI] [PMC free article] [PubMed] [Google Scholar]
- Rajkumar K, Krsek M, Dheen ST, Murphy LJ 1996 Impaired glucose homeostasis in insulin-like growth factor binding protein-1 transgenic mice. J Clin Invest 98:1818–1825 [DOI] [PMC free article] [PubMed] [Google Scholar]
- Finlay D, Patel S, Dickson LM, Shpiro N, Marquez R, Rhodes CJ, Sutherland C 2004 Glycogen synthase kinase-3 regulates IGFBP-1 gene transcription through the thymine-rich insulin response element. BMC Mol Biol 5:15 [DOI] [PMC free article] [PubMed] [Google Scholar]
- Langford K, Blum W, Nicolaides K, Jones J, McGregor A, Miell J 1994 The pathophysiology of the insulin-like growth factor axis in fetal growth failure: a basis for programming by undernutrition? Eur J Clin Invest 24:851–856 [DOI] [PubMed] [Google Scholar]
- Tapanainen PJ, Bang P, Wilson K, Unterman TG, Vreman HJ, Rosenfeld RG 1994 Maternal hypoxia as a model for intrauterine growth retardation: effects on insulin-like growth factors and their binding proteins. Pediatr Res 36:152–158 [DOI] [PubMed] [Google Scholar]
- Unterman TG, Oehler DT, Murphy LJ, Lacson RG 1991 Multihormonal regulation of insulin-like growth factor-binding protein-1 in rat H4IIE hepatoma cells: the dominant role of insulin. Endocrinology 128:2693–2701 [DOI] [PubMed] [Google Scholar]
- Lee PD, Giudice LC, Conover CA, Powell DR 1997 Insulin-like growth factor binding protein-1: recent findings and new directions. Proc Soc Exp Biol Med 216:319–357 [DOI] [PubMed] [Google Scholar]
- Gibson JM, Westwood M, Lauszus FF, Klebe JG, Flyvbjerg A, White A 1999 Phosphorylated insulin-like growth factor binding protein 1 is increased in pregnant diabetic subjects. Diabetes 48:321–326 [DOI] [PubMed] [Google Scholar]
- Popovici RM, Lu M, Bhatia S, Faessen GH, Giaccia AJ, Giudice LC 2001 Hypoxia regulates insulin-like growth factor-binding protein 1 in human fetal hepatocytes in primary culture: suggestive molecular mechanisms for in utero fetal growth restriction caused by uteroplacental insufficiency. J Clin Endocrinol Metab 86:2653–2659 [DOI] [PubMed] [Google Scholar]
- Lindsay RS, Westgate JA, Beattie J, Pattison NS, Gamble G, Mildenhall LF, Breier BH, Johnstone FD 2007 Inverse changes in fetal insulin-like growth factor (IGF)-1 and IGF binding protein-1 in association with higher birth weight in maternal diabetes. Clin Endocrinol (Oxf) 66:322–328 [DOI] [PubMed] [Google Scholar]
- Kajimura S, Duan C 2007 An evolutionarily conserved fine tuner of IGF actions under catabolic conditions. J Fish Biol 94:E46–E54 [Google Scholar]
- Fowden AL, Giussani DA, Forhead AJ 2006 Intrauterine programming of physiological systems: causes and consequences. Physiology (Bethesda) 21:29–37 [DOI] [PubMed] [Google Scholar]
- Firth SM, Baxter RC 2002 Cellular actions of the insulin-like growth factor binding proteins. Endocr Rev 23:824–854 [DOI] [PubMed] [Google Scholar]
- Westwood M, Gibson JM, Davies AJ, Young RJ, White A 1994 The phosphorylation pattern of insulin-like growth factor-binding protein-1 in normal plasma is different from that in amniotic fluid and changes during pregnancy. J Clin Endocrinol Metab 79:1735–1741 [DOI] [PubMed] [Google Scholar]
- Loukovaara M, Leinonen P, Teramo K, Nurminen E, Andersson S, Rutanen EM 2005 Effect of maternal diabetes on phosphorylation of insulin-like growth factor binding protein-1 in cord serum. Diabet Med 22:434–439 [DOI] [PubMed] [Google Scholar]
- Jones JI, Busby Jr WH, Wright G, Smith CE, Kimack NM, Clemmons DR 1993 Identification of the sites of phosphorylation in insulin-like growth factor binding protein-1. Regulation of its affinity by phosphorylation of serine 101. J Biol Chem 268:1125–1131 [PubMed] [Google Scholar]
- Gibson JM, Aplin JD, White A, Westwood M 2001 Regulation of IGF bioavailability in pregnancy. Mol Hum Reprod 7:79–87 [DOI] [PubMed] [Google Scholar]
- Eghbali-Fatourechi G, Conover CA, Sieck GC, Gores GJ, Fitzpatrick LA 1994 Secretion of insulin-like growth factor binding protein-1 from individual hepatocytes. Res Commun Mol Pathol Pharmacol 85:243–259 [PubMed] [Google Scholar]
- Averous J, Maurin AC, Bruhat A, Jousse C, Arliguie C, Fafournoux P 2005 Induction of IGFBP-1 expression by amino acid deprivation of HepG2 human hepatoma cells involves both a transcriptional activation and an mRNA stabilization due to its 3′UTR. FEBS Lett 579:2609–2614 [DOI] [PubMed] [Google Scholar]
- El Khattabi I, Remacle C, Reusens B 2006 The regulation of IGFs and IGFBPs by prolactin in primary culture of fetal rat hepatocytes is influenced by maternal malnutrition. Am J Physiol Endocrinol Metab 291:E835–E842 [DOI] [PubMed] [Google Scholar]
- Seferovic MD, Krughkov V, Pinto D, Han VK, Gupta MB 2008 Quantitative 2-D gel electrophoresis-based expression proteomics of albumin and IgG immunodepleted plasma. J Chromatogr B Analyt Technol Biomed Life Sci 865:147–152 [DOI] [PubMed] [Google Scholar]
- Grulich-Henn J, Spiess S, Heinrich U, Schonberg D, Bettendorf M 1998 Ligand blot analysis of insulin-like growth factor-binding proteins using biotinylated insulin-like growth factor-I. Horm Res 49:1–7 [DOI] [PubMed] [Google Scholar]
- Gupta MB, Seferovic MD, Liu S, Gratton RJ, Doherty-Kirby A, Lajoie GA, Han VK M 2006 Altered proteome profiles in maternal plasma in pregnancies with fetal growth restrictions. Clin Proteomics 2:169–184 [Google Scholar]
- Khosravi MJ, Diamandi A, Mistry J 1997 Immunoassay of insulin-like growth factor binding protein-1. Clin Chem 43:523–532 [PubMed] [Google Scholar]
- Khosravi J, Krishna RG, Bodani U, Diamandi A, Khaja N, Kalra B, Kumar A 2007 Immunoassay of serine-phosphorylated isoform of insulin-like growth factor (IGF) binding protein (IGFBP)-1. Clin Biochem 40:86–93 [DOI] [PubMed] [Google Scholar]
- Liu S, Zhang C, Campbell JL, Zhang H, Yeung KK, Han VK, Lajoie GA 2005 Formation of phosphopeptide-metal ion complexes in liquid chromatography/electrospray mass spectrometry and their influence on phosphopeptide detection. Rapid Commun Mass Spectrom 19:2747–2756 [DOI] [PubMed] [Google Scholar]
- Tazuke SI, Mazure NM, Sugawara J, Carland G, Faessen GH, Suen LF, Irwin JC, Powell DR, Giaccia AJ, Giudice LC 1998 Hypoxia stimulates insulin-like growth factor binding protein 1 (IGFBP-1) gene expression in HepG2 cells: a possible model for IGFBP-1 expression in fetal hypoxia. Proc Natl Acad Sci USA 95:10188–10193 [DOI] [PMC free article] [PubMed] [Google Scholar]
- Scharf JG,Unterman TG, Kietzmann T 2005 Oxygen-dependent modulation of insulin-like growth factor binding protein biosynthesis in primary cultures of rat hepatocytes. Endocrinology 146:5433–5443 [DOI] [PubMed] [Google Scholar]
- Wenger RH, Rolfs A, Marti HH, Bauer C, Gassmann M 1995 Hypoxia, a novel inducer of acute phase gene expression in a human hepatoma cell line. J Biol Chem 270:27865–27870 [DOI] [PubMed] [Google Scholar]
- Gabay C, Kushner I 1999 Acute-phase proteins and other systemic responses to inflammation. N Engl J Med 340:448–454 [DOI] [PubMed] [Google Scholar]
- Sonna LA, Cullivan ML, Sheldon HK, Pratt RE, Lilly CM 2003 Effect of hypoxia on gene expression by human hepatocytes (HepG2). Physiol Genomics 12:195–207 [DOI] [PubMed] [Google Scholar]
- Halligan BD, Ruotti V, Jin W, Laffoon S, Twigger SN, Dratz EA 2004 ProMoST (Protein Modification Screening Tool): a web-based tool for mapping protein modifications on two-dimensional gels. Nucleic Acids Res 32:W638–W644 [DOI] [PMC free article] [PubMed] [Google Scholar]
- Jones JI, Busby Jr WH, Wright G, Clemmons DR 1993 Human IGFBP-1 is phosphorylated on 3 serine residues: effects of site-directed mutagenesis of the major phosphoserine. Growth Regul 3:37–40 [PubMed] [Google Scholar]
- Wong MS, Fong CC, Yang M 1999 Biosensor measurement of the interaction kinetics between insulin-like growth factors and their binding proteins. Biochim Biophys Acta 1432:293–301 [DOI] [PubMed] [Google Scholar]
- Chard T 1994 Insulin-like growth factors and their binding proteins in normal and abnormal human fetal growth. Growth Regul 4:91–100 [PubMed] [Google Scholar]
- El Khattabi I, Remacle C, Reusens B 2006 The regulation of IGFs and IGFBPs by prolactin in primary culture of fetal rat hepatocytes is influenced by maternal malnutrition. Am J Physiol Endocrinol Metab 291:E835–E842 [DOI] [PubMed] [Google Scholar]
- Verhaeghe J, Van Herck E, Billen J, Moerman P, Van Assche FA, Giudice LC 2003 Regulation of insulin-like growth factor-I and insulin-like growth factor binding protein-1 concentrations in preterm fetuses. Am J Obstet Gynecol 188:485–491 [DOI] [PubMed] [Google Scholar]
- Giudice LC, Martina NA, Crystal RA, Tazuke S, Druzin M 1997 Insulin-like growth factor binding protein-1 at the maternal-fetal interface and insulin-like growth factor-I, insulin-like growth factor-II, and insulin-like growth factor binding protein-1 in the circulation of women with severe preeclampsia. Am J Obstet Gynecol 176:751–757 [DOI] [PubMed] [Google Scholar]
- Grobman WA, Kazer RR 2001 Serum insulin, insulin-like growth factor-I, and insulin-like growth factor binding protein-1 in women who develop preeclampsia. Obstet Gynecol 97:521–526 [DOI] [PubMed] [Google Scholar]
- Ingec M, Gursoy HG, Yildiz L, Kumtepe Y, Kadanali S 2004 Serum levels of insulin, IGF-1, and IGFBP-1 in pre-eclampsia and eclampsia. Int J Gynaecol Obstet 84:214–219 [DOI] [PubMed] [Google Scholar]
- Takenaka A, Komori K, Morishita T, Takahashi SI, Hidaka T, Noguchi T 2000 Amino acid regulation of gene transcription of rat insulin-like growth factor-binding protein-1. J Endocrinol 164:R11–R16 [DOI] [PubMed] [Google Scholar]
- Casanello P, Torres A, Sanhueza F, Gonzalez M, Farias M, Gallardo V, Pastor-Anglada M, San Martin R, Sobrevia L 2005 Equilibrative nucleoside transporter 1 expression is downregulated by hypoxia in human umbilical vein endothelium. Circ Res 97:16–24 [DOI] [PubMed] [Google Scholar]
- Ahmad S, Ahmed A 2004 Elevated placental soluble vascular endothelial growth factor receptor-1 inhibits angiogenesis in preeclampsia. Circ Res 95:884–891 [DOI] [PubMed] [Google Scholar]
- Underwood LE, Thissen JP, Lemozy S, Ketelslegers JM, Clemmons DR 1994 Hormonal and nutritional regulation of IGF-I and its binding proteins. Horm Res 42:145–151 [DOI] [PubMed] [Google Scholar]
- Maulik D, Frances Evans J, Ragolia L 2006 Fetal growth restriction: pathogenic mechanisms. Clin Obstet Gynecol 49:219–227 [DOI] [PubMed] [Google Scholar]
- Leu JI, George DL 2007 Hepatic IGFBP1 is a prosurvival factor that binds to BAK, protects the liver from apoptosis, and antagonizes the proapoptotic actions of p53 at mitochondria. Genes Dev 21:3095–3109 [DOI] [PMC free article] [PubMed] [Google Scholar]
- Neerhof MG, Thaete LG 2008 The fetal response to chronic placental insufficiency. Semin Perinatol 32:201–205 [DOI] [PubMed] [Google Scholar]
- Kajimura S, Aida K, Duan C 2006 Understanding hypoxia-induced gene expression in early development: in vitro and in vivo analysis of hypoxia-inducible factor 1-regulated zebra fish insulin-like growth factor binding protein 1 gene expression. Mol Cell Biol 26:1142–1155 [DOI] [PMC free article] [PubMed] [Google Scholar]
- Coverley JA, Baxter RC 1997 Phosphorylation of insulin-like growth factor binding proteins. Mol Cell Endocrinol 128:1–5 [DOI] [PubMed] [Google Scholar]
- Liu F, Zaidi T, Iqbal K, Grundke-Iqbal I, Gong CX 2002 Aberrant glycosylation modulates phosphorylation of tau by protein kinase A and dephosphorylation of tau by protein phosphatase 2A and 5. Neuroscience 115:829–837 [DOI] [PubMed] [Google Scholar]
- Freeze HH, Aebi M 2005 Altered glycan structures: the molecular basis of congenital disorders of glycosylation. Curr Opin Struct Biol 15:490–498 [DOI] [PubMed] [Google Scholar]
- Baxter RC 2000 Insulin-like growth factor (IGF)-binding proteins: interactions with IGFs and intrinsic bioactivities. Am J Physiol Endocrinol Metab 278:E967–E976 [DOI] [PubMed] [Google Scholar]
- Westwood M 1999 Role of insulin-like growth factor binding protein 1 in human pregnancy. Rev Reprod 4:160–167 [DOI] [PubMed] [Google Scholar]
- Kelly JH, Darlington GJ 1989 Modulation of the liver specific phenotype in the human hepatoblastoma line Hep G2. In Vitro Cell Dev Biol 25:217–222 [DOI] [PubMed] [Google Scholar]
- Wilkening S, Stahl F, Bader A 2003 Comparison of primary human hepatocytes and hepatoma cell line Hepg2 with regard to their biotransformation properties. Drug Metab Dispos 31:1035–1042 [DOI] [PubMed] [Google Scholar]
- Maruyama M, Matsunaga T, Harada E, Ohmori S 2007 Comparison of basal gene expression and induction of CYP3As in HepG2 and human fetal liver cells. Biol Pharm Bull 30:2091–2097 [DOI] [PubMed] [Google Scholar]
- Sugawara J, Suh DS, Faessen GH, Suen LH, Shibata T, Kaper F, Giaccia AJ, Giudice LC 2000 Regulation of insulin-like growth factor-binding protein-1 by nitric oxide under hypoxic conditions. J Clin Endocrinol Metab 85:2714–2721 [DOI] [PubMed] [Google Scholar]
- Westwood M, Gibson JM, White A 1997 Purification and characterization of the insulin-like growth factor-binding protein-1 phosphoform found in normal plasma. Endocrinology 138:1130–1136 [DOI] [PubMed] [Google Scholar]
- Raggiaschi R, Gotta S, Terstappen GC 2005 Phosphoproteome analysis. Biosci Rep 25:33–44 [DOI] [PubMed] [Google Scholar]
- Collins MO, Yu L, Coba MP, Husi H, Campuzano I, Blackstock WP, Choudhary JS, Grant SG 2005 Proteomic analysis of in vivo phosphorylated synaptic proteins. J Biol Chem 280:5972–5982 [DOI] [PubMed] [Google Scholar]
- Beck EJ, Sorensen RG, Slater SJ, Covarrubias M 1998 Interactions between multiple phosphorylation sites in the inactivation particle of a K+ channel. Insights into the molecular mechanism of protein kinase C action. J Gen Physiol 112:71–84 [DOI] [PMC free article] [PubMed] [Google Scholar]
- Johnson LN, Barford D 1993 The effects of phosphorylation on the structure and function of proteins. Annu Rev Biophys Biomol Struct 22:199–232 [DOI] [PubMed] [Google Scholar]
- Johnson LN, O'Reilly M 1996 Control by phosphorylation. Curr Opin Struct Biol 6:762–769 [DOI] [PubMed] [Google Scholar]
- Jauniaux E, Gulbis B, Acharya G, Gerlo E 1999 Fetal amino acid and enzyme levels with maternal smoking. Obstet Gynecol 93:680–683 [DOI] [PubMed] [Google Scholar]
- Bhatia S, Farssen GH, Carland G, Balise RL, Gargosky SE, Druzin M, El-Sayed Y, Wilson DM, Giudice LC 2002 A longitudinal analysis of maternal serum insulin-like growth factor (IGF-I) and total and nonphosphorylated IGF-binding protein-1 in human pregnancies complicated by intrauterine growth restriction. J Clin Endocrinol Metab 87:1864–1870 [DOI] [PubMed] [Google Scholar]
- Frost RA, Tseng L 1991 Insulin-like growth factor-binding protein-1 is phosphorylated by cultured human endometrial stromal cells and multiple protein kinases in vitro. J Biol Chem 266:18082–18088 [PubMed] [Google Scholar]
- Koistinen R, Angervo M, Leinonen P, Seppala M 1993 Phosphorylation of insulin-like growth factor-binding protein-1 from different sources. Growth Regul 3:34–37 [PubMed] [Google Scholar]
- Ankrapp DP, Jones JI, Clemmons DR 1996 Characterization of insulin-like growth factor binding protein-1 kinases from human hepatoma cells. J Cell Biochem 60:387–399 [DOI] [PubMed] [Google Scholar]
- Uchiumi T, Kohno K, Tanimura H, Hidaka K, Asakuno K, Abe H, Uchida Y, Kuwano M 1993 Involvement of protein kinase in environmental stress-induced activation of human multidrug resistance 1 (MDR1) gene promoter. FEBS Lett 326:11–16 [DOI] [PubMed] [Google Scholar]
- Cushman JC, Bohnert HJ 1997 Molecular genetics of crassulacean acid metabolism. Plant Physiol 113:667–676 [DOI] [PMC free article] [PubMed] [Google Scholar]
- Gao Z, Hwang D, Bataille F, Lefevre M, York D, Quon MJ, Ye J 2002 Serine phosphorylation of insulin receptor substrate 1 by inhibitor κ B kinase complex. J Biol Chem 277:48115–48121 [DOI] [PubMed] [Google Scholar]
- Galetic I, Andjelkovic M, Meier R, Brodbeck D, Park J, Hemmings BA 1999 Mechanism of protein kinase B activation by insulin/insulin-like growth factor-1 revealed by specific inhibitors of phosphoinositide 3-kinase—significance for diabetes and cancer. Pharmacol Ther 82:409–425 [DOI] [PubMed] [Google Scholar]
- Nowrouzi A, Yazdanparast R 2005 Alkaline phosphatase retained in HepG2 hepatocarcinoma cells vs. alkaline phosphatase released to culture medium: difference of aberrant glycosylation. Biochem Biophys Res Commun 330:400–409 [DOI] [PubMed] [Google Scholar]
- Lang CH, Nystrom GJ, Frost RA 1999 Regulation of IGF binding protein-1 in hep G2 cells by cytokines and reactive oxygen species. Am J Physiol 276(3 Pt 1):G719–G727 [DOI] [PubMed] [Google Scholar]
- Frost RA, Nystrom GJ, Lang CH 2000 Stimulation of insulin-like growth factor binding protein-1 synthesis by interleukin-1β: requirement of the mitogen-activated protein kinase pathway. Endocrinology 141:3156–3164 [DOI] [PubMed] [Google Scholar]
- Siwanowicz I, Popowicz GM, Wisniewska M, Huber R, Kuenkele KP, Lang K, Engh RA, Holak TA 2005 Structural basis for the regulation of insulin-like growth factors by IGF binding proteins. Structure 13:155–167 [DOI] [PubMed] [Google Scholar]
- Buzzio OL, Lu Z, Miller CD, Unterman TG, Kim JJ 2006 FOXO1A differentially regulates genes of decidualization. Endocrinology 147:3870–3876 [DOI] [PubMed] [Google Scholar]
- Lee MS, Kim MS, Park SY, Kang CW 2006 Effects of betaine on ethanol-stimulated secretion of IGF-I and IGFBP-1 in rat primary hepatocytes: involvement of p42/44 MAPK activation. World J Gastroenterol 12:1718–1722 [DOI] [PMC free article] [PubMed] [Google Scholar]
- Marchand A, Tomkiewicz C, Magne L, Barouki R, Garlatti M 2006 Endoplasmic reticulum stress induction of insulin-like growth factor-binding protein-1 involves ATF4. J Biol Chem 281:19124–19133 [DOI] [PubMed] [Google Scholar]
- Hoybye C, Hilding A, Jacobsson H, Thoren M 2002 Metabolic profile and body composition in adults with Prader-Willi syndrome and severe obesity. J Clin Endocrinol Metab 87:3590–3597 [DOI] [PubMed] [Google Scholar]
- Saeki H, Hamada M, Hiwada K 2002 Circulating levels of insulin-like growth factor-1 and its binding proteins in patients with hypertrophic cardiomyopathy. Circ J 66:639–644 [DOI] [PubMed] [Google Scholar]
- Bankowski E, Sobolewski K, Palka J, Jaworski S 2004 Decreased expression of the insulin-like growth factor-I-binding protein-1 (IGFBP-1) phosphoisoform in pre-eclamptic Wharton’s jelly and its role in the regulation of collagen biosynthesis. Clin Chem Lab Med 42:175–181 [DOI] [PubMed] [Google Scholar]
- Axelsson J, Qureshi AR, Divino-Filho JC, Barany P, Heimburger O, Lindholm B, Stenvinkel P 2006 Are insulin-like growth factor and its binding proteins 1 and 3 clinically useful as markers of malnutrition, sarcopenia and inflammation in end-stage renal disease? Eur J Clin Nutr 60:718–726 [DOI] [PubMed] [Google Scholar]