

Abstract
Obesity and osteoporosis are major health issues affecting millions of individuals. Transgenic mice overexpressing ΔFosB, an activator protein-1 transcription factor, under the control of the enolase 2 (ENO2) promoter exhibit both an increase in bone density and a decrease in adipose mass. Here we demonstrate that ΔFosB overexpression increases fatty-acid oxidation and energy expenditure, leading to a decrease in adipocyte size and adipose mass. In addition, the ENO2-ΔFosB mice exhibit increased insulin sensitivity and glucose tolerance. Targeted overexpression of ΔFosB in adipocytes using the adipocyte protein 2 promoter failed to induce changes in fat or in bone, showing that the effect on metabolic activity is not due to cell-autonomous effects of ΔFosB within adipocytes. Detailed analysis of the ENO2-ΔFosB mice demonstrated that energy expenditure was increased in muscle, independent of locomotor activity. These findings provide evidence that signaling downstream of ΔFosB is a potential target for not only osteoporosis but also obesity and diabetes.
Overexpression of ΔFosB under the control of the enolase 2 promoter increases bone mass and energy expenditure by increasing fatty-acid oxidation within muscle, reducing adiposity.
Obesity and osteoporosis, two widespread diseases with major social and economic impacts, are generally considered as independent clinical entities. It has recently been suggested, however, that they may in fact be pathophysiologically related (1,2). Clinically, osteoporosis is characterized by an increase in the activity of the hematopoietic bone resorbing cells (osteoclasts) and a decrease in the number and function of the mesenchymal bone forming cells (osteoblasts), thus resulting in an overall decrease in bone mass and quality. In addition to this reduction in the number of osteoblasts, patients who are affected by osteoporosis also exhibit an increase in the number of marrow adipocytes (3,4). Because osteoblasts and adipocytes share a common mesenchymal progenitor (5), these observations have often been interpreted as evidence of an inverse relationship between the two cell lineages. In conflict with this hypothesis, however, patients affected by obesity often exhibit simultaneous increases in osteoblast number and bone mass on the one hand and in the number and size of adipocytes and consequently adipose mass on the other (6,7).
It has been suggested recently that there is actual signaling between adipocytes and osteoblasts, with both endocrine and paracrine regulatory pathways reported to mediate the communication between the two cell types. Molecules produced and secreted by osteoblasts can affect the differentiation and function of adipocytes and vice versa (1,2), suggesting a complex relationship between these two cell types with potential important clinical implications.
In this context, it is particularly interesting that overexpression of ΔFosB, an activator protein (AP)-1 transcription factor with reduced transcriptional activity, under the control of the enolase 2 promoter, which drives expression in bone, fat, and regions of the brain, causes both a profound postnatal increase in bone formation, resulting in an increase in bone mass, and a marked decrease in fat mass in transgenic mice [enolase 2 (ENO2)-ΔFosB mice] (8). In contrast, overexpression of Fra1 (Fosl1), another Fos family transcription factor with reduced transactivating potential, resulted only in an increase of bone mass (9).
The AP-1 family of transcription factors has been implicated in the regulation of a variety of physiological processes in multiple tissues, including fat, bone, and the central nervous system (10,11). AP-1 complexes are heterodimers of Fos (c-Fos, FosB, ΔFosB, Fra-1, or Fra-2) and Jun (c-Jun, JunD, or JunB) basic leucine zipper transcription factors that bind to the 12-O-tetra-decanoylphorbol-13-acetate-responsive element consensus sequence, found in the promoter/enhancer regions of many genes (12,13,14).
ΔFosB is a naturally occurring alternatively spliced variant of FosB that lacks the 101 amino acids that encode the C-terminal transactivation domain of FosB due to the generation of a premature stop codon (15). The less active ΔFosB competes with FosB for binding and consequently acts as an antagonist to FosB in most situations (15,16), although it retains some AP-1 transactivating potential (17,18,19).
In the ENO2-ΔFosB mice, ΔFosB is overexpressed in several tissues with potential relevance for the regulation of bone and fat, including osteoblasts in bone, adipocytes in adipose tissue, and the brain (8). We previously reported that targeted expression of ΔFosB to osteoblasts, using the osteocalcin gene 2 promoter [(OG2)-ΔFosB mice], caused an increase in bone mass, which was not accompanied by a decrease in adipose mass (20), suggesting that the bone phenotype is, at least in part, cell-autonomous to the osteoblast lineage Thus, the reduced fat mass of the ENO2-ΔFosB mice is a consequence of neither increased bone formation nor osteoblast-dependent regulatory events, such as the profound increase in serum levels of osteocalcin (8). Conversely, the increased bone formation is not a consequence of the decrease in fat and leptin levels in these mice because we have shown that restoring circulating leptin levels to normal failed to reverse the bone anabolic phenotype (21). We concluded from these initial studies that the fat phenotype must therefore be the result of expression of ΔFosB elsewhere in the ENO2-ΔFosB mice.
The present study was therefore aimed at determining the mechanisms by which ΔFosB is contributing to the decrease in adipose mass in the ENO2-ΔFosB mice and whether it was the result of a cell-autonomous effect of ΔFosB within the adipocyte or an independent central or peripheral event. To evaluate the contribution of a possible cell-autonomous effect in adipocytes, we generated an adipocyte-targeted ΔFosB mouse [adipocyte protein 2 (aP2)-ΔFosB] and compared its adipose characteristics with that of the ENO2-ΔFosB mice. To determine whether a more systemic effect of ΔFosB contributed, we performed a detailed analysis of the ENO2-ΔFosB adipose tissue and conducted a thorough metabolic profiling of the ENO2-ΔFosB mice.
Our results reveal that the adipose phenotype is the result of a ΔFosB-dependent increase in energy expenditure occurring at least in part within muscle, which is associated with an increase in insulin sensitivity but independent of expression of ΔFosB in adipocytes. These results demonstrate that ΔFosB expression, which regulates bone mass, also regulates energy expenditure and insulin sensitivity, opening new opportunities for the treatment of not only osteoporosis but also obesity and diabetes.
Materials and Methods
Generation of ENO2-ΔFosB, OG2-ΔFosB, and aP2-ΔFosB transgenic mice
The ENO2-ΔFosB and OG2-ΔFosB mice were generated using a bitransgenic tetracycline-repressible system as previously described (8,20).
To generate the aP2-ΔFosB mice, a 7.4-kb fragment of the mouse fatty-acid binding protein 4 (aP2) promoter (22) was subcloned upstream of a cDNA encoding ΔFosB. The fragment comprising the aP2 promoter region, ΔFosB open reading frame, and polyadenylation sequence was excised, purified, and microinjected into the pronuclei oocytes of (SJL × C57BL/6) F2 mouse ovaries. Founders and subsequent generations were analyzed for the presence of the transgene using PCR with forward primer (CAT ACA GGG TCT GGT CAT GAA GG) and reverse primer (GAA GAT CCT GGC TGG TTG TGA TTG). The aP2-ΔFosB mice were backcrossed and maintained on a C57BL/6 background. Heterozygous aP2-ΔFosB mice were crossed with C57BL/6 mice to obtain mice that expressed ΔFosB under the control of the aP2 promoter and littermate controls that did not. All animal protocols were approved by the Yale University Institutional Animal Care and Use Committee.
Animal diets
Animals were maintained on normal chow (60% carbohydrate/10% fat/30% protein calories) except where maintenance on high-fat chow (26% carbohydrate/59% fat/15% protein calories) is indicated.
Serum profiling
ENO2-ΔFosB mice and control littermates were exsanguinated by cardiac puncture. Blood was allowed to coagulate overnight at 4 C and serum was prepared by centrifugation (3000 × g). Insulin and adiponectin levels were determined by ELISA (ALPCO Diagnostics, Salem, NH) following the manufacturer’s instructions. Serum triglycerides and free fatty acids were determined using colorimetric kits (Sigma-Aldrich, St. Louis, MO, and Wako, Richmond, VA, respectively).
Glucose and insulin tolerance test
ENO2-ΔFosB mice and control littermates were fasted overnight and given water ad lib. Mice were injected ip with either glucose (2 mg/g of body weight) or insulin (Humalog) (0.1 mU/g of body weight; Eli Lilly, Indianapolis, IN). Blood sugar levels were measured at 15, 30, 60, 120, and 180 min after injection with a One Touch Ultra glucometer (LifeScan, Burnaby, British Columbia, Canada).
Western blot analysis of whole tissue
Tissues were removed from either transgenic or control mice and homogenized in lysis buffer [50 mm Tris-HCl (pH 7.5), 150 mm NaCl. 0.1% IGEPAL CA-630, 0.25% sodium deoxycholate, 1 mm EDTA] supplemented with Complete protease inhibitor cocktail (Roche Applied Science, Indianapolis, IN). Extracts were boiled for 10 min and then cleared by centrifugation at 8000 × g for 10 min at 4 C. Protein concentrations were determined using the micro-BCA protein assay (Pierce Chemical Co., Rockford, IL), following the manufacturer’s instructions. Protein extracts (30 μg) were subjected to electrophoresis on 4–12% Bis-Tris gels (Invitrogen, Carlsbad, CA) and transferred to Protran nitrocellulose membranes (Schleicher & Schuell Inc., Keene, NH) for Western blot analysis. Antibodies were purchased from Santa Cruz Biotechnology (Santa Cruz, CA) or Cell Signaling (Danvers, MA). Bands were detected by enhanced chemiluminescence procedure following the manufacturer’s instructions (Amersham Pharmacia Biotech, Piscataway, NJ).
RNA isolation and real-time PCR analysis
Total RNA was isolated from tissue samples using Trizol reagent (Invitrogen) according to the manufacturer’s instructions. mRNA was converted to cDNA using Superscript II and an oligo-deoxythymidine primer (Invitrogen), following the manufacturer’s instructions. Transcripts were quantified by real-time PCR using an iCycler (Bio-Rad, Hercules, CA), with the iQ SYBR Green super mix (Bio-Rad) and primers to FosB, and normalized to actin as previously described (20).
Histological analysis of adipose and vertebral sections
Liver, epididymal, and sc fat pads were removed, fixed in 3.7% formaldehyde/PBS, and embedded in paraffin using standard procedures. Eight-micrometer sections were stained with hematoxylin and eosin using standard procedures and histomorphometry was performed using the public domain NIH Image program (developed at the National Institutes of Health and available at http://rsb.info.nih.gov/nih-image/).
A vertebral segment from the base of the tail was fixed in 3.7% formaldehyde/PBS and embedded in methylmethacrylate. Sections (8 μm) were cut and stained with toluidine blue using standard procedures.
Quantification of fat and muscle composition by nuclear magnetic resonance spectroscopy
Whole-body fat and muscle mass were measured in unanesthetized male mice using 1H-magnetic resonance spectroscopy (Minispec MQ10 analyzer; Bruker Optics, Billerica, MA).
Basal metabolic study
Mouse energy expenditure, food intake, and locomotor activity were measured using the comprehensive lab animal monitoring system (Columbus Instruments, Columbus, OH). Respiratory quotient (RQ) was determined by the ratio of carbon dioxide produced relative to oxygen consumed, which changes, depending on the energy source the animal is using. Oxidation of carbohydrates results in an RQ of 1.0, and oxidation of fatty-acids results in a RQ of 0.7. Caloric intake (kilocalories per gram per hour) was calculated from food consumption. Energy expenditure was determined as a measure of heat [(3.815 + 1.232 × RQ) × oxygen consumed] (kilocalories per kilogram per hour). All data were normalized to the body weight during analysis.
In vivo and in vitro fatty acid oxidation assay
ENO2-ΔFosB mice and control littermates were injected ip with 3 μCi of [1-14C] oleic acid bound to albumin. After injection, the mice were placed into a metabolic chamber connected to a NaOH (1 n) trap to capture expired 14CO2. 14C radioactivity from the NaOH trap was counted at 30-min intervals over 4 h. The in vivo fat oxidation rate was calculated from the slope of 14CO2 production normalized to lean body mass for the initial 2 h.
Soleus and extensor digitorum longus skeletal muscles (∼10–15 mg) were excised from ENO2-ΔFosB mice and control mice and placed into 25-ml flasks fitted with center wells containing 1 n NaOH and a filter paper strip to trap 14CO2. Flasks were incubated with medium containing 3 ml of Krebs-Ringer phosphate buffer and 2 μCi of albumin-bound [1-14C] oleic acid for 1 h at 37 C in shaking water bath. Reactions were stopped by adding 1 ml of 0.5 n sulfuric acid to the medium to release 14CO2. After 3 h incubation at 50 C, trapped 14CO2 in the center well was transferred to scintillation fluid and the radioactivity measured as disintegrations per minute.
Carboxylated and uncarboxylated osteocalcin assay
Carboxylated and uncarboxylated osteocalcin was determined as described previously (23,24). Briefly, total osteocalcin was determined by RIA using a polyclonal antibody to mouse osteocalcin (antibody recognizes both carboxylated and uncarboxylated osteocalcin equally). Carboxylated osteocalcin was separated from uncarboxylated osteocalcin by adsorption on to hydroxyapatite. Uncarboxylated osteocalcin was measured after elution from hydroxyapatite.
Statistical analysis
The data are presented as means ± sem. Statistical analysis was performed with Student’s t test for all in vitro experiments and two-way ANOVAs for all in vivo experiments. P < 0.05 were considered statistically significant.
Results
The decrease in fat in ENO2-ΔFosB mice is the result of decreased adipocyte size
We previously reported that overexpression of ΔFosB under the control of the ENO2 promoter induced both an increase in bone mass and a decrease in adipose mass (8). The decrease in adipose mass was sufficient to cause a significant decrease in both total body weight and percentage of body fat in these animals (Fig. 1, A and B). Histological analysis of adipose tissue from the ENO2-ΔFosB mice revealed that the size of the individual adipocytes was decreased in all adipose depots examined, including epididymal fat pads, skin, and bone marrow (Fig. 1C). This decrease in adipocyte size was proportional to the decrease in adipose mass (compare Fig. 1, D and E), suggesting that the reduced adipose mass was the consequence of decreased steady-state lipid accumulation and not an alteration in adipocyte differentiation. To confirm this observation, we examined the expression of several key adipogenic transcription factors that promote adipocyte differentiation (25). Western blotting analysis of adipose tissue revealed that the overexpression of ΔFosB had no effect on the amount of CCAAT/enhancer-binding protein (C/EBP)-α, C/EBPβ, peroxisomal proliferator-activated receptor (PPAR)-γ, and sterol regulatory element-binding protein-1 (Fig. 1F). In addition, the ability of adipocytes differentiated from stromal vascular cells from the adipose tissue of ENO2-ΔFosB to form lipid droplets was unimpaired (data not shown). Taken together these observations suggest that the reduced adipose mass was due to decreased storage or increased use of lipids rather than reduced adipocyte number.
Figure 1.

Decreased adiposity in ENO2-ΔFosB mice. A, Body weight of ENO2-ΔFosB mice and littermate controls (n = 8; **, P < 0.005). B, Percentage body fat of 16- to 20-wk-old male ENO2-ΔFosB mice and controls determined by nuclear magnetic resonance spectroscopy (n = 8; **, P < 0.005). C, Hematoxylin and eosin staining of epididymal and subcutaneous white adipose tissue from ENO2-ΔFosB mice and control littermates. Toluidine blue staining of distal vertebral sections from control and ENO2-ΔFosB mice. D, Weight of epididymal fat pads from ENO2-ΔFosB mice and control animals (n = 8; **, P < 0.005). E, Calculated volume of individual adipocytes in the epididymal fat pads analyzed in C (n = 8; **, P < 0.005). F, Western blot analysis of white adipose tissue from two different ENO2-ΔFosB mice and two control littermates with antibodies to C/EBPβ, C/EBPα, PPARγ, sterol regulatory element-binding protein (SREBP1), FosB, and actin.
ENO2-ΔFosB mice exhibit normal adipocyte function but increased glucose tolerance and insulin sensitivity
Because the reduced adipose mass appeared not to be the consequence of altered adipocyte differentiation and the mice showed a decrease in both leptin and adiponectin (Fig 2A) (8,21), we explored the possibility that the decrease in adipose mass was the consequence of impaired adipocyte function (lipodystrophy) as described in some other mouse models with decreased adipose mass (22,26,27). Contrary to what would be expected with lipodystrophy, we found that the levels of triglycerides were unchanged and the circulating levels of insulin and nonesterified fatty acids were significantly decreased in the ENO2-ΔFosB mice (Fig. 2, B–D). The ENO2-ΔFosB mice also showed no sign of liver steatosis or ectopic triglyceride accumulation within skeletal muscle (Fig. 2E and data not shown), two other characteristics of lipodystrophy. Finally and most importantly, blood glucose levels were significantly lower in both the fed and fasted state (Fig. 2F) and the ENO2-ΔFosB mice had an increased tolerance to glucose (Fig. 2G) associated with enhanced insulin sensitivity (Fig. 2H). All of these findings are incompatible with lipodystrophy and suggest that ΔFosB did not affect the function of individual adipocytes but instead caused a systemic metabolic alteration that resulted in decreased adipocyte size.
Figure 2.

ENO2-ΔFosB mice exhibit increased glucose tolerance and insulin sensitivity. A, Circulating adiponectin levels were measured in 16- to 20-wk-old male ENO2-ΔFosB mice and littermate controls by ELISA (n = 8; **, P < 0.005). B, Circulating triglycerides were measured in 16- to 20-wk-old male ENO2-ΔFosB and control mice (n = 8). C, Circulating nonesterified fatty acids were measured in 16- to 20-wk-old male ENO2-ΔFosB mice and littermate controls (n = 8; *, P < 0.05). D, Circulating insulin levels were measured in 16- to 20-wk-old male ENO2-ΔFosB mice and littermate controls by ELISA (n = 8; **, P < 0.005). E, Hematoxylin and eosin staining of liver sections from ENO2-ΔFosB mice and control littermates. F, Circulating blood glucose levels were measured during fed and after overnight fasted state in 16- to 20-wk-old male ENO2-ΔFosB mice and littermate controls (n = 8; **, P < 0.005). G, Glucose tolerance test after overnight fast in 16- to 20-wk-old male ENO2-ΔFosB mice (closed triangles) and littermate controls (open squares) (n = 7–9; *, P < 0.05). H, Insulin tolerance test after overnight fast in 16- to 20-wk-old male ENO2-ΔFosB mice (closed triangles) and littermate controls (open squares) (n = 7–9; *, P < 0.05).
Adipocyte-targeted expression of ΔFosB does not affect adipose mass
To rule out the possibility that the expression of ΔFosB in adipocytes contributes to the fat phenotype, i.e. that the phenotype is in part the result of the cell-autonomous effects of ΔFosB, we generated mice in which the expression of ΔFosB was targeted to adipocytes with the promoter of the fatty acid binding protein 4/aP2 gene (aP2-ΔFosB mice). In the aP2-ΔFosB mice, ΔFosB was overexpressed in both white and brown adipose tissue, and no overexpression was detected in other tissues, including bone and brain (Fig. 3A). Despite the strong overexpression of ΔFosB in adipose tissue, the aP2-ΔFosB mice did not show any change in body weight, percentage total body fat, abdominal fat mass, or adipocyte size (Fig. 3, B–E). In addition, the aP2-ΔFosB mice also had normal fed and fasted blood glucose levels (Fig. 3F). These findings provide further evidence that the decreased adipose mass of the ENO2-ΔFosB mice is not due to ΔFosB-induced changes within adipocytes. In addition, increased expression of ΔFosB within adipocytes had no effect on bone mineral density and on bone mass (Fig. 3G), indicating that overexpression of ΔFosB in adipocytes did not contribute to the bone phenotype of the ENO2-ΔFosB mice, just as increased expression of ΔFosB in osteoblasts failed to induce any changes in adipose mass in the OG2-ΔFosB mice (20).
Figure 3.

Targeted expression of ΔFosB in adipocytes does not alter adipose mass in vivo. A, Western blot analysis of ΔFosB expression in tissues from aP2-ΔFosB mice and littermate controls. WAT, Epididymal white adipose tissue; Br, brain; Bo, bone; Li, liver; Mu, muscle; Sp, spleen. Actin was used to estimate protein loading. B, Body weight of aP2-ΔFosB mice and littermate controls (n = 8). C, Percentage body fat determined by nuclear magnetic resonance spectroscopy (n = 8). D, Epididymal fat pad masses of aP2-ΔFosB mice and littermate controls (n = 8). E, Hematoxylin and eosin staining of epididymal white adipose tissue from aP2-ΔFosB mice and control littermates. F, Circulating blood glucose levels were measured during fed and overnight fasted state in 16- to 20-wk-old male aP2-ΔFosB mice and littermate controls (n = 8). G, Bone mineral density of aP2-ΔFosB mice and littermate controls (n = 8).
ENO2-ΔFosB mice show increased energy expenditure and resistance to diet-induced obesity
The fact that the decrease in adipose mass observed in the ENO2-ΔFosB mice was not the result of an impaired adipocyte function or of a differentiation defect suggested that ΔFosB could be reducing adipose mass by increasing metabolic activity. We therefore determined whether ΔFosB conferred resistance to diet-induced obesity. As shown in Fig. 4, ENO2-ΔFosB mice gained less weight than control mice when placed on a high fat diet (Fig. 4, A and B), even though there was an increase in food intake (Table 1). To further evaluate the resistance to diet-induced obesity in the ENO2-ΔFosB mice, the energy balance of the mice was assessed in an animal metabolic monitoring system. The total energy expenditure of the ENO2-ΔFosB mice fed the high-fat diet was significantly higher than that of the wild-type mice, consistent with an increased caloric intake (Table 1). In addition, respiratory quotient values were significantly lower in the ENO2-ΔFosB mice fed the regular diet (Table 1), suggesting that fat oxidation was increased. Interestingly, these changes in fatty acid oxidation occurred in the presence of decreased adiponectin levels and therefore cannot be attributed to high levels of circulating adiponectin. Surprisingly, the ENO2-ΔFosB mice exhibited only half the locomotor activity of their littermate controls (Table 1), notwithstanding their increased energy output and resistance to weight gain, further suggesting the presence of an inherent high expenditure of energy, independent of physical activity. The increased energy expenditure did not appear to be an effect of ΔFosB within brown adipose tissue (BAT) because the BAT in the ENO2-ΔFosB mice had normal histology and expressed normal levels of uncoupling protein-1 and PPARγ coactivator 1α, key markers of BAT thermogenesis (data not shown). In addition, the failure of the aP2-ΔFosB mice to recapitulate the adipose mass phenotype, despite the overexpression of ΔFosB within BAT (Fig. 3A), further argued against the possibility that ΔFosB-induced changes in BAT activity contributed to the energy-dependent reduction in adipose mass.
Figure 4.

ENO2-ΔFosB mice are resistant to weight gain. A, Percentage change in body weight of ENO2-ΔFosB mice and controls after 4 wk on high-fat diet (n = 8; **, P < 0.005). B, Percentage change in fat of ENO2-ΔFosB mice and controls determined by nuclear magnetic resonance spectroscopy after 4 wk on high-fat diet (n = 8; **, P < 0.005).
Table 1.
Metabolic parameters of the ENO2-ΔFosB mice
| Normal diet
|
High-fat diet
|
|||
|---|---|---|---|---|
| Control | ENO2-ΔFosB | Control | ENO2-ΔFosB | |
| RQ (VO2/VCO2) | 0.89 ± 0.02 | 0.83 ± 0.01a | 0.80 ± 0.003 | 0.80 ± 0.003 |
| Food intake (kcal/g · h) | 21.89 ± 2.11 | 19.88 ± 0.45 | 16.45 ± 1.87 | 22.2 ± 0.82a |
| Heat generated (kcal/kg · h) | 16.8 ± 0.52 | 16 ± 0.3 | 15.17 ± 0.84 | 17 ± 0.29a |
| Locomotor activity (beam breaks/h) | 106 ± 11.3 | 52.6 ± 3.7a | 109.3 ± 11.9 | 59.1 ± 5.0a |
Indirect calorimetry of 14-wk-old male ENO2-ΔFosB mice and littermate controls maintained on either normal or high-fat diet and monitored over a 24-h period (values represent means ± se, n = 6 – 8). VO2/VCO2, Ratio of carbon dioxide produced relative to oxygen consumed.
P < 0.05.
The lack of evidence of an increased thermogenic response together with the decreased physical activity suggested that the increased energy expenditure could be the consequence of changes in fatty acid oxidation within skeletal muscle (28). We therefore measured the rate of oxidation of radiolabeled oleic acid in ENO2-ΔFosB mice and control littermates and found that the rate of fatty acid oxidation was 50% higher in the ENO2-ΔFosB mice than in control animals (Fig. 5A). Furthermore, ex vivo analysis of fatty acid oxidation by soleus and extensor digitorum longus skeletal muscles was also increased (Fig. 5B). In addition, these mice also had an increase in percent muscle mass (Fig. 5C). These results provide strong evidence that the increase in energy expenditure is indeed the result of increased fatty acid oxidation within the muscle.
Figure 5.
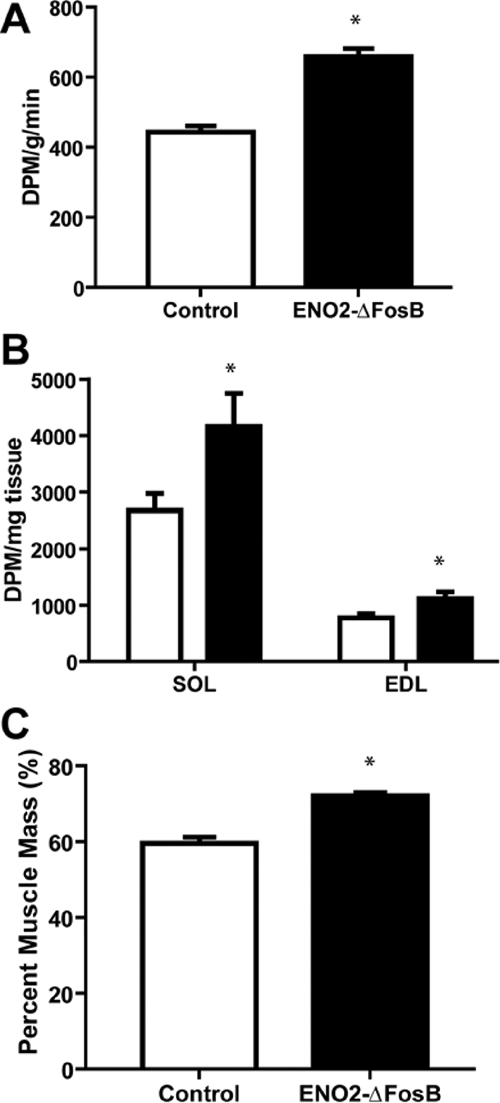
Increased fatty acid oxidation and muscle mass in ENO2-ΔFosB mice. A, In vivo measurement of radiolabeled oleic acid metabolized to carbon dioxide from ENO2-ΔFosB and control mice (n = 4; *, P < 0.05). B, In vitro measurement of metabolized radiolabeled oleic acid to carbon dioxide from excised soleus (SOL) and extensor digitorum longus (EDL) from the ENO2-ΔFosB (black bar) and control mice (white bar) (n = 4; *, P < 0.05). C, Percentage muscle mass of 16- to 20-wk-old male ENO2-ΔFosB mice and controls determined by nuclear magnetic resonance spectroscopy (n = 8; **, P < 0.005).
Finally, in light of the recent report that changes in the ratio of uncarboxylated to carboxylated osteocalcin results in changes in both adipose and pancreatic function, altering energy expenditure, insulin secretion, and insulin sensitivity (29), and because the ENO2-ΔFosB mice have markedly increased bone formation rates and bone mass (8), we analyzed the levels of total and uncarboxylated osteocalcin. We confirmed our previous observation that the ENO2-ΔFosB mice have markedly increased levels of circulating osteocalcin (8) but found that there was no change in the ratio of uncarboxylated to carboxylated osteocalcin compared with control animals (Fig. 6A). Similar results were also obtained in the OG2-ΔFosB mice, with increased levels of total osteocalcin and no significant difference in ratio uncarboxylated to carboxylated osteocalcin (Fig. 6, B and C). Furthermore, the changes we observed in pancreatic and adipose function, i.e. decreased insulin and adiponectin levels, are incompatible with the osteocalcin-induced changes observed in osteocalcin-null and osteotesticular phosphatase gene (Esp)-null or transgenic mice (29). These results therefore demonstrate that, in addition to its role in bone formation, ΔFosB plays a potent role in the regulation of energy expenditure and insulin sensitivity, independent of the ratio of uncarboxylated to carboxylated osteocalcin.
Figure 6.
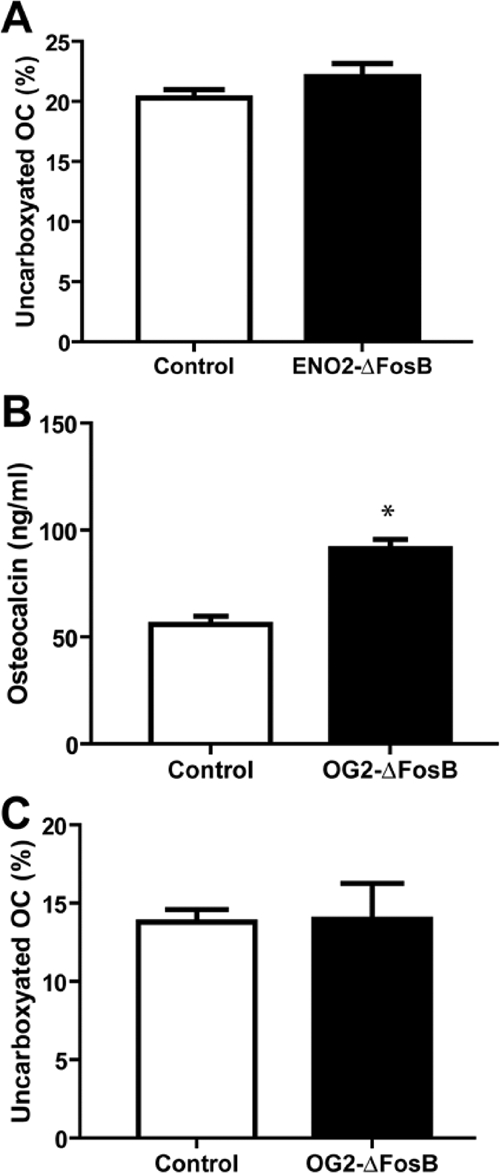
Unchanged ratio of uncarboxylated to carboxylated osteocalcin. A, Percentage uncarboxylated osteocalcin (OC) to total osteocalcin of 16- to 20-wk-old male ENO2-ΔFosB mice and control littermates (n = 4; n.s., Not statistically significant). B, Total osteocalcin of 16- to 20-wk-old male OG2-ΔFosB mice and control littermates (n = 4; *, P < 0.05). C, Percentage uncarboxylated osteocalcin (OC) to total osteocalcin of 16- to 20-wk-old male OG2-ΔFosB mice and control littermates (n = 4).
Discussion
A more complete understanding of the factors that regulate bone mass, on the one hand, and adipose mass, on the other hand, is critical to our understanding of many diseases such as osteoporosis, obesity, the metabolic syndrome and by extension diabetes. Many extrinsic and intrinsic factors have been the focus of intense investigation of mechanisms responsible for the maintenance of adipose homeostasis (30,31). We previously reported that overexpression of ΔFosB, a member of the AP-1 family of transcription factors, induces profound increases in bone mass and decreases in adipose mass (8). In addition, we have shown that the effect on adipose mass was independent of the circulating levels of leptin or of ΔFosB’s expression within the osteoblast lineage (20,21). Our current study demonstrates that both bone formation and adipose mass in these mice are also independent of ΔFosB’s expression in adipocytes because neither bone nor adipose mass was altered in the aP2-ΔFosB mice and that ΔFosB regulates adipose mass via an increase in energy expenditure, which occurs for the most part in muscle, independent of physical activity. Whether the effects of ΔFosB on bone formation are linked to or are entirely independent of the changes in fat or energy remains to be elucidated. Nonetheless, these observations identify signaling downstream of ΔFosB as a possible therapeutic target in the fight against obesity and diabetes as well as osteoporosis.
The fact that both osteoblasts and adipocytes arise from a common precursor provided the basis for the original hypothesis that ΔFosB regulated the commitment and/or differentiation of both of these cells in the ENO2-ΔFosB mice in an opposing fashion. However, our observation that bone mass increased without any effect on adipose mass when ΔFosB expression was targeted to osteoblasts in the OG2-ΔFosB mice (20) is inconsistent with this hypothesis. We now show here that when ΔFosB is targeted to the adipocyte lineage in the aP2-ΔFosB mice, there are no changes in either bone or adipose mass, indicating that the decrease of adipose mass in the ENO2-ΔFosB mice is not the result of a cell-autonomous effect of ΔFosB within the adipocytes. These observations eliminate the possibility that the reduction in adipose mass is the result of altered differentiation of adipocytes in a cell-autonomous manner, such as previously observed in other mouse models (22,26).
In vivo analysis of ENO2-ΔFosB adipose tissue revealed that the size of adipocytes was decreased in all adipose depots examined. This decrease in adipocyte size was proportional to the decrease in adipose mass, consistent with the reduced adipose mass being a consequence of decreased lipid accumulation rather than of an alteration in adipocyte differentiation. The absence of any changes in the expression of key adipogenic transcription factors in the ENO2-ΔFosB adipose tissue itself further supported the conclusion that the reduced adipose mass was not due to reduced adipocyte differentiation. Indeed, metabolic profiling of these mice revealed that they had an increase in energy expenditure, associated with a muscle-mediated increase in fatty acid oxidation. This increase in muscle fatty acid oxidation is sufficient to explain both the increase in energy expenditure and the decrease in adipose mass.
Muscle-mediated increases in fatty acid oxidation and, subsequently, energy expenditure has been identified as one of the leading contributors to decreased adipose mass and increased insulin sensitivity (28,32,33,34). Recent studies have identified factors that act both centrally and locally to regulate muscle function. One such regulator is adiponectin, which increases fatty acid oxidation (35,36,37,38). Increased levels of circulating adiponectin have been associated with increased fatty acid oxidation and insulin sensitivity (39,40). In contrast, decreased levels of circulating adiponectin have been reported to be associated with both human and mouse models of obesity (41,42). In the ENO2-ΔFosB mice, we observed that the level of adiponectin was decreased, yet energy expenditure and insulin sensitivity were increased, thus apparently excluding changes in the levels of adiponectin as being responsible for the observed phenotype, although we cannot exclude the possibility that these mice have an increased overall sensitivity to adiponectin.
Karsenty and colleagues (29) recently provided evidence of a feedback loop whereby osteoblasts regulate energy and adipocytes through the secretion of uncarboxylated osteocalcin, which affects adipocytes both directly and, by regulating insulin secretion, indirectly. Our results, however, suggest that ΔFosB does not affect the components of this feedback loop. Although both the Esp-null and ENO2-ΔFosB mice have an increase in energy expenditure and glucose tolerance, the ENO2-ΔFosB mouse differs from the Esp−/−, Ocn−/− and collagen type 1α Esp transgenic mice described by Karsenty and colleagues in several ways. The Esp-null mouse has high insulin and adiponectin levels, whereas the ENO2-ΔFosB has decreased circulating insulin and adiponectin levels. In addition, Esp-null mice had no alterations in bone mass, and conversely, the increased levels of bone formation in the ENO2-ΔFosB mice was not associated with a change in the ratio of carboxylated to uncarboxylated osteocalcin, inconsistent with the changes in energy expenditure that we observed in the ENO2-ΔFosB mice being the consequence of changes in the absolute or relative amounts of uncarboxylated osteocalcin. Furthermore, the increased bone formation and osteocalcin levels induced by overexpressing ΔFosB specifically in osteoblasts (the OG2-ΔFosB mice) did not affect adipose mass (20), excluding a simple correlation between osteocalcin levels and adipose mass in these mice. Thus, the mechanisms by which expression of ΔFosB affects energy expenditure and insulin sensitivity appear to be independent of the leptin- and/or osteocalcin-mediated regulatory loops described by Karsenty and colleagues (7,29). In our view, our data collectively exclude the possibility that the increased energy expenditure and decreased adipose mass observed in the ENO2-ΔFosB mice and, absent in the OG2-ΔFosB mice, result from changes in bone formation. Notwithstanding these differences, both the Esp-null and ENO2-ΔFosB mice have an increased sensitivity to insulin and thus provide good models for exploring the regulatory mechanisms involved in glucose metabolism and diabetes.
In considering alternative possibilities, ΔFosB could be affecting energy expenditure and insulin sensitivity via central relays within the brain or directly within the muscle in a cell-autonomous manner. However, we confirmed our earlier observations (8) that ΔFosB is not overexpressed within the muscle (data not shown), thus arguing against the possibility of a direct effect in muscle. In contrast, alterations in the levels of expression of the FosB isoforms in the brain are known to result in various changes in behavior in animal models, including locomotor activity and motivation for food (43,44). Thus, a central nervous system effect, which could affect not only energy expenditure and fat but also bone (31), is possible. Although the regulation of ΔFosB levels under physiological conditions has been most extensively studied in the striatum (10), the expression of FosB/ΔFosB in the preoptic area of the hypothalamus of mice has been shown to be related to nurturing behavior. However, FosB-null mice, which express none of the FosB isoforms, had no reported abnormality in eating behavior or body weight (45). Thus, there is yet no direct evidence that the action of ΔFosB in the brain accounts for the changes in energy expenditure and possibly bone formation that we observe in the ENO2-ΔFosB mice, although this is the focus of ongoing studies.
In conclusion, we have shown that the overexpression of ΔFosB not only increases bone mass but also reduces adipose mass via an increase in energy expenditure in muscle and insulin sensitivity. Thus, these mechanisms could be the potential target for the treatment of not only osteoporosis but also obesity and diabetes.
Acknowledgments
We thank K. Ford for her help with maintenance and care of all animals and C. Gundberg for determining the levels uncarboxylated and carboxylated osteocalcin.
Footnotes
This work was supported by Grant AR 048218 from the National Institutes of Health (to R.B.), a grant from the Howard Hughes Medical Institute (to G.I.S.), and a United Negro College Fund-Merck Dissertation Fellowship (to G.C.R.).
Current address for C.S.C.: Lee Gil Ya Cancer and Diabetes Institute, Gachon University of Medicine and Science, Incheon, Korea.
Current address for G.C.R., L.N., W.C.H., and R.B.: Department of Oral Medicine, Infection, and Immunity, Harvard University School of Dental Medicine, Boston, Massachusetts 06520.
Disclosure Statement: G.C.R., C.S.C., L.N., W.C.H., and G.I.S. have nothing to declare. R.B. is an inventor on U.S. Patent 6,916,603.
First Published Online September 4, 2008
Abbreviations: AP, Activator protein; aP2, adipocyte protein 2; BAT, brown adipose tissue; C/EBP, CCAAT/enhancer-binding protein; ENO2, enolase 2; Esp, osteotesticular phosphatase gene; PPAR, peroxisomal proliferator-activated receptor; RQ, respiratory quotient.
References
- Karsenty G 2006 Convergence between bone and energy homeostases: leptin regulation of bone mass. Cell Metab 4:341–348 [DOI] [PubMed] [Google Scholar]
- Rosen CJ, Bouxsein ML 2006 Mechanisms of disease: is osteoporosis the obesity of bone? Nat Clin Pract Rheumatol 2:35–43 [DOI] [PubMed] [Google Scholar]
- Chan GK, Duque G 2002 Age-related bone loss: old bone, new facts. Gerontology 48:62–71 [DOI] [PubMed] [Google Scholar]
- Takeda S, Elefteriou F, Karsenty G 2003 Common endocrine control of body weight, reproduction, and bone mass. Annu Rev Nutr 23:403–411 [DOI] [PubMed] [Google Scholar]
- Pittenger MF, Mackay AM, Beck SC, Jaiswal RK, Douglas R, Mosca JD, Moorman MA, Simonetti DW, Craig S, Marshak DR 1999 Multilineage potential of adult human mesenchymal stem cells. Science 284:143–147 [DOI] [PubMed] [Google Scholar]
- Reid IR 2002 Relationships among body mass, its components, and bone. Bone 31:547–555 [DOI] [PubMed] [Google Scholar]
- Ducy P, Amling M, Takeda S, Priemel M, Schilling AF, Beil FT, Shen J, Vinson C, Rueger JM, Karsenty G 2000 Leptin inhibits bone formation through a hypothalamic relay: a central control of bone mass. Cell 100:197–207 [DOI] [PubMed] [Google Scholar]
- Sabatakos G, Sims NA, Chen J, Aoki K, Kelz MB, Amling M, Bouali Y, Mukhopadhyay K, Ford K, Nestler EJ, Baron R 2000 Overexpression of ΔFosB transcription factor(s) increases bone formation and inhibits adipogenesis. Nat Med 6:985–990 [DOI] [PubMed] [Google Scholar]
- Jochum W, David JP, Elliott C, Wutz A, Plenk Jr H, Matsuo K, Wagner EF 2000 Increased bone formation and osteosclerosis in mice overexpressing the transcription factor Fra-1. Nat Med 6:980–984 [DOI] [PubMed] [Google Scholar]
- McClung CA, Ulery PG, Perrotti LI, Zachariou V, Berton O, Nestler EJ 2004 ΔFosB: a molecular switch for long-term adaptation in the brain. Brain Res Mol Brain Res 132:146–154 [DOI] [PubMed] [Google Scholar]
- Wagner EF, Eferl R 2005 Fos/AP-1 proteins in bone and the immune system. Immunol Rev 208:126–140 [DOI] [PubMed] [Google Scholar]
- Drissi H, Luc Q, Shakoori R, Chuva De Sousa Lopes S, Choi JY, Terry A, Hu M, Jones S, Neil JC, Lian JB, Stein JL, Van Wijnen AJ, Stein GS 2000 Transcriptional autoregulation of the bone related CBFA1/RUNX2 gene. J Cell Physiol 184:341–350 [DOI] [PubMed] [Google Scholar]
- Li AW, Morash B, Hollenberg AN, Ur E, Wilkinson M, Murphy PR 2001 Transcriptional regulation of the leptin gene promoter in rat GH3 pituitary and C6 glioma cells. Mol Cell Endocrinol 176:57–65 [DOI] [PubMed] [Google Scholar]
- Homma H, Kurachi H, Nishio Y, Takeda T, Yamamoto T, Adachi K, Morishige K, Ohmichi M, Matsuzawa Y, Murata Y 2000 Estrogen suppresses transcription of lipoprotein lipase gene. Existence of a unique estrogen response element on the lipoprotein lipase promoter. J Biol Chem 275:11404–11411 [DOI] [PubMed] [Google Scholar]
- Nakabeppu Y, Nathans D 1991 A naturally occurring truncated form of FosB that inhibits Fos/Jun transcriptional activity. Cell 64:751–759 [DOI] [PubMed] [Google Scholar]
- Yen J, Wisdom RM, Tratner I, Verma IM 1991 An alternative spliced form of FosB is a negative regulator of transcriptional activation and transformation by Fos proteins. Proc Natl Acad Sci USA 88:5077–5081 [DOI] [PMC free article] [PubMed] [Google Scholar]
- Jooss KU, Funk M, Muller R 1994 An autonomous N-terminal transactivation domain in Fos protein plays a crucial role in transformation. EMBO J 13:1467–1475 [DOI] [PMC free article] [PubMed] [Google Scholar]
- McClung CA, Nestler EJ 2003 Regulation of gene expression and cocaine reward by CREB and ΔFosB. Nat Neurosci 6:1208–1215 [DOI] [PubMed] [Google Scholar]
- Sabatakos G, Rowe GC, Kveiborg M, Wu M, Neff L, Chiusaroli R, Philbrick WM, Baron R 2008 Doubly truncated FosB isoform (Δ2ΔFosB) induces osteosclerosis in transgenic mice and modulates expression and phosphorylation of Smads in osteoblasts independent of intrinsic AP-1 activity. J Bone Miner Res 23:584–595 [DOI] [PMC free article] [PubMed] [Google Scholar]
- Kveiborg M, Sabatakos G, Chiusaroli R, Wu M, Philbrick WM, Horne WC, Baron R 2004 ΔFosB induces osteosclerosis and decreases adipogenesis by two independent cell-autonomous mechanisms. Mol Cell Biol 24:2820–2830 [DOI] [PMC free article] [PubMed] [Google Scholar]
- Kveiborg M, Chiusaroli R, Sims NA, Wu M, Sabatakos G, Horne WC, Baron R 2002 The increased bone mass in ΔFosB transgenic mice is independent of circulating leptin levels. Endocrinology 143:4304–4309 [DOI] [PubMed] [Google Scholar]
- Moitra J, Mason MM, Olive M, Krylov D, Gavrilova O, Marcus-Samuels B, Feigenbaum L, Lee E, Aoyama T, Eckhaus M, Reitman ML, Vinson C 1998 Life without white fat: a transgenic mouse. Genes Dev 12:3168–3181 [DOI] [PMC free article] [PubMed] [Google Scholar]
- Gundberg CM, Hauschka PV, Lian JB, Gallop PM 1984 Osteocalcin: isolation, characterization, and detection. Methods Enzymol 107:516–544 [DOI] [PubMed] [Google Scholar]
- Gundberg CM, Nieman SD, Abrams S, Rosen H 1998 Vitamin K status and bone health: an analysis of methods for determination of undercarboxylated osteocalcin. J Clin Endocrinol Metab 83:3258–3266 [DOI] [PubMed] [Google Scholar]
- Rosen ED, MacDougald OA 2006 Adipocyte differentiation from the inside out. Nat Rev Mol Cell Biol 7:885–896 [DOI] [PubMed] [Google Scholar]
- Longo KA, Wright WS, Kang S, Gerin I, Chiang SH, Lucas PC, Opp MR, MacDougald OA 2004 Wnt10b inhibits development of white and brown adipose tissues. J Biol Chem 279:35503–35509 [DOI] [PubMed] [Google Scholar]
- Chehab FF 2008 Obesity and lipodystrophy—where do the circles intersect? Endocrinology 149:925–934 [DOI] [PMC free article] [PubMed] [Google Scholar]
- Choi CS, Savage DB, Abu-Elheiga L, Liu ZX, Kim S, Kulkarni A, Distefano A, Hwang YJ, Reznick RM, Codella R, Zhang D, Cline GW, Wakil SJ, Shulman GI 2007 Continuous fat oxidation in acetyl-CoA carboxylase 2 knockout mice increases total energy expenditure, reduces fat mass, and improves insulin sensitivity. Proc Natl Acad Sci USA 104:16480–16485 [DOI] [PMC free article] [PubMed] [Google Scholar]
- Lee NK, Sowa H, Hinoi E, Ferron M, Ahn JD, Confavreux C, Dacquin R, Mee PJ, McKee MD, Jung DY, Zhang Z, Kim JK, Mauvais-Jarvis F, Ducy P, Karsenty G 2007 Endocrine regulation of energy metabolism by the skeleton. Cell 130:456–469 [DOI] [PMC free article] [PubMed] [Google Scholar]
- Rosen ED, Spiegelman BM 2006 Adipocytes as regulators of energy balance and glucose homeostasis. Nature 444:847–853 [DOI] [PMC free article] [PubMed] [Google Scholar]
- Rosen CJ 2008 Bone remodeling, energy metabolism, and the molecular clock. Cell Metab 7:7–10 [DOI] [PubMed] [Google Scholar]
- Choi CS, Fillmore JJ, Kim JK, Liu ZX, Kim S, Collier EF, Kulkarni A, Distefano A, Hwang YJ, Kahn M, Chen Y, Yu C, Moore IK, Reznick RM, Higashimori T, Shulman GI 2007 Overexpression of uncoupling protein 3 in skeletal muscle protects against fat-induced insulin resistance. J Clin Invest 117:1995–2003 [DOI] [PMC free article] [PubMed] [Google Scholar]
- Molero JC, Jensen TE, Withers PC, Couzens M, Herzog H, Thien CB, Langdon WY, Walder K, Murphy MA, Bowtell DD, James DE, Cooney GJ 2004 c-Cbl-deficient mice have reduced adiposity, higher energy expenditure, and improved peripheral insulin action. J Clin Invest 114:1326–1333 [DOI] [PMC free article] [PubMed] [Google Scholar]
- Molero JC, Turner N, Thien CB, Langdon WY, James DE, Cooney GJ 2006 Genetic ablation of the c-Cbl ubiquitin ligase domain results in increased energy expenditure and improved insulin action. Diabetes 55:3411–3417 [DOI] [PubMed] [Google Scholar]
- Minokoshi Y, Kim YB, Peroni OD, Fryer LG, Muller C, Carling D, Kahn BB 2002 Leptin stimulates fatty-acid oxidation by activating AMP-activated protein kinase. Nature 415:339–343 [DOI] [PubMed] [Google Scholar]
- Cha SH, Hu Z, Chohnan S, Lane MD 2005 Inhibition of hypothalamic fatty acid synthase triggers rapid activation of fatty acid oxidation in skeletal muscle. Proc Natl Acad Sci USA 102:14557–14562 [DOI] [PMC free article] [PubMed] [Google Scholar]
- Huypens P, Moens K, Heimberg H, Ling Z, Pipeleers D, Van de Casteele M 2005 Adiponectin-mediated stimulation of AMP-activated protein kinase (AMPK) in pancreatic β cells. Life Sci 77:1273–1282 [DOI] [PubMed] [Google Scholar]
- Dobrzyn P, Dobrzyn A, Miyazaki M, Cohen P, Asilmaz E, Hardie DG, Friedman JM, Ntambi JM 2004 Stearoyl-CoA desaturase 1 deficiency increases fatty acid oxidation by activating AMP-activated protein kinase in liver. Proc Natl Acad Sci USA 101:6409–6414 [DOI] [PMC free article] [PubMed] [Google Scholar]
- Trujillo ME, Scherer PE 2005 Adiponectin—journey from an adipocyte secretory protein to biomarker of the metabolic syndrome. J Intern Med 257:167–175 [DOI] [PubMed] [Google Scholar]
- Dyck DJ, Heigenhauser GJ, Bruce CR 2006 The role of adipokines as regulators of skeletal muscle fatty acid metabolism and insulin sensitivity. Acta Physiol (Oxf) 186:5–16 [DOI] [PubMed] [Google Scholar]
- Santaniemi M, Kesaniemi YA, Ukkola O 2006 Low plasma adiponectin concentration is an indicator of the metabolic syndrome. Eur J Endocrinol 155:745–750 [DOI] [PubMed] [Google Scholar]
- Ukkola O, Santaniemi M 2002 Adiponectin: a link between excess adiposity and associated comorbidities? J Mol Med 80:696–702 [DOI] [PubMed] [Google Scholar]
- Kelz MB, Chen J, Carlezon Jr WA, Whisler K, Gilden L, Beckmann AM, Steffen C, Zhang YJ, Marotti L, Self DW, Tkatch T, Baranauskas G, Surmeier DJ, Neve RL, Duman RS, Picciotto MR, Nestler EJ 1999 Expression of the transcription factor ΔFosB in the brain controls sensitivity to cocaine. Nature 401:272–276 [DOI] [PubMed] [Google Scholar]
- Olausson P, Jentsch JD, Tronson N, Neve RL, Nestler EJ, Taylor JR 2006 ΔFosB in the nucleus accumbens regulates food-reinforced instrumental behavior and motivation. J Neurosci 26:9196–9204 [DOI] [PMC free article] [PubMed] [Google Scholar]
- Brown JR, Ye H, Bronson RT, Dikkes P, Greenberg ME 1996 A defect in nurturing in mice lacking the immediate early gene fosB. Cell 86:297–309 [DOI] [PubMed] [Google Scholar]