Abstract
The equilibrium solubility of Mg-containing β-tricalcium phosphate (βMgTCP) with various magnesium contents was determined by immersing βMgTCP powder for 27 months in a CH3COOH–CH3COONa buffer solution at 25 °C under a nitrogen gas atmosphere. The negative logarithm of the solubility product (pKsp) of βMgTCP was expressed as pKsp = 28.87432 + 1.40348C − 0.3163C2 + 0.04218C3 − 0.00275C4 + 0.0000681659C5, where C is the magnesium content in βMgTCP (mol.%). The solubility of βMgTCP decreased with increasing magnesium content owing to the increased structural stability and possible formation of a whitlockite-type phase on the surface. As a result, βMgTCP with 10.1 mol.% magnesium had a lower solubility than that of hydroxyapatite below pH 6.0. βMgTCP was found to be more soluble than zinc-containing β-tricalcium phosphate given the same molar content of zinc or magnesium. The solubility of βMgTCP and release rate of magnesium from βMgTCP can be controlled by adjusting the Mg content by selecting the appropriate pKsp.
Keywords: Magnesium-containing tricalcium phosphate, Solubility product, Dissolution
1. Introduction
Although magnesium (Mg) is the fourth major cation in the human body and the second most prevalent intracellular cation, approximately 50–65% of the total amount of Mg is in bone tissue and only 1.0% is in the extracellular fluid [1, 2]. Mg is essential for the normal function of the parathyroid glands and vitamin D metabolism [3] and Mg depletion results in significantly lower serum parathyroid hormone (PTH) and 1,25(OH)2-vitamin D levels [4]. Mg can directly stimulate osteoblast proliferation [5] and Mg depletion causes cellular growth inhibition because of the resultant reduction in DNA, RNA and protein synthesis [6, 7]. Mg binds to the surface of apatite crystals and inhibits their formation and growth [8, 9], and decreased bone Mg content and high crystallinity were found to be associated with senile osteoporosis [10]. These Mg-deficiency-associated adverse effects together could impair bone growth and mineralization, reduce bone quality, strength and density, and increase bone fragility [11, 12]. Mg deficiency has been suggested to be a potential risk factor for osteoporosis [13–15]. Mg therapy was reported to increase the bone mass in patients suffering from postmenopausal osteoporosis [13,16,17]. Dietary Mg is absorbed in the intestine through both active and passive transport systems [18,19].
Mg-containing biomaterials have been fabricated, including Mg-containing calcium phosphates [9,20–26], Mg-containing bioactive glasses [27], akermanite (Ca2MgSi2O7) [28] and bredigite (Ca7MgSi4O16) [29]. Among them, β-tricalcium phosphates in ceramic form are highly biocompatible and resorbable in bone tissue. Therefore, Mg-containing β-tricalcium phosphates (βMgTCP) can be used as an Mg carrier [30].
In vivo resorption of βTCP-based material is controlled by two factors: self-dissolution and cell-mediated dissolution. The evaluation of self-dissolution behavior aimed to control the release rate of Mg, which will help to study the effects of Mg release from βMgTCP on the cell-mediated dissolution or cell function. The self-dissolution rate J = f(Ksp) is a function of the solubility product Ksp, which is the equilibrium ion activity product. However, the available data on the equilibrium solubility of βMgTCP is limited to only a narrow Mg content (7.7–13 mol.% Mg) [31]. In this study, the equilibrium solubility of βMgTCP was determined over a wider range of Mg contents: from 0 to 10 mol.%.
2. Materials and methods
βMgTCP powders were synthesized from pure βTCP (Advance Co. Ltd., Tokyo, Japan) and 10 mol.% βMgTCP (Ca2.7Mg0.3(PO4)2) prepared by the solution method described elsewhere [32]. Briefly, the starting materials were high-purity calcium carbonate (99.99 wt.%, Ube Materials, Ube, Japan), reagent-grade phosphoric acid (85 wt.%, Nakalai Tesque, Kyoto, Japan) and reagent-grade magnesium nitrate hexahydrate (99 wt.%, Wako Pure Chemical Industries, Ltd Co., Tokyo, Japan). A suspension of 0.6 M Ca(OH)2 was prepared using calcium oxide obtained by heating calcium carbonate at 1000 °C for 3 h. The suspension wa s mixed with 2.6 M Mg(NO3)2·6H2O and a phosphoric acid solution, followed by filtration and heat treatment at 850 °C for 1 h to obtain the 10 mol.% βMgTCP powder. The mixture of 10 mol.% βMgTCP and various amounts of pure βTCP powders were ground for 20 min in an alumina mortar and heated at 1000°C for 5 h. βMgTCP powders with magnesium contents of 0.0, 2.3, 4.9, 7.3 and 10.1 mol.% were obtained (Table 1).
Table 1.
Chemical composition and lattice constants of βTCP and βMgTCP used in the solubility study
| CaO (wt.%) | P2O5 (wt.%) | MgO (wt.%) | Total (wt.%) | (Ca+Mg)/P (mol ratio) | Mg/(Ca+Mg) (mol.% ) | Lattice constants | ||
|---|---|---|---|---|---|---|---|---|
| a (Ǻ) | c (Ǻ) | |||||||
| 1 | 54.3±0.4 | 45.9±0.5 | 0 | 100.2±0.7 | 1.49±0.02 | 0 | 10.43(2) | 37.39(2) |
| 2 | 52.6±0.7 | 46.0±0.3 | 0.92±0.2 | 99.5±0.6 | 1.48±0.02 | 2.3±0.1 | 10.40(2) | 37.35(2) |
| 3 | 51.5±0.4 | 46.8±0.6 | 1.93±0.3 | 100.3±0.6 | 1.46±0.03 | 4.9±0.1 | 10.37(2) | 37.25(2) |
| 4 | 50.5±0.2 | 46.0±0.2 | 2.90±0.4 | 99.4±0.4 | 1.50±0.01 | 7.3±0.1 | 10.35(2) | 37.16(2) |
| 5 | 48.7±0.5 | 47.0±0.4 | 3.96±0.4 | 99.8±0.6 | 1.46±0.02 | 10.1±0.1 | 10.34(2) | 37.13(2) |
The βMgTCP powders at 15 mg each were immersed in 15 ml of 0.08 M CH3COOH–CH3COONa buffer solution of pH 5.5 at 25 ± 3 °C in poly ethylene bottles for 1.5, 3 and 27 months. The ratio of powders surface area to the solution volume was 0.00035±0.00015 m2 ml−1, which was estimated from the grain size of the powders. TCP and MgTCP can convert into dicalcium phosphate dihydrate (DCPD), octacalcium phosphate (OCP) and hydroxyapatite (HAP) in an aqueous solution, depending on pH, which can lead to serious errors in measuring solubility. To minimize the error, we carried out the determination of the equilibrium solubility of TCP and MgTCP in a solution at pH 5.5, at which point the solubility of TCP was nearly equivalent to that of DCPD and OCP. The 1.5- and 3-month immersions were performed under air with slow shaking by bottle rotation. The 27-month immersion was performed without shaking in a nitrogen gas atmosphere to avoid contamination with atmospheric CO2. The suspensions were then filtered using a Millipore filter of 0.22 μm pore size.
The immersion solutions were analyzed for calcium, phosphorus and magnesium using the model SPS 7800 inductively coupled plasma (ICP) spectrometer (Seiko Instruments, Tokyo, Japan), within an error of ±1.0%. The uncertainty of pH measurements was ±0.02 pH units. X-ray diffraction (XRD) patterns of the βMgTCP powders were measured before and after the immersion using an X-ray diffractometer (RINT-2500, Rigaku, Japan). The βMgTCP powders before and after the immersion were characterized using a scanning electron microscope (SEM; JSM-5400, JEOL, Japan) and Fourier transform infrared spectroscopy (FTIR; JASCO FT/IR-350, Japan).
The solubility product (Ksp) of βMgTCP was calculated from the equation:
| (1) |
and the Debye–Hückel limiting law,
| (2) |
The definitions of all the abbreviations used in the equations and the equilibrium constants used in the calculations [33–38] are listed in Table 2.
Table 2.
| [i] | Concentration of species i (mol l−1) | ||
| (i) | Activity of i (mol l−1) | ||
| ai | Effective diameter of ion i | Ref. [33] | |
| A | Parameter A for Debye-Hükel limiting law | 0.51144 | |
| B | Parameter B for Debye-Hükel limiting law | 107.517 | |
| fi | Activity coefficient for species i | ||
| J | P/(HPO42−) | ||
| m | Total ionic strength of the solution | ||
| P | Total phosphate concentration (mol l−1) | ||
| S | Concentration of ion pairs (H2PO4)22− | ||
| T | Total concentration of ion pairs CaHPO4o and CaH2PO4+ | ||
| U | Total concentration of ionpairs MgHPO4o and MgH2PO4+ | ||
| Zi | Valence of ion I | ||
| First dissociation constant of phosphoric acid | 10−2.127 | Ref. [34] | |
| Second dissociation constant of phosphoric acid | 10−7.20 | Ref. [35] | |
| Third dissociation constant of phosphoric acid | 10−12.325 | Ref. [36] | |
| Ionic product for water | 10−13.99 | Ref. [37] | |
| Dissociation constants of CaHPO40 ion-pair | 10−2.3874 | Ref. [36] | |
| Dissociation constants of CaH2PO4+ ion-pair | 10−0.9138 | Ref. [36] | |
| Dissociation constants of MgHPO40 ion-pair | 10−2.852 | Ref. [38] | |
| Dissociation constants of MgH2PO4+ ion-pair | 10−1.276 | Ref. [38] |
The validities of the present computation algorithm and program are shown in Table 3. The present algorithm and program accurately reproduced published Ksp values for βTCP and βMgTCP [31, 39] when the corresponding reported raw data on calcium, phosphorous and magnesium concentrations, and pH were used for the calculation.
Table 3.
Validation of present calculation algorithm and program
| Mg/(Ca+Mg) (mol.%) | Negative logarithms of ionic activity products
|
|
|---|---|---|
| Published value | Present value * | |
| 0 | 28.90±0.07 [ 33 ] | 28.88±0.07 |
| 7.7 | 32.9±0.1 [31] | 33.0±0.1 |
| 11.6 | 33.4±0.2 [31] | 33.5±0.2 |
| 13.3 | 33.5±0.1 [31] | 33.7±0.1 |
The values were calculated by using the Ca, Mg and P concentrations and pH values published in the literature.
The ion products of DCPD, OCP and HAP, which are expressed as (Ca2+)(H+)(PO43−), (Ca2+)4(H+)(PO43−)3 and (Ca2+)10(PO43−)6(OH−)2, respectively, were also calculated from the measured concentrations and pH. These values were compared with the reported solubility products of DCPD, OCP and HAP in order to determine whether the solutions were saturated with respect to these phases as well after the equilibration.
3. Results
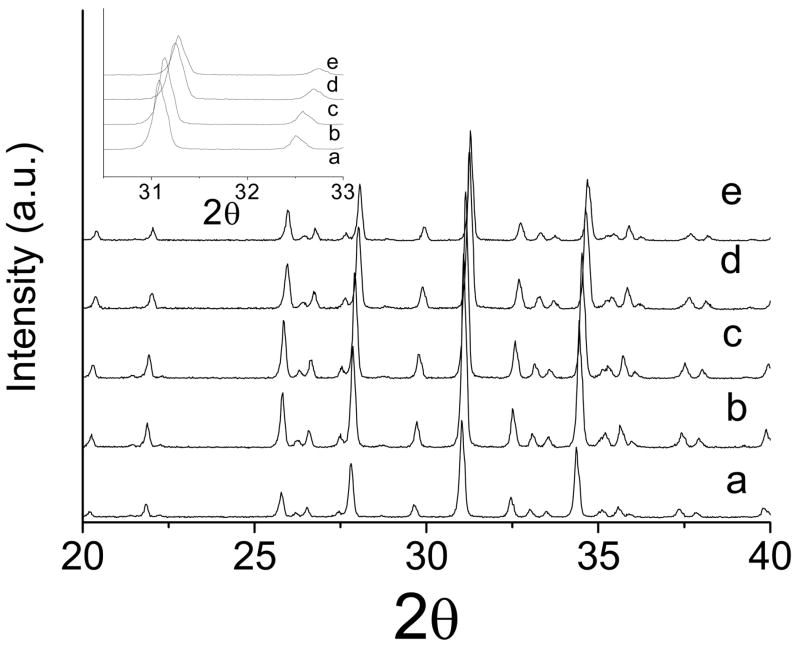
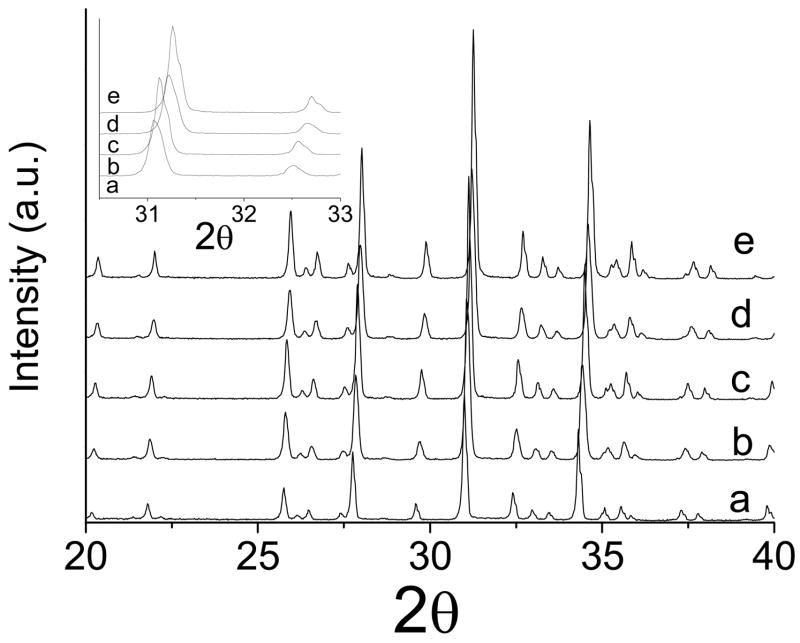
Figs. 1 and 2 show the XRD patterns of βMgTCP before and after the 27-month immersion, respectively. All the synthesized βMgTCP powders were proven to be single phase. Substitution of Mg2+ for Ca2+ in the βTCP structure was confirmed by the linear decrease in lattice constants with increasing Mg content (Table 1). After the 27-month immersion, the XRD patterns showed single-phase βMgTCP or whitlockite. Although slight increases of 0.03–0.05% in the a-parameter were observed after the 27-month immersion compared with those before the immersion, the increases were not statistically significant.
Fig. 1.
The XRD patterns of βTCP and βMgTCP with different magnesium contents before immersion: (a) 0 mol.%; (b) 2.3 mol.%; (c) 4.9 mol.%; (d) 7.3 mol.%; (e) 10.1 mol.%.
Fig. 2.
The X-ray diffraction patterns of βTCP and βMgTCP with different magnesium contents after immersion for 27 months: (a) 0 mol.%; (b) 2.3 mol.%; (c) 4.9 mol.%; (d) 7.3 mol.%; (e) 10.1 mol.%.
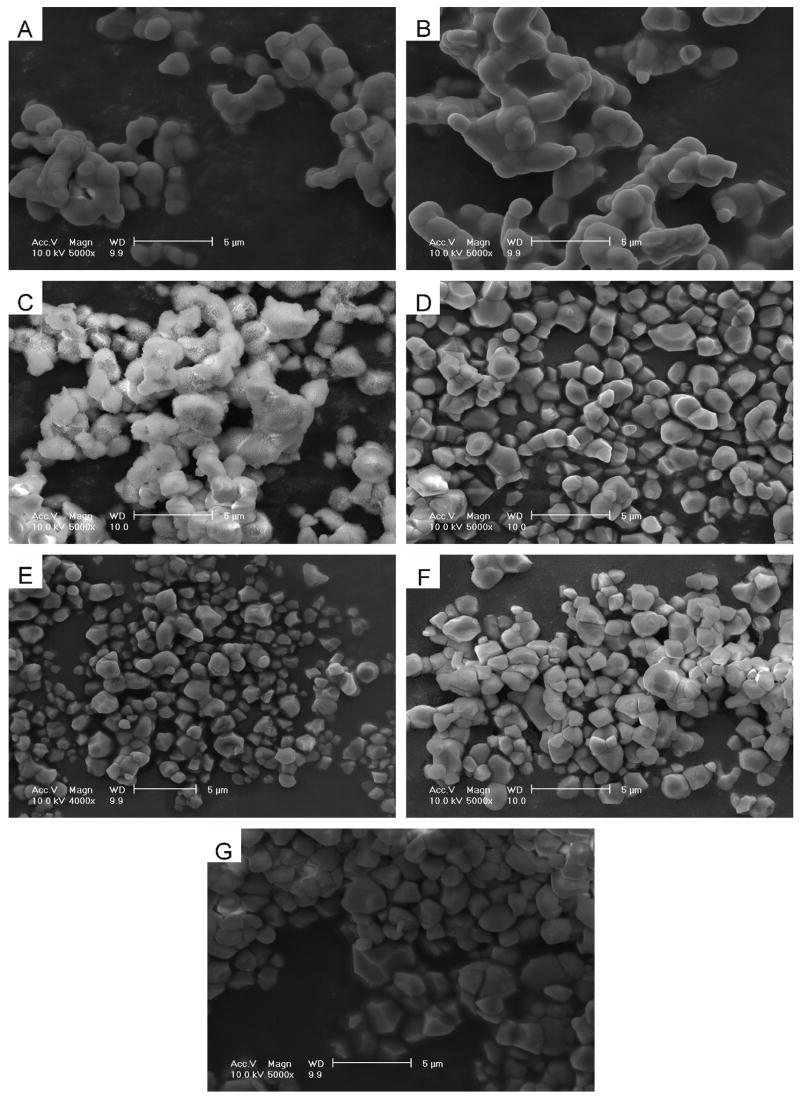
Fig. 3 shows the SEM images of the βTCP and βMgTCP powders before and after the 27-month immersion. Before immersion, the βTCP and βMgTCP powder consisted of round grains, 2–5 μm in size, sintered partially by the heat treatment at 1000°C. After the 27-month immersion, the grains beca me polyhedral in shape due to dissolution on the grain surfaces and boundaries. βTCP grains after the immersion showed two distinct surfaces: a smooth surface with no precipitate and a rough surface with precipitate. βMgTCP grains after the immersion showed smooth surfaces only.
Fig. 3.
SEM images for the powders of βTCP (A) and βMgTCP with 10.1 mol.% Mg (B) before immersion; and βTCP(C), βMgTCP with 2.3 mol.% Mg (D), 4.9 mol.% Mg (E), 7.3 mol.% Mg (F) and 10.1 mol.% Mg (G) after immersion for 27 months.
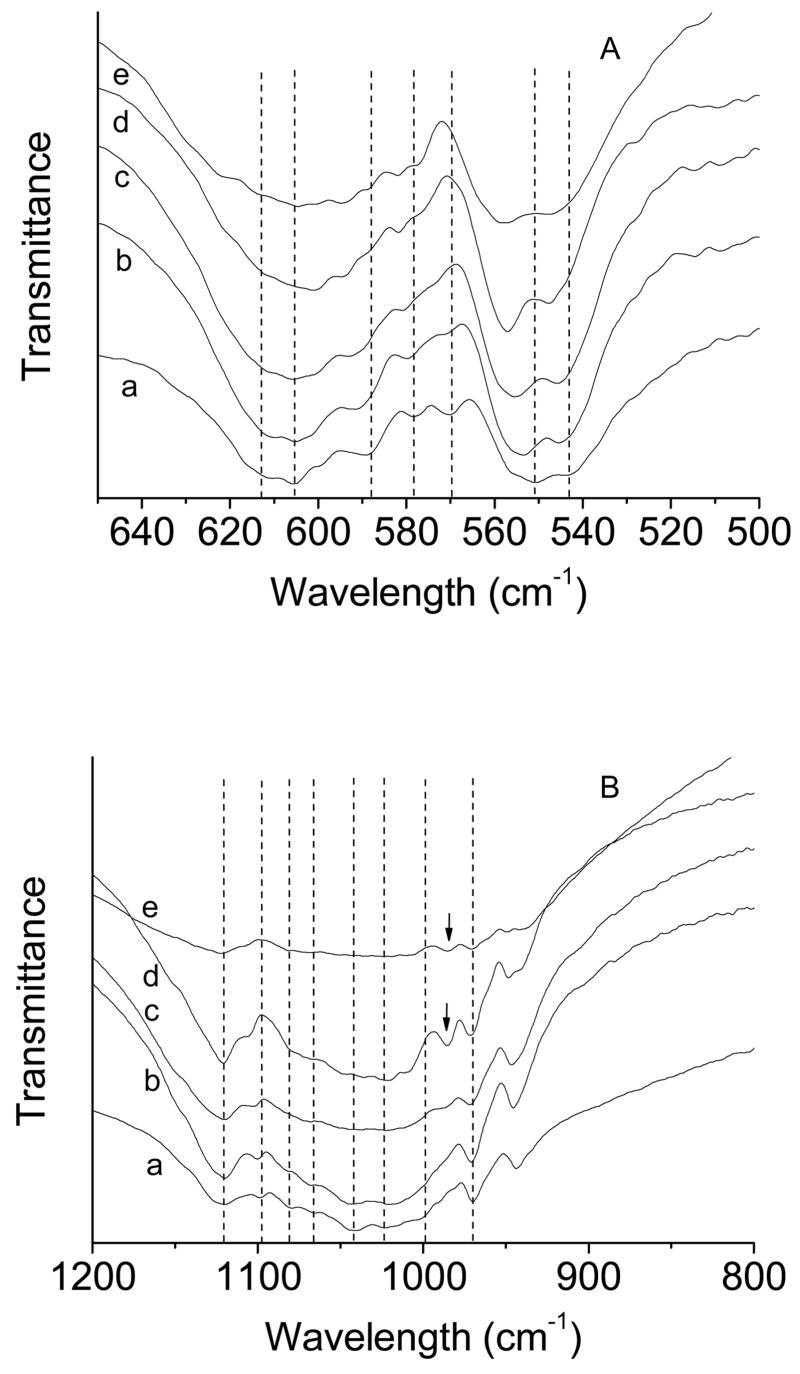
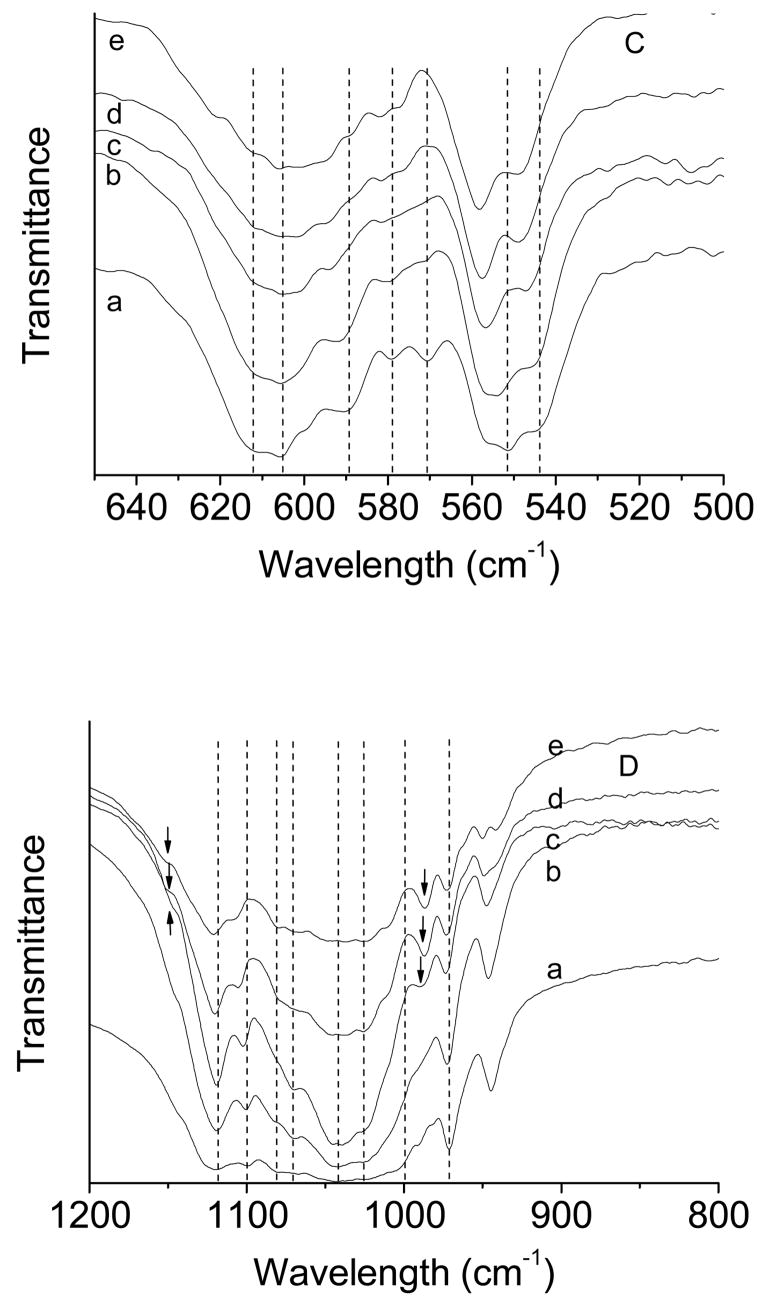
Fig. 4 shows the FTIR spectra of βTCP and βMgTCP before and after the 27-month immersion. βTCP showed its characteristic absorption bands at 543, 551, 570, 578, 589, 605 and 612 cm−1 in the γ4 PO4 domain (a of Fig. 4A) and those at 970, 998, 1023, 1042, 1066,1080, 1097 and 1120 cm−1 in the γ3 PO4 domain (a of Fig. 4B). βMgTCP with 10.1 mol.% Mg showed absorption bands at 548, 558, 557, 582, 594, 612 and 619 cm−1 in the γ4 PO4 domain (e of Fig. 4A). βMgTCP with 7.3 and 10.1 mol.% Mg showed an additional band at 986–990 cm−1 that was absent in βMgTCP with Mg lower than 7.3 mol.% (Fig. 4 B). After the 27-month immersion, the absorption bands at 530–570 cm−1 in the γ4 PO4 domain became sharp, and showed an increase in the ratio of band intensity at 551–558 cm−1 to that at 543–548 cm−1 (Fig. 4C). The increase in band intensity ratio indicated formation of whitlockite [40]. Whitlockite-specific bands at 986–990 and 1150 cm−1 became strong and sharp in βMgTCP with 4.9, 7.3 and 10.1 mol.% Mg [41].
Fig. 4.
FTIR spectra of βTCP and βMgTCP before (A, B) and after (C, D) immersion for 27 months. The Mg contents are 0 mol.% (a), 2.3 mol.% (b), 4.9 mol.% (c), 7.3 mol.% (d) and 10.1 mol.% (e). The arrows indicate bands characteristic of whitlockite.
Tables 4–6 and Fig. 5 show the composition and pH values of the equilibrium solutions, and the negative logarithms of the solubility products (pKsp) of βTCP and βMgTCP. The higher the magnesium content of βMgTCP, the larger the amount of magnesium released (Tables 4–6). However, the solubility of the βMgTCP powder as a whole decreased with increasing magnesium content.
Table 4.
Solubility of βTCP and βMgTCP after immersion for 1.5 months at 25 oC
| Mg/(Ca+Mg) (mol.%) | Composition of equilibrium solutions
|
pKsp | |||
|---|---|---|---|---|---|
| Ca (mM) | P (mM) | Mg (mM) | pH | ||
| 0 | 4.444±0.102 | 3.031±0.055 | 0±0.000 | 5.84±0.01 | 29.30±0.04 |
| 2.3 | 2.963±0.064 | 2.014±0.048 | 0.059±0.001 | 5.70±0.01 | 30.80±0.08 |
| 4.9 | 2.186±0.103 | 1.564±0.066 | 0.099±0.004 | 5.65±0.01 | 31.65±0.08 |
| 7.3 | 1.762±0.036 | 1.306±0.029 | 0.134±0.002 | 5.62±0.01 | 32.26±0.05 |
| 10.1 | 1.384±0.019 | 1.071±0.026 | 0.164±0.003 | 5.59±0.00 | 32.87±0.04 |
Table 6.
Solubility of βTCP and βMgTCP after immersion for 27 months at 25 °C
| Mg/(Ca+Mg) (mol.%) | Composition of equilibrium solutions
|
pKsp | |||
|---|---|---|---|---|---|
| Ca (mM) | P (mM) | Mg (mM) | pH | ||
| 0 | 5.159 ± 0.057 | 3.468 ± 0.035 | 0 ± 0.000 | 5.87 ± 0.01 | 28.87 ± 0.05 |
| 2.3 | 3.002 ± 0.017 | 2.094 ± 0.028 | 0.06 ± 0.000 | 5.66 ± 0.01 | 30.87 ± 0.03 |
| 4.9 | 2.295 ± 0.009 | 1.645 ± 0.013 | 0.104 ± 0.000 | 5.6 ± 0 | 31.75 ± 0.01 |
| 7.3 | 1.915 ± 0.011 | 1.41 ± 0.010 | 0.149 ± 0.002 | 5.57 ± 0 | 32.27 ± 0.01 |
| 10.1 | 1.576 ± 0.042 | 1.217 ± 0.022 | 0.191 ± 0.004 | 5.545 ± 0.02 | 32.77 ± 0.08 |
Fig. 5.
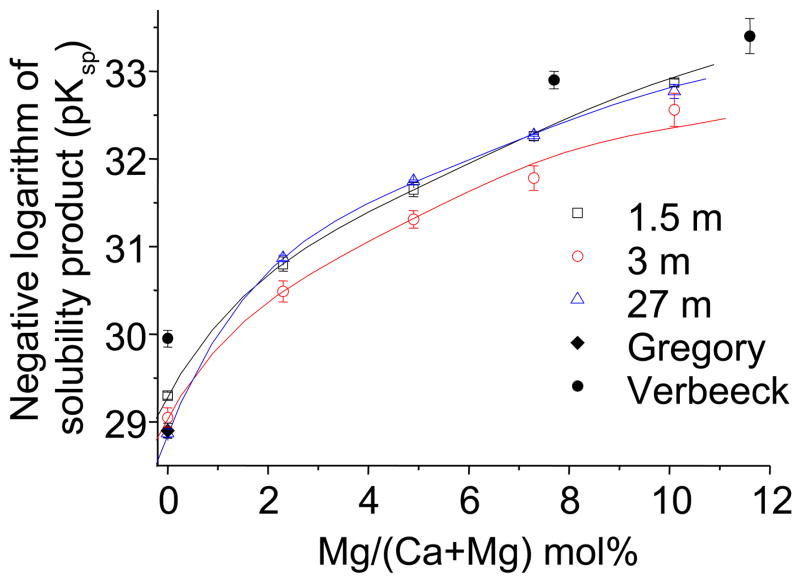
Negative logarithms of the solubility product of βTCP and βMgTCP as a function of the magnesium content after immersion for 1.5, 3 and 27 months; comparison to the previous pKsp data of βTCP (published by Gregory et al. [33]) and βMgTCP (published by Mcdowell et al. [31]).
The pKsp of βTCP and βMgTCP as functions of magnesium content after different immersion times are shown in Fig. 5. The 1.5-month immersion under ambient air did not reach equilibrium, as evidenced by the pKsp of βTCP (29.30 ± 0.04), which was significantly higher (p<1 × 10⁻⁵) than that (29.05 ± 0.11) obtained in the 3-month immersion. The pKsp of βTCP after the 27-month immersion under nitrogen gas (28.87 ± 0.04) was significantly lower than that after the 3-month immersion under ambient air (29.05±0.11). It should be noted that the pKsp of βMgTCP after the 27-month immersion were significantly higher than those after the 3-month immersion under air ambient.
The relationship between the pKsp and the magnesium contents of βTCP and βMgTCP after the immersion for 1.5, 3 and 27 months was determined by regression analysis as Eqs. (3), (4) and (5), respectively, using the fifth-degree equation:
| (3) |
| (4) |
| (5) |
where C is the magnesium content of βMgTCP in mol.%. Quadratic, cubic and quartic regression equations fit less precisely the plots of pKsp as a function of the magnesium content than the fifth-degree equations. From the above results, it can be observed that, with increasing magnesium content, the pKsp increased and the solubility of βMgTCP decreased under all three conditions.
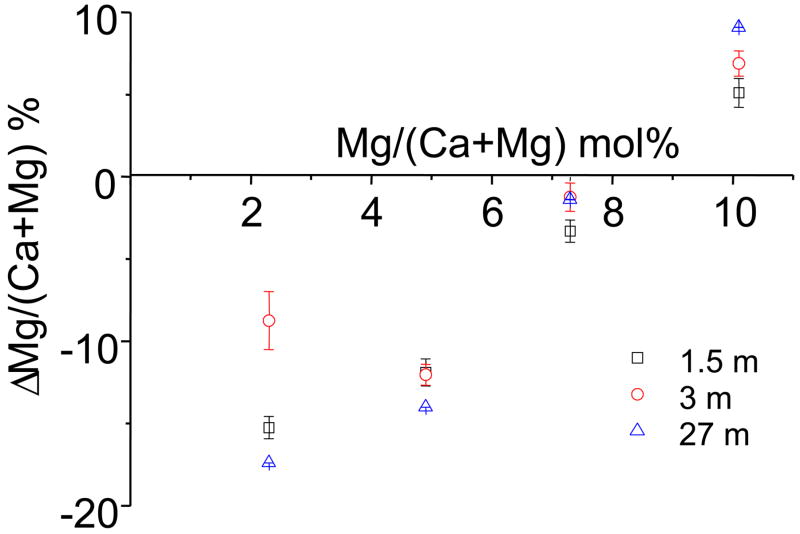
Fig. 6 shows the index of incongruent solubility, Δ[Mg/(Ca+Mg)], of the βMgTCP defined as:
where Rs and Rp represent the Mg/(Ca+Mg) molar ratios of the equilibrium solution and immersed powder, respectively. Although the Mg/(Ca+Mg) molar ratios of the βMgTCP powders were 0.023, 0.049, 0.073 and 0.101, the equilibrium solutions showed the Mg/(Ca+Mg) molar ratios to be 0.019, 0.043, 0.072 and 0.108, respectively, after the 27-month immersion. These changes in the Mg/(Ca+Mg) molar ratios gave Δ[Mg/(Ca+Mg)] values of −17.39, −14, −1.37 and 9.09% for βMgTCP with 2.3, 4.9, 7.3 and 10.1 mol.% Mg, respectively.
Fig. 6.
The magnesium exchange percentage between the initial powder and the solution after the 1.5-, 3- and 27-month immersions of βMgTCP with different Mg contents.
The negative logarithms of the ion products of HAP, OCP and DCPD showed that all the solutions were undersaturated with respect to DCPD and saturated or supersaturated with respect to HAP after the immersion (Table 7). In addition, the immersion solutions for βTCP were also saturated with respect to OCP while those for βMgTCP were undersaturated.
Table 7.
Negative logarithms of ion products for various phases
| Negative logarithms of ionic activity products Mg/(Ca+Mg) (mol.%)
|
|||||
|---|---|---|---|---|---|
| phase | 0 | 2.3 | 4.9 | 7.3 | 10.1 |
| HAP | 105.55±0.32§§ | 111.84±0.20§§ | 114.46±0.03§§ | 116.03±0.04§ | 117.58±0.76§ |
| OCP | 47.84±0.11§ | 50.35±0.07 | 51.42±0.01 | 52.07±0.01 | 52.71±0.24 |
| DCPD | 6.63±0.02 | 7.26±0.01 | 7.53±0.00 | 7.71±0.00 | 7.88±0.03 |
indicate saturation and supersaturation with respect to the corresponding phase. Values of 116.65–118.65, 46.9–49.6 and 6.55 have been used for the negative logarithms of solubility products for HAP, OCP and DCPD, respectively, to define saturation and supersaturation.
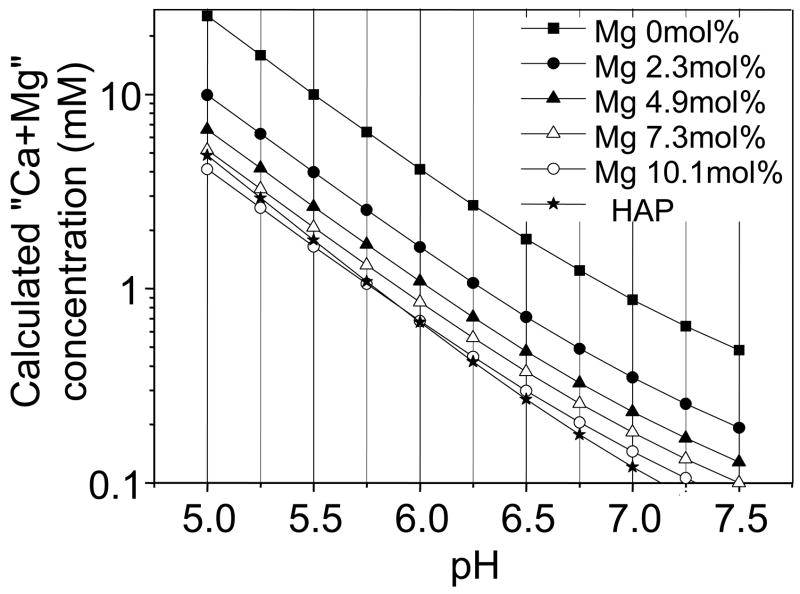
By using the pKsp, the solubility of βMgTCP was calculated as a function of pH in the range from 5.0 to 7.5, as shown in Fig. 7. The Ca+Mg concentration in the solution, reflecting the solubility of βMgTCP, decreased at higher pH. βMgTCP with 10.1 mol.% magnesium exhibited solubility lower than that of HAP below pH 6.0 and higher than that of HAP above pH 6.0.
Fig. 7.
Solubility isotherm of βTCP, βMgTCP and HAP at 25 °C as a function of pH (5.0 – 7.5).
4. Discussion
The equilibrium solubility of βMgTCP decreased with increasing magnesium content of βMgTCP up to 10 mol.%. From the SEM images of βTCP and βMgTCP, it can be seen that all the powders with different magnesium content showed a similar particle size of about 2–5 μm. Base on the density of βTCP (3.067 g cm−3) and the particle size, we can estimate the specific surfaces of βTCP and βMgTCP to be about 0.20–0.50 cm2 g−1 and infer that the specific surfaces would not have obvious effects on the solubility. Moreover, in this study, 27 months were more than long enough to achieve the solubility equilibrium in the buffer solution. The decrease in solubility can be attributed to the increased stability of the βTCP structure caused by the addition of magnesium ions. Because the ionic radius of magnesium is 0.072 nm for six coordinations, magnesium ions reside in the Ca(4) and Ca(5) sites in the βTCP structure, which can accommodate divalent cations with ionic radii from 0.060 to 0.080 nm [42]. The increase in the stability of the βTCP structure has been demonstrated by an increase in the β-to-α transition temperature of TCP with the incorporation of magnesium [43]. TCP has three polymorphs: βTCP below 1180 oC, αTCP between 1180 and 1430 oC, and α′TCP above 1430 oC. Even 1 mol.% Mg incorporated into the βTCP structure increases the β-to-α transition temperature up to 1230 oC [43]. An increase in the stability and, hence, a decrease in the standard free energy of formation of βTCP inevitably leads to an increase in the standard free energy of βTCP solultion (ΔsGo), which is the sum of the standard free energies of solution of Ca2+, Mg2+ and PO43− ions minus the standard free energy of formation of βTCP. The increase in ΔsGo leads to a decrease in the solubility constant (Ks) since Ks is given by ΔsGo=−RTlnKs, where R is the gas constant (8.314 J K−1 mol−1) and T is the absolute temperature [44]. A similar decrease in the solubility of βTCP was reported for zinc-containing βTCP (βZnTCP) [45].
Another possible reason for the solubility decrease could be the formation of a whitlockite-type phase on the surface of βMgTCP. In the case of βMgTCP, magnesium whitlockite was suggested to be the equilibrating solid present on the surface of βMgTCP and was responsible for the decrease in the solubility [31]. Although it is difficult to distinguish between magnesium whitlockite and βMgTCP by XRD, as shown in Fig 2, slight but nonsignificant increases in a lattice parameter were observed, indicating the presence of magnesium whitlockite [46]. FTIR spectra also supported the formation of a whitlockite-type phase. It is reported that whilockite has higher intensity ratio of the absorption band at 551–558 cm−1 to that at 543–548 cm−1 than βTCP has, and that the characteristic bands of whilockite appear at 990 and 1150 cm−1 [40,41]. In the present study, FTIR spectra of βMgTCP with 4.9, 7.3 and 10.1 mol.% Mg after the immersion showed an increase in the ratio of the absorption band intensity at 551–558 cm−1 compared to that at 543–548 cm−1, and an increase in the absorption band intensity at around 986–990 and 1150 cm−1. However, HPO42− bands were not clearly observed in the βMgTCP after the immersion, although the HPO42−bands appeared in the whitlockite prepared by the precipitation method or hydrothermal method using Ca2+-, Mg2+- and phosphate-containing solution [40]. From these results, it is possible that, taking advantage of structural similarity between βMgTCP and whitlockite, a whitlockite-type phase was formed only in a very thin surface layer of βMgTCP, which made the absorption band of HPO42− difficult to detect by FTIR. SEM observation supports the above assumption: no appreciable precipitate with a rhombohedral morphology characteristic of whitlockite was observed by SEM among the βMgTCP particles and on the smooth surface of βMgTCP after the immersion.
The index of incongruent solubility, Δ[Mg/(Ca+Mg)], which reflects the difference in the Mg/(Ca+Mg) molar ratios between the initial βMgTCP powder and equilibrium solutions, also indicates the presence of the whitlockite-type phase. The indexes of incongruent solubility of βMgTCPs with 2.3, 4.9, 7.3 and 10.1 mol.% magnesium were −17.39, −14, −1.37 and 9.09%, respectively, which indicate increases in the magnesium content in the former three βMgTCP powders and a decrease in the magnesium content in the last βMgTCP powder after the 27-month immersion. As a result, the magnesium contents of the βMgTCP powder changed to 2.5, 5.1, 7.4 and 10.0 mol.%, respectively, after the 27-month immersion. The increases and the decrease in magnesium content were statistically significant (p=5×10⁻⁴−1×10⁻¹⁰) except for the change from 7.3 to 7.4 mol.%. Note that the magnesium content is 10 mol.% (C18Mg2H2(PO4)14) for synthetic magnesium whitlockite [47,48]. In addition, acidic conditions (pH 5 to 6) favor the crystallization of whitlockite [24,44,46,48], which is related to the fact that HPO42− ions must be present in order to be incorporated into the whitlockite lattice. On the other hand, the ionic product corresponding to whitlockite, defined as
yielded a value of 106.2 ± 0.3 on the basis of the concentration and pH data of the 27-month immersion of βMgTCP powder with 10.1 mol.% magnesium. It was reported that whitlockite crystallized on whitlockite seeds in metastable supersaturated solutions with an IPw of 106.3 at 37 °C [48]. The solubility after the 3-month immersion under ambient air is significantly higher than that after the 27-month immersion under nitrogen, which could indicate the dissolution of βMgTCP and the precipitation of the whitlockite-type phase. All these observations suggest the formation of a whitlockite-type phase on the surface of βMgTCP, although further clarification is required.
The pKsp reported here for βMgTCP are significantly lower than those reported previously (Fig. 5). pKsp for βMgTCP with magnesium contents of 0.0, 7.7, 11.6 and 13.3 mol.% were previously reported as 29.9 ± 0.1, 32.9 ± 0.1, 33.4 ± 0.2 and 33.5 ± 0.1, respectively, which were obtained by 2-week equilibration with stirring [31]. However, the pKsp reported here for βMgTCP with magnesium contents of 0.0, 7.7, 11.6 and 13.3 mol.% were calculated as 28.87, 32.36, 32.96 and 33.14, respectively, which were significantly lower than the above values. The discrepancy in pKsp value is not explained by the differences in values used for the association constants of CaH2PO4+ and CaHPO40: the difference in the association constants leads only to a 0.03% difference in pKsp at most. The pKsp reported here for pure TCP (28.87 ± 0.04) coincided with that reported by Gregory (28.90 ± 0.07), with no statistically significant difference [39]. Therefore, the present 27-month immersion can be more completely equilibrated than that in the previous study.
βMgTCP was found to be more soluble than βZnTCP. The solubility of βZnTCP also decreased with increasing zinc content up to 10 mol.%, which was nearly the limit of the solid solution of zinc in TCP. The relationship between pKsp and zinc content C is reported as follows:
βZnTCP exhibits a higher pKsp than MgTCP given the same molar ratio of zinc or magnesium, which shows that MgTCP is more soluble than ZnTCP. At a zinc content of 6 mol.%, the solubility of βZnTCP decreased to a level corresponding to that of HAP, while a magnesium content of 10.1 mol.% is required to reduce the solubility of βMgTCP to the same level.
Finally, the relationship between the solubility and magnesium content of MgTCP has been confirmed. Thus, the solubility and release rate of Mg can be controlled by adjusting the Mg content in MgTCP by selecting the appropriate pKsp, if other factors such as particle size and surface area are unchanged.
Conclusion
The equilibrium solubility of βMgTCP was determined by immersing βMgTCP powders in the CH3COOH–CH3COONa buffer solution of pH 5.5 at 25 ± 3 °C for 27 months under a nitrogen gas atmosphere. The negative logarithm of the solubility product (Ksp) of βMgTCP was expressed as pKsp = 28.87432 + 1.40348C − 0.3163C2 + 0.04218C3 − 0.00275C4 + 0.0000681659C5, where C is the magnesium content in βMgTCP in mol.%. The pKsp for βMgTCP were significantly lower than those reported previously. The solubility of βMgTCP decreased with increasing magnesium content. This decrease in solubility results from an increase in the stability of βMgTCP upon magnesium incorporation. The decrease in solubility could also result from the formation of a whitlockite-type phase on the surface of βMgTCP during equilibration, which requires further clarification.
Table 5.
Solubility of βTCP and βMgTCP after immersion for 3 months at 25 °C
| Mg/(Ca+Mg) (mol.%) | Composition of equilibrium solutions
|
pKsp | |||
|---|---|---|---|---|---|
| Ca (mM) | P (mM) | Mg (mM) | pH | ||
| 0 | 4.607±0.143 | 3.175±0.099 | 0±0.000 | 5.88±0.03 | 29.05±0.11 |
| 2.3 | 2.855±0.051 | 2.006±0.038 | 0.061±0.001 | 5.79±0.02 | 30.49±0.12 |
| 4.9 | 2.220±0.067 | 1.618±0.061 | 0.100±0.003 | 5.73±0.02 | 31.31±0.10 |
| 7.3 | 1.796±0.056 | 1.346±0.036 | 0.140±0.003 | 5.73±0.03 | 31.78±0.14 |
| 10.1 | 1.401±0.030 | 1.064±0.032 | 0.170±0.005 | 5.67±0.04 | 32.56±0.19 |
Acknowledgments
The authors are grateful to Prof. Noboru Ichinose and Miss Tomomi Hida for their technical support. This study was supported in part by research grant no. EB003070 (PI: RZ LeGeros) from the NIBIB/NIH.
Footnotes
Publisher's Disclaimer: This is a PDF file of an unedited manuscript that has been accepted for publication. As a service to our customers we are providing this early version of the manuscript. The manuscript will undergo copyediting, typesetting, and review of the resulting proof before it is published in its final citable form. Please note that during the production process errors may be discovered which could affect the content, and all legal disclaimers that apply to the journal pertain.
References
- 1.Rude RK, Gruber HE. Magnesium deficiency and osteoporosis: animal and human observations. J Nutr Biochem. 2004;15:710. doi: 10.1016/j.jnutbio.2004.08.001. [DOI] [PubMed] [Google Scholar]
- 2.Okuma T. Magnesium and bone strength. Nutrition. 2001;17:679. doi: 10.1016/s0899-9007(01)00551-2. [DOI] [PubMed] [Google Scholar]
- 3.Zofkova I, Kancheva RL. The relationship between magnesium and calciotropic hormones. Magnesium Res. 1995;8:77. [PubMed] [Google Scholar]
- 4.Rude RK, Gruber HE, Norton HJ, Wei LY, Frausto A, Kilburn J. Dietary magnesium reduction to 25% of nutrient requirement disrupts bone and mineral metabolism in the rat. Bone. 2005;37:211. doi: 10.1016/j.bone.2005.04.005. [DOI] [PubMed] [Google Scholar]
- 5.Liu CC, Yeh JK, Aloia JF. Magnesium directly stimulates osteoblast proliferation. J Bone Miner Res. 1988;3:S104. [Google Scholar]
- 6.Sgambato A, Wolf FI, Faraglia B, Cittadini A. Magnesium depletion causes growth inhibition, reduced expression of cyclin D1, and increased expression of P27 in normal but not in transformed mammary epithelial cells. J Cell Physiol. 1999;180:245. doi: 10.1002/(SICI)1097-4652(199908)180:2<245::AID-JCP12>3.0.CO;2-R. [DOI] [PubMed] [Google Scholar]
- 7.Wolf F, Cittadini A. Magnesium in cell proliferation and differentiation. Front Biosci. 1999;4:607–617. doi: 10.2741/wolf. [DOI] [PubMed] [Google Scholar]
- 8.Fuierer TA, Lore M, Puckett SA, Nancollas GH. A mineralization adsorption and mobility study of hydroxyapatite surfaces in the presence of zinc and magnesium ions. Langmuir. 1994;10:4721. [Google Scholar]
- 9.Kannan S, Lemos IAF, Rocha JHG, Ferreira JMF. Synthesis and characterization of magnesium substituted biphasic mixtures of controlled hydroxyapatite/β-tricalcium phosphate ratios. Journal of Solid State Chemistry. 2005;178:3190. [Google Scholar]
- 10.Cohen L. Recent data on magensium and osteoporosis. Magnesium Res. 1988;1:85. [PubMed] [Google Scholar]
- 11.Boskey AL, Rimnac CM, Bansai M, Federman M, Lian J, Boyan BD. Effect of short-term hypomagnesemia on the chemical and mechanical properties of rat bone. J Orthop Res. 1992;10:774. doi: 10.1002/jor.1100100605. [DOI] [PubMed] [Google Scholar]
- 12.McCoy H, Kenny MA, Gillham B. Effects of magnesium deficiency on composition and conformation of femur in rats of different ages. Nutr Res Int. 1979;19:233. [Google Scholar]
- 13.Tucker K, Kiel DP, Hannan MT, Felson DT. Magnesium intake is associated with bone mineral density in elderly woman. J Bone Miner Res. 1995;10:S466. [Google Scholar]
- 14.Sojka JE, Weaver CM. Magnesium supplementation and osteoporosis. Nutr Rev. 53:71. doi: 10.1111/j.1753-4887.1995.tb01505.x. [DOI] [PubMed] [Google Scholar]
- 15.Stendig-Lindberg G, Tepper R, Leichter I. Trabecular bone density in a two-year controlled trial of personal magnesium in osteoporosis. Magnesium Res. 1993;6:155. [PubMed] [Google Scholar]
- 16.Al-Ghamdi SMG, Cameron EC, Sutton RAL. Magnesium deficiency: pathophysiology and clinical overview. Am J Kid Dis. 1994;24:737. doi: 10.1016/s0272-6386(12)80667-6. [DOI] [PubMed] [Google Scholar]
- 17.Strause L, Saltman P, Smith KT, Bracker M, Andon MB. Spinal bone loss in postmenopausal women supplemented with calcium and trace minerals. J Nutr. 1994;124:1060. doi: 10.1093/jn/124.7.1060. [DOI] [PubMed] [Google Scholar]
- 18.Karbach U, Feldmeier H. New clinical and experimental aspects of intestinal magnesium transport. Magnesium Res. 1991;4:9. [PubMed] [Google Scholar]
- 19.Ohta A, Ohtsuki M, Baba S. Calcium and magnesium absorption from the colon and rectum are increased in rats fed fructooligosaccharides. J Nutr. 1995;125:2417. doi: 10.1093/jn/125.9.2417. [DOI] [PubMed] [Google Scholar]
- 20.Famery R, Richard N, Boch P. Preparation of β- and α-tricalcium phosphate ceramics with and without magnesium addition. Ceramics International. 1994;20:327. [Google Scholar]
- 21.Clement D, Tristan JM, Hamad M, Roux P, Heughebaert Etude de la substitution Mg2+/Ca2+ dans l’orthophosphate tricalcique β. J Solid State Chem. 1989;78:271. [Google Scholar]
- 22.LeGeros RZ, Gatti AM, Kijkowska R, Mijares DQ, LeGeros JP. Mg-substituted tricalcium phosphates: formation and properties. Key Engineering Mater. 2004:254–256. 127. [Google Scholar]
- 23.LeGeros RZ. Calcium Phosphates in Oral Biology and Medicine. Karger: Basel; 1991. [PubMed] [Google Scholar]
- 24.LeGeros RZ, Daculsi G, Kijkowska R, Kerebel B. The Effect of Magensium on the Formation of Apatites and Whitlockites. John Libbey & Co; London: 1989. [Google Scholar]
- 25.Ryu H-S, Hong K-S, Lee J-K, Kim D-J. Variations of structure and composition in magnesium incorporated hydroxyapatite/btricalciump phosphate. J Mater Res. 2006;21:428. [Google Scholar]
- 26.Otsuka M, Oshinbe A, LeGeros RZ, Tokudome Y, Ito A, Otsuka K, Higuchi WI. Efficacy of the injectable calcium phosphate ceramics suspensions containing magnesium, zinc and fluoride on the bone mineral deficiency in ovariectomized rat. J Pharma Sci. 2008;97:421. doi: 10.1002/jps.21131. [DOI] [PubMed] [Google Scholar]
- 27.Jallot E. Role of magnesium during spontaneous formation of a calcium phosphate layer at the periphery of a bioactive glass coating doped with MgO. Applied Surface Science. 2003;211:89. [Google Scholar]
- 28.Sun HL, Wu CT, Dai KR, Chang J, Tang TT. Proliferation and osteoblastic differentiation of human bone marrow-derived stromal cells on akermanite-bioactive ceramics. Biomaterials. 2006;27:5651. doi: 10.1016/j.biomaterials.2006.07.027. [DOI] [PubMed] [Google Scholar]
- 29.Wu C, Chang J, Wang J, Ni S, Zhai W. Preparation and characteristics of a calcium magnesium silicate (bredigite) bioactive ceramic. Biomaterials. 2005;26:2925. doi: 10.1016/j.biomaterials.2004.09.019. [DOI] [PubMed] [Google Scholar]
- 30.Gatti AM, LeGeros RZ, Monari E, Tanza D. Preliminary in vivo evaluation of synthetic calcium phosphate materials. In: LeGeros RZ, LeGeros JP, editors. Bioceramics. Vol. 11. Singapore: World Scientific; 1998. p. 399. [Google Scholar]
- 31.Verbeek RMH, Bruyne PAMD, Driessens FCM, Terpstra RA, Verbeek F. Solubility behaviour of Mg-containing β-Ca3(PO4)2. Bull Soc Chim Belg. 1986;95:455. [Google Scholar]
- 32.Ito A, Ojima K, Naito H, Ichinose N, Tateishi T. Preparation, solubility, and cytocompatibility of zinc-releasing calcium phosphate ceramics. J Biomed Mater Res. 2000;50:178. doi: 10.1002/(sici)1097-4636(200005)50:2<178::aid-jbm12>3.0.co;2-5. [DOI] [PubMed] [Google Scholar]
- 33.Mcdowell H, Gregory TM, Brown WE. Solubility of Ca5(PO4)3OH in the system Ca(OH)2-H3PO4-H2O at 5, 15, 25 and 37 oC. J Res Natl Bur Stand A. 1977;81:273. [Google Scholar]
- 34.Ito A, Maekawa K, Tsutsumi S, Ikazaki F, Tateishi T. Solubility product of OH-carbonated hydroxyapatite. J Biomed Mater Res. 1997;36:522. doi: 10.1002/(sici)1097-4636(19970915)36:4<522::aid-jbm10>3.0.co;2-c. [DOI] [PubMed] [Google Scholar]
- 35.Heughebaert JC, Nancollas GH. Solubility of octacalcium phosphate at 25 and 45 oC in the system Ca(OH)2-H3PO4-KNO3-H2O. J chem Eng Data. 1985;30:279. [Google Scholar]
- 36.Moreno EC, Brown WE, Osborn G. Stability of dicalcium phosphate in aqueous solutions and solubility of octacalcium phosphate. Soil Sci Soc Proc. 1960;24:99. [Google Scholar]
- 37.Tung MS, Eidelman N, Sieck B, Brown WE. Octacalcium phosphate solubility product from 4 to 37 oC. J Res Natl Bur Stand. 1988;93:613. [Google Scholar]
- 38.Moreno EC, Brown WE, Osborn G. Solubility of dicalcium phosphate dihydrate in aqueous systems. Soil Sci Soc Proc. 1960;24:94. [Google Scholar]
- 39.Gregory TM, Moreno EC, Patel JM, Brown WE. Solubility of β-Ca3(PO4)2 in the system Ca(OH)2-H3PO4-H2O at 5, 15, 25 and 37 °C. J Res Natl Bur Stand. 1974;78A:667. doi: 10.6028/jres.078A.042. [DOI] [PMC free article] [PubMed] [Google Scholar]
- 40.Rey C, Shimizu M, Collins B, Glimcher MJ. Resolution-enhanced Fourier transform infrared spectroscopy study of the environment of phosphate ion in the early deposits of a solid phase of calcium phosphate in bone and enamel and their evolution with age: 1. Investigations in the v4 PO4 domain. Calcif Tissue Int. 1990;46:384. doi: 10.1007/BF02554969. [DOI] [PubMed] [Google Scholar]
- 41.Rey C, Shimizu M, Collins B, Glimcher MJ. Resolution-enhanced Fourier transform infrared spectroscopy study of the environment of phosphate ion in the early deposits of a solid phase of calcium phosphate in bone and enamel and their evolution with age: 2. Investigations in the v3 PO4 domain. Calcif Tissue Int. 1991;49:383. doi: 10.1007/BF02555847. [DOI] [PubMed] [Google Scholar]
- 42.Schroeder LW, Dickens B, Brown WE. Crystalllographic studies of the role of Mg as a stabilizing impurity in β-Ca3(PO4)2. II. Refinement of Mg-containing β-Ca3(PO4)2. J Solid State Chem. 1977;22:253. [Google Scholar]
- 43.Enderle R, Götz-Neunhoeffer F, Göbbels M, Müller FA, Greil P. Influence of magnesium doping on the phase transformation temperature of β-TCP ceramics examined by Rietveld refinement. Biomaterials. 2005;26:3379. doi: 10.1016/j.biomaterials.2004.09.017. [DOI] [PubMed] [Google Scholar]
- 44.Elliott JC. Structure and Chemistry of the Apatites and Other Calcium Orthophosphates. Elsevier; Amsterdam: 1994. [Google Scholar]
- 45.Ito A, Kawamura H, Miyakawa S, Layrolle P, Kanzaki N, Treboux G, Onuma K, Tsutsumi S. Resorbability and solubility of zinc-containing tricalcium phosphate. J Biomed Mater Res. 2002;60:224. doi: 10.1002/jbm.10068. [DOI] [PubMed] [Google Scholar]
- 46.Rowles SL. The precipitation of whitlockite from aqueous solutions. Bull Soc Chim Fr. 1968:1797. [Google Scholar]
- 47.Gopal R, Calvo C, Ito J, Sabine WK. Crystal structure of synthetic Mg-, Ca18Mg2H2(PO4)14. Can J Chem. 1974;52:1155. [Google Scholar]
- 48.Hamad M, Heughebaert JC. The growth of whitlockite. J Crystal Growth. 1986;79:192. [Google Scholar]


