Abstract
Introduction
Fasciculoventricular pathway has been described as an unusual variant of preexcitation. Electrocardiographic imaging (ECGI) is a novel imaging modality for noninvasive electroanatomic mapping of epicardial activation and repolarization.
Case
We present a case of an 18-year-old male with hypertrophic cardiomyopathy (HCM) and an electrocardiogram (ECG)-based diagnosis of Wolff-Parkinson-White (WPW) syndrome, who underwent a noninvasive ECGI study to image ventricular activation, followed by an electrophysiology study (EPS). The ECGI electroanatomic isochrone map showed early activation of the epicardial aspect of the atrioventricular (A-V) groove and an aberrant posterior-base-to-apex progression of activation in the left ventricular (LV) epicardium. The EPS showed a likely fasciculoventricular pathway (FVP) without any inducible tachycardia.
Conclusion
While FVP has been described before, this is the first report of detailed quantitative three-dimensional characterization of electrical activation sequence of a heart with this type of preexcitation, using a novel noninvasive imaging modality (ECGI). In spite of abnormal ventricular activation, the EPS demonstrated that the FVP is not capable of supporting reentrant supraventricular tachycardia or rapidly conducted atrial fibrillation.
Keywords: electrocardiographic imaging (ECGI), preexcitation, fasciculoventricular pathway
Introduction
Electrocardiographic imaging (ECGI) is a noninvasive modality used for imaging cardiac electrical activity.1,2 It reconstructs epicardial potentials, electrograms, activation, and repolarization patterns on the three-dimensional epicardial surface of the heart from 256 body surface electrocardiograms and a thoracic CT scan. ECGI has been validated in humans with intraoperative mapping data during open-heart surgery.3 It has been applied to image normal human cardiac electrophysiology.1,2 Here we describe the findings of noninvasive ECGI and an electrophysiology study (EPS) in a patient with hypertrophic cardiomyopathy (HCM), a short PR interval and preexcitation due to a fasciculoventricular pathway.
Case Report
An 18-year-old male with hypertrophic cardiomyopathy (HCM) and no previous history of arrhythmias presented to clinic. A transthoracic echocardiogram demonstrated normal segmental anatomy with an inter-ventricular septal thickness of 2.17 cm (z-score 7.53), left ventricular (LV) posterior wall thickness of 1.43 cm (z-score 3.58) with no evidence of left ventricular outflow tract obstruction. There was increased LV mass of 406 grams (z-score 11.8). His routine surface ECG demonstrated a manifest delta-wave and short PR interval consistent with Wolff-Parkinson-White (WPW) syndrome (Fig. 1). The delta wave map, using the Arruda algorithm,4 predicted a right anteroseptal pathway location. Due to the reported increased mortality risk with both HCM and WPW,5–6 he was referred for an EPS and possible ablation. Before the EPS, he underwent a noninvasive ECGI study to image the ventricular activation sequence.
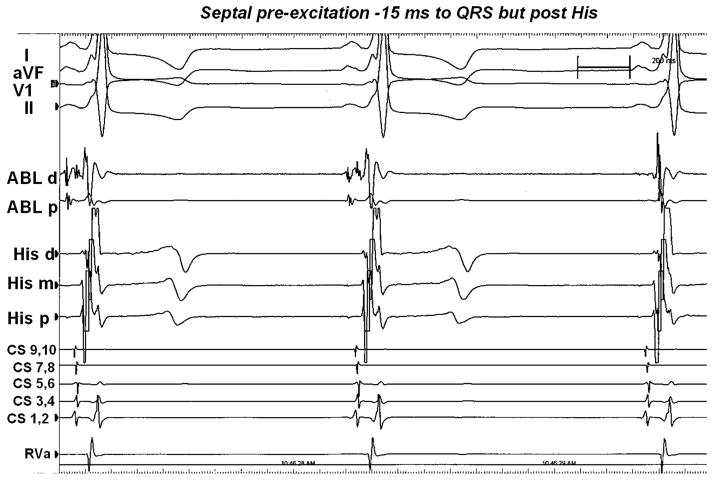
Figure 1.
Surface ECG from standard leads I, aVF,V1, II, and intracardiac electrograms recorded during EPS with the ablation catheter in the right atrium. Septal preexcitation occurred about 15 ms prior to onset of surface QRS complex but after the His signal.
Methods and Results
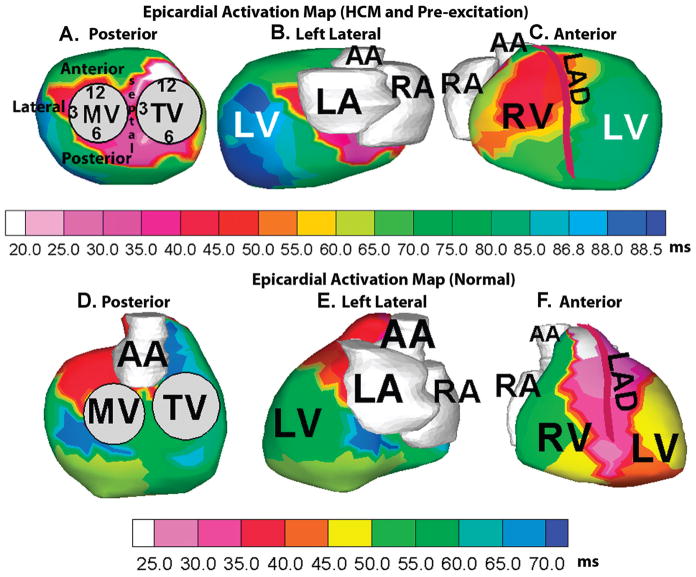
Body surface potentials were acquired simultaneously from 256 electrodes on the front and back of the torso and the patient underwent an ECG-gated CT scan (gated to 70% of R-R interval). ECGI combined the heart-torso anatomic information from CT with the body surface electrocardiographic recordings to generate electroanatomic epicardial activation map during a single preexcited beat (Fig. 2A–C). ECGI activation map (Fig. 2A) showed earliest activation (white) in the right anteroseptal region of the epicardial aspect of the atrioventricular (A–V) groove. Other areas of early activation (pink) were also seen in the basal midseptal and right posteroseptal aspects of the epicardium. The entire LV basal area was early (red) and activation in the LV propagated from base to apex (Fig. 2B). Anteriorly, the ECGI activation map (Fig. 2C) showed an elongated area of early activation (red) on the apical right ventricular (RV) epicardium adjacent to the left anterior descending (LAD) coronary artery, corresponding to the region of RV breakthrough due to conduction via the right bundle branch. In normal ventricular conduction, this is usually the earliest area of epicardial activation;2 in this case, activation in this region occurred 26 ms later than the right anteroseptal area of the A-V groove (Table 1). For comparison with normal epicardial activation, ECGI electroanatomic isochrone map of a healthy 21-year-old male subject in normal sinus rhythm is shown in the corresponding views in panels D-F. Normal epicardial activation initiates in the RV apex and anterior paraseptal aspects of the epicardium in regions adjacent to the LAD (white, light pink, panel F). Activation proceeds from apex to the basal posterior area in both RV and LV, with the posterolateral LV base and the region near right ventricular outflow tract (RVOT) (deep blue, panel D) being the latest to activate in this case.
Figure 2.
Noninvasive ECGI electroanatomic activation map of the study patient with hypertrophic cardiomyopathy (HCM) and preexcitation, showing posterior (A), left-lateral (B), and anterior views (C) of the epicardial activation sequence. Earliest activation (white, panel A) is in the right anteroseptal area of the epicardial aspect of A–V groove. The schematic of a clock used to indicate positions around the annuli is shown in panel A. Corresponding views of ECGI electroanatomic activation map of a healthy 21-year-old subject in normal sinus rhythm are shown in panels D–F for comparison. Normal epicardial activation initiates in the RV apex and anterior paraseptal aspects (white, light pink, regions adjacent to the left anterior descending coronary artery [LAD], panel F) of the epicardium and proceeds in an apex-to-base fashion, the posterolateral LV base and the RVOT area (deep blue, panel D) being the latest area to activate in this case. RV = right ventricle, LV = left ventricle, RA = right atrium, LA = left atrium, TV = tricuspid valve, MV = mitral valve, AA = ascending aorta.
TABLE 1.
Activation Times (with Reference to Surface Delta Wave) Determined by Noninvasive ECGI and Invasive Endocardial Catheter Mapping
| Location | ECGI Activation Time (ms) | Endocardial Activation Time (ms) |
|---|---|---|
| TVA | ||
| 12:00 | +18 | −17 |
| 2:00 | +19 | −16 |
| 4:00 | +22 | −14 |
| 9:00 | +60 | +20 |
| 11:00 | +61.5 | +22 |
| MVA | ||
| 2:00 | +43 | +7 |
| 3:00 | +42 | +6 |
| 4:00 | +84 | +44 |
| 7:00 | +48 | +12 |
| 9:00 | +21 | −15 |
| 10:00 | +36 | 0 |
| RV apex | +43.5 | +7 |
| LV apex | +89 | +47 |
The next day, he underwent an EPS with baseline preexcited sinus rhythm of 69 beats/min, with a PR interval of 102 ms, QRS duration of 119 ms, and QT interval of 422 ms.After placement of intracardiac catheters, the A1H1 interval measured 62 ms and the H1V1 interval was short, but not negative, at 12 ms.
To evaluate anterograde A-V conduction, atrial extrastimulus testing was performed from within the coronary sinus (CS). With the initiation of CS pacing, there was no change in QRS duration or configuration. The A2H2 interval was decremental measuring from 58–111 ms, followed by atrial effective refractory period (ERP) at S1S2 600/300. A-V nodal ERP was not encountered. The shortest preexcited R-R interval with incremental atrial pacing interval was 320 ms, after which Wenkebach occurred. No change in H2V2 interval or QRS morphology was seen throughout the atrial extrastimulus run. In order to exclude concealed preexcitation, atrial pacing was performed sequentially around the tricuspid valve annulus (TVA) and the posterior portion of the mitral valve annulus (MVA). Despite atrial pacing from multiple distant sites, there was no change in preexcitation pattern or change in H1V1 interval. Ventricular pacing showed no ventricleto atrium (VA) conduction. To further evaluate A-V nodal conduction properties, an intravenous (IV) bolus of adenosine was administered that produced PR lengthening without change in QRS duration or augmentation of preexcitation.
Detailed activation mapping was performed along the basal aspects of both MVA and TVA, as well as the right and left ventricular apices (Table 1). During mapping of the TVA, a fragmented and multiphasic His bundle recording (Fig. 1) was seen at the 2:30 position on the TVA. The recording showed an A1H1 interval of 45 ms and a short H1V1 interval of 14 ms, with a local activation time of −18 ms to the onset of delta-wave. No local annular ventricular activation times were found to be earlier than the His bundle local ventricular recording. No arrhythmias were induced during EPS.
Conclusion
The lack of augmentation of preexcitation with multisite atrial stimulation and IV adenosine bolus precluded the existence of a typical A-V WPW pathway. Yet, the ECGI electroanatomic activation map indicated early activation of the epicardial aspect of the A-V groove area and an aberrant posterior-base-to-apex progression of activation in the LV. The phenomenon of septal preexcitation without inducible tachycardia has been attributed to enhanced conduction down a “short” bundle branch or alternatively, to a fasciculo-ventricular pathway (FVP).7 While FVP has been described before, this is the first report of detailed quantitative three-dimensional characterization of the electrical activation sequence of a heart with this unusual variant of preexcitation, using a novel noninvasive imaging modality (ECGI) in conjunction with invasive catheter mapping. Activation times obtained from the ECGI map (epicardial aspects of the annuli) and those obtained from endocardial catheter mapping during EPS depict an identical sequence of early ventricular activation around the annuli.
In spite of the abnormal activation sequence imaged by ECGI, the EPS confirmed that the preexcitation in this case was FVP that could not support reentrant supraventricular tachycardia or rapidly conducted atrial fibrillation. The finding of asymptomatic preexcitation on routine ECG in hypertrophic cardiomyopathy, especially with a septal pathway insertion, should raise suspicion of the presence of FVP.
Acknowledgments
The study was supported by Merit Award R37-HL-33343 and Grant R01-HL-49054 from the National Heart, Lung, and Blood Institute to Yoram Rudy. Dr. Rudy is the Fred Saigh Distinguished Professor at Washington University in St. Louis, MO.
Footnotes
Dr. Woodard received equipment from Siemens Medical Systems.
Dr. Rudy chairs the scientific advisory board and holds equity in CardioInsight Technologies (CIT). CIT does not support any research conducted by Dr. Rudy including that presented here.
References
- 1.Ramanathan C, Ghanem RN, Jia P, Ryu K, Rudy Y. Noninvasive electrocardiographic imaging for cardiac electrophysiology and arrhythmia. Nat Med. 2004;10:422–428. doi: 10.1038/nm1011. [DOI] [PMC free article] [PubMed] [Google Scholar]
- 2.Ramanathan C, Jia P, Ghanem RN, Ryu K, Rudy Y. Activation and repolarization of the normal human heart under complete physiological conditions. Proc Nat Acad Sci USA. 2006;103:6309–6314. doi: 10.1073/pnas.0601533103. [DOI] [PMC free article] [PubMed] [Google Scholar]
- 3.Ghanem RN, Jia P, Ramanathan C, Ryu K, Markowitz A, Rudy Y. Non-invasive electrocardiographic imaging (ECGI): Comparison to intraoperative mapping in patients. Heart Rhythm. 2005;2:339–354. doi: 10.1016/j.hrthm.2004.12.022. [DOI] [PMC free article] [PubMed] [Google Scholar]
- 4.Arruda MS, McClelland JH, Wang X, Beckman KJ, Widman LE, Gonzalez MD, Nakagawa Hm, Lazzara R, Jackman WM. Development and validation of an ECG algorithm for identifying accessory pathway ablation site in Wolff-Parkinson-White syndrome. J Cardiovasc Electrophysiol. 1998;9:2–12. doi: 10.1111/j.1540-8167.1998.tb00861.x. [DOI] [PubMed] [Google Scholar]
- 5.McKenna WJ, Behr ER. Hypertrophic cardiomyopathy: Management, risk stratification, and prevention of sudden death. Heart. 2002;87:169–176. doi: 10.1136/heart.87.2.169. [DOI] [PMC free article] [PubMed] [Google Scholar]
- 6.Clark R, Fox MD, Walker BL, Hyslop DM, Maron BJ. Sudden death in young athletes. N Engl J Med. 1993;329:1737–1738. [PubMed] [Google Scholar]
- 7.Sternick EB, Gerken LM, Vrandecic MOs, Wellens HJJ. Fasciculoventricular pathways: Clinical and electrophysiological characteristics of a variant of pre-excitation. J Cardiovasc Electrophysiol. 2003;14:1057–1063. doi: 10.1046/j.1540-8167.2003.03206.x. [DOI] [PubMed] [Google Scholar]


