

Abstract
Polydimethylsiloxane (PDMS) is a widely used material for manufacturing lab-on-chip devices. However, the hydrophobic nature of PDMS is a disadvantage in micro-fluidic systems. To transform the hydrophobic PDMS surface to hydrophilic it has been treated with radio frequency (RF) air plasma at 150, 300 and 500 mtorr pressure for up to 30 minutes. Following the surface treatment, the PDMS specimens were stored in air, deionized water or 0.14 M NaCl solution at 4 °C, 20 °C, and 70 °C. The change in the hydrophilicity (wettability) of the PDMS surfaces has been followed by contact angle measurements and Fourier Transform Infrared Attenuated Total Reflectance (FTIR-ATR) Spectroscopy as a function of time.
As an effect of the RF plasma treatment the contact angles measured on PDMS surfaces dropped from 113±4 degrees to 9±3 degrees. The chamber pressure and the treatment time had no or negligible effect on the results. However, the PDMS surface gradually lost its hydrophilic properties in time. The rate of this process is influenced by the difference in the dielectric constants of the PDMS and its ambient environment. It has been the smallest at low temperatures in deionized water and largest at high temperatures in air. Apparently, the OH groups generated on the PDMS surface during the plasma treatment tend towards a more hydrophilic/less hydrophobic environment during the relaxation processes. The correlation between FTIR–ATR spectral information and contact angle data supports this interpretation.
Introduction
The use of PDMS in soft lithography expanded the field of microfabrication to regular chemical laboratories with all of its unique advantages1, 2 including the miniaturization of flow analytical methods into lab-on-chip devices. However, the hydrophobic nature of PDMS is a disadvantage in micro-fluidic systems especially when they are used for the analysis of biological samples. To modify the hydrodynamic properties of the flowing liquid in PDMS-based microchannels the hydrophobicity and the surface charge of the microchannels should be altered.1 The methods used to modify the surfaces of microchannels in polymer-based microchips include the dynamic coating of the inner wall,3–5 attachment of active groups6–9 to the wall surfaces, and the in situ generation of hydrophilic groups on channel surfaces through the oxidation of the surfaces using oxygen plasma (Scheme 1),10, 11 ultraviolet light,12, 13 or corona discharge.14
Scheme 1.

Possible mechanism of oxygen plasma oxidation of PDMS (redrawn from reference15)
The treatment of the PDMS surface with oxygen plasma introduces polar functional groups, primarily silanol (SiOH) groups, on the PDMS surface, which has been documented by a decrease of the contact angles from 120 to 20 degree.11 However, the hydrophilicity of the treated surface is reported to be unstable. The plasma treated surfaces gradually regain their hydrophobic properties upon exposure to air.11 This recovery process has been documented by contact angle measurements and by probing the utmost layers of the PDMS surface during the aging process using static secondary ion mass spectrometry (analyzed layer thickness ~ 1 nm), X-ray photoelectron spectroscopy (analyzed layer thickness 3–5 nm), and FTIR-ATR (analyzed layer thickness few tenth of a micrometer).16 As possible mechanisms for the relatively slow recurrence of the hydrophobic PDMS properties Morra et. al.16 considered the surface condensation of the induced silanol groups, the reorientation or diffusion of polar groups into the PDMS bulk and the migration of untreated, low molecular weight polymeric chains to the PDMS surface.17, 18 The contribution of the latter mechanism decreased in PDMS specimens, which were aged for up to 14 days at 100 °C19 before the plasma treatment, because the low molecular weight species are volatilized and removed from the PDMS bulk during thermal aging.
In this work, we studied the effect of experimental parameters, applied during air plasma treatment (chamber pressure and time) on the wettability of PDMS surfaces following the treatment. PDMS specimens of different composition were exposed to radio frequency (RF) air plasma at 150, 300 or 500 mtorr pressures for up to 30 minutes. The treated, PDMS specimens were stored in air, deionized water or NaCl solution at different temperatures. The changes of the hydrophilicity of the treated surfaces as function of the experimental conditions, material composition and time, following the treatment, were monitored by contact angle measurements and FTIR-ATR spectroscopy.
Experimental
Materials and Equipment
Sylgard 184® silicone elastomer, which is composed of an elastomer base (Cat. # 3097366-0503) and a curing agent (Cat. #3097358-0503) has been purchased from Dow Corning, MI. A Harrick Scientific, NY, PDC-32G plasma cleaner in combination with an Emerson (St. Louis, MO) PDC-VP-1 model vacuum pump has been used for surface treatment of the PDMS specimens. Static water contact angles were measured with VCA Optima Surface Analysis System (Advanced Surface Technology, Billerica, MA). All solutions were prepared with18.2 Mohm resistivity de-ionized water provided by a Milli Q Gradient A-10 water purification system (Millipore Corp., Bedford, MA). For the surface analysis of the PDMS specimens, a Tensor 27 Fourier Transform Infrared Spectrometer (Bruker, Billerica, MA) integrated with a MIRacle single reflection ATR (Pike, Madison, WI) has been used.
Sample Preparation
The PDMS specimens were generally prepared from a 10:1 mixture (by weight) of the silicone elastomer base and curing agent (both highly viscous liquids). However, to study the effect of the composition on its properties PDMS specimens with 5:1, 7.5:1, 12.5:1, and 15:1 weight ratios were also made. The primary compound in the elastomer base is dimethylvinyl-terminated dimethyl siloxane, c.a. 60 wt%. The primary compound in the curing agent is dimethyl methylhydrogen siloxane, c.a. 40–70 wt%. The secondary compound in the curing agent is dimethylvinyl-terminated dimethyl siloxane, ca. 15–40 wt%. The curing agent contains also trace amounts of platinum to catalyze the polymerization (Sylgard(r) 184 silicone elastomer kit material safety data sheet (MSDS) No.: 01064291).20 The viscous mix of pre-polymer has been poured onto 4.5 cm long and 1.2 cm wide polystyrene plates (the wall of a single-use spectrophotometric couvette) and left to settle for 10 minutes. During this time period the trapped air bubbles emerge to the surface, which were popped up individually by blowing pressurized air onto the selected areas of the surface through a glass pipette. After the removal of all the air bubbles, the mixture has been put into an oven (70°C) for curing for at least three hours. The thickness of the fully cured PDMS specimens was ~ 1.3 mm while their surface roughness, measured by a Veeco MultiMode V atomic force microscope, was less than 3 nm.
Surface Modification
The fully cured specimens were sonicated in a dilute (2 %) Haemo-Sol, no-scrub detergent solution (Haeno-Sol, Inc. Baltimore, MD.), and de-ionized water three times, for a total of 15 minutes using a Cole-Parmer model 8890 ultrasonic cleaner. The cleaned specimens were dried with compressed air. The clean PDMS slabs were than put inside the plasma cleaner and the pressure inside of the chamber was reduced below 500 mtorr. Most commonly, the plasma treatment has been performed at 100, 300 or 500 mtorr chamber pressures, and 18 W RF power level for 2 minutes. However, the effect of extended plasma treatment (up to 30 minutes) has also been studied.
Following the plasma treatment the PDMS specimens were immediately transferred into amber sample bottles filled with air, D.I. water, or 0.14 M NaCl solution. These sample bottles were stored at 4 °C (in a refrigerator), 20 °C (room temperature), or 70 °C (in a thermostated oven).
Contact Angle Measurement
The PDMS slabs were removed from sample bottles, rinsed with 1 mL de-ionized water, dried by flushing compressed air over their surfaces for half of minute, and placed onto the sample stage of the VCA Optima Surface Analysis System. Next, ten droplets of de-ionized water, ranging between 0.2 and 0.8 μL, were dispensed from a microsyringe onto selected areas of the studied surfaces and the images of the droplets were captured. The contact angles were evaluated from the captured images using the goniometry software of VCA OptimaXE and are provided as average values with their standard deviation.
The standard deviation of the contact angles measured at different areas of a specimen surface or evaluated at a single spot of the studied surface were practically the same. The latter was determined by dispensing increasing volumes (ranging from 0.33 to 1.65 μL) of de-ionized water to the same position of a pristine PDMS specimen.
FTIR-ATR Spectroscopy
Before the ATR-FTIR measurements the germanium reflection element of the MIRacle single reflection ATR module was cleaned with ethanol. The PDMS slabs were clamped on the germanium reflection element and 1000 infrared spectra were averaged in the 750 cm−1 – 4000 cm−1 spectral range, with 4 cm −1 resolution. The FTIR-ATR measurement has been repeated at three locations of the sample and the collected spectra were averaged.
Results and Discussion
Pristine PDMS is a highly hydrophobic cross-linked polymer. The static water contact angles measured on the surface of the PDMS specimens prepared in this work were 113±4 degrees. Thirteen weeks continuous exposure to de-ionized water decreased the contact angles measured on the studied PDMS surfaces only by 7.8 ± 2.2 degrees. This small change might be related to the water uptake of the polymer.21 However, a short air plasma treatment turns the PDMS surface highly hydrophilic. Contact angles measured after a two minutes air plasma treatment performed at 150, 300 or 500 mtorr pressures were 6.8±2.2, 8.8±3.0, and 7.4±2.9 degrees, respectively. The difference between these values is statistically insignificant (P>0.1). Unfortunately upon exposure to air the PDMS surface gradually loses its hydrophilic properties. As it is shown in Figure 1, the contact angle values increase gradually with time for all three specimens. Similar to their initial values, the rate of increase was similar and did not show correlation with the chamber pressure applied during the RF plasma treatment.
Figure 1.
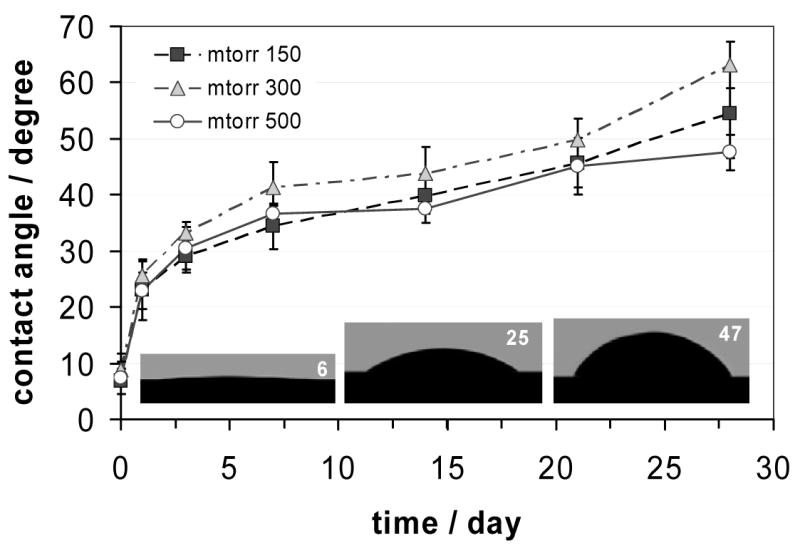
Changes in contact angles measured on RF plasma treated PDMS surfaces as a function of time following the treatment. The PDMS specimens were treated with RF plasma at 150, 300 and 500 mtorr air pressures and were exposed to ambient air at room temperature. The data are mean values of n = 10 parallel measurements and are plotted with their standard deviation (±SD). The insets from left to right are selected images of deionized water droplets over the PDMS surface, representing the hydrophilicity of the PDMS surface following plasma treatment, and after 1 or 21 days of exposure to air, respectively. The numbers in the upper right corners of these images are the measured contact angle values.
In contrast, the hydrophilic properties of the RF plasma treated PDMS surfaces could be retained for extended periods of time when they were stored in de-ionized water or an aqueous salt solution (0.14 NaCl). In Figure 2, the changes in the measured contact angles are compared when the specimens were stored in air, D.I. water or 0.14 M NaCl solution after the RF plasma treatment. The rate of increase in the measured contact angles has been found significantly smaller (p<0.01) when the specimens were stored in deionized water or aqueous NaCl solution compared to air.
Figure 2.
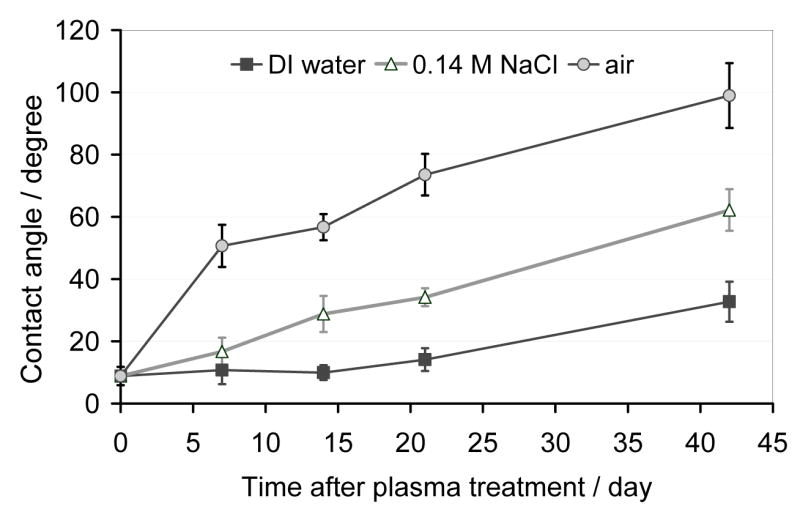
Changes in contact angles measured on RF plasma treated PDMS surfaces as function of time upon the exposure to different environments following the plasma treatment. The individual specimens were placed into sample containers filled with air, deionized water or 0.14 M NaCl solution immediately after the air plasma treatment and were stored in these containers at room temperature during the entire time period of the experiment. The data are mean values of n = 10 parallel measurements and are plotted with their standard deviation (±SD).
The rate at which the plasma treated PDMS surfaces lose their hydrophilic properties is also influenced by the ambient temperature. As can be seen in Figure 3, the changes are significantly slower when the specimens were stored at lower temperatures (p<0.05). PDMS specimens stored at 70 °C after the plasma treatment recovered their hydrophobic properties much faster compared to specimens stored at room temperature (~20 °C) or at 4 °C. The contact angle measurements were always performed at room temperature once the specimens reached thermal equilibrium with their environment. The specimens were taken out from the refrigerator or the oven minimum 30 minutes before the measurement.
Figure 3.
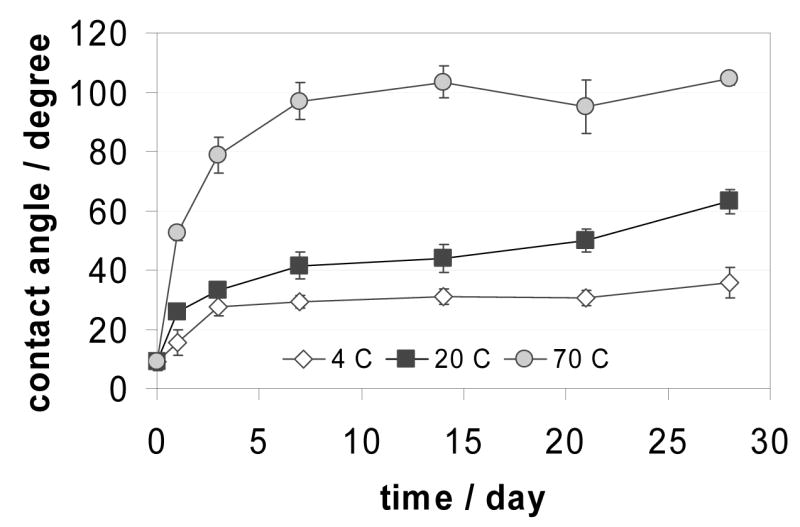
Changes in contact angles measured on RF plasma treated PDMS surfaces as a function of time when the individual specimens were stored in air at different temperatures. The data are mean values of n = 10 parallel measurements and are plotted with their standard deviation (±SD).
The differences between the relaxation rates at which the PDMS specimens regain their hydrophobic properties in different environments and at different temperature can be explained by the material properties of PDMS. PDMS is amorphous elastomer with a glass transition temperature (Tg) around −130 °C.21 Around room temperature, the polymer terminals, loops and segments have some level of freedom for movement. Following a physical or chemical perturbation, the elastomers move to a new equilibrium through a relaxation process. The change of the hydrophilicity of PDMS after the plasma treatment is considered such a relaxation process throughout which the hydrophilic groups generated on the PDMS surface tend to orient towards a more hydrophilic environment and the siloxane chains tend to migrate towards the PDMS bulk. The rate of this process is influenced by the difference in the dielectric constants of the PDMS (εPDMS: 2.3–2.820) and its ambient environment (εair: 1; εwater: 8022), i.e., the relaxation process is facilitated when the PDMS specimens are in air but it is slowed down when the PDMS specimens are stored in de-ionized water since the hydrophilic groups prefer the higher dielectric constant environment.
Somewhat surprisingly, the rates of the relaxation processes were found significantly faster in 0.14 M NaCl although the dielectric constant of pure water 23, 24 is only slightly larger compared to salt solutions. On the other hand, the rates of the relaxation processes showed the expected temperature dependence. They were faster at high and slower at low temperatures.
The applications of silicone elastomers are extremely diverse. The different applications require elastomer materials with different properties, e.g., mechanical strength, resistivity etc. The elastomer properties can be influenced by the elastomer base to curing agent ratio ratio.25, 26 To study the effect of the elastomer base to curing agent ratio on the hydrophilic/hydrophobic properties of the completely cured PDMS specimens the contact angles were measured on PDMS surfaces of different compositions before and after an RF plasma treatment. The elastomer base to curing agent ratio was changed from 5:1 to 15:1. In these studies the effect of the PDMS composition on the rate of relaxation, the time course as a hydrophilic PDMS surface becomes hydrophobic after plasma treatment has been determined. Our results are summarized in Figure 4. The difference in the hydrophilic/hydrophobic properties of these PDMS specimens was found negligible at all three testing times.
Figure 4.
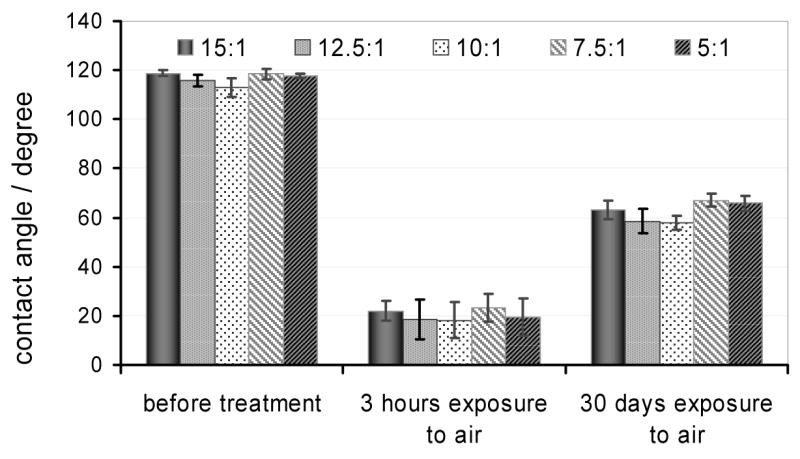
The effect of plasma treatment on the contact angles measured on the surface of PDMS specimens cast with different elastomer base to curing agent ratios. The RF treatment was performed at a 300 mtorr chamber pressure while the contact angle data were measured before plasma treatment and 3 hours or 30 days after the treatment. Between the contact angle measurements the specimens were kept in air filled vials. The data are mean values of n = 10 parallel measurements and are plotted with their standard deviation (±SD).
If the ratio of curing agent to base is increased the polymer is expected to become more crosslinked.27 Increased crosslink density makes polymers harder. The complex composition of the elastomer base and curing agent in Sylgard 184® 20 does not allow an exact calculation on the level of crosslinking in the PDMS specimens cast with different base to curing agent ratios, ranging between 15:1 to 5:1. However, since elastomers are characterized by very low crosslink densities, about one crosslink per 100 monomer units (~1 %),28 the level of crosslinking is not expected to exceed 1.8 % even in the PDMS specimen which has been prepared with 5:1 elastomer base to curing agent ratio. Apparently, at this very low level of crosslinking the unconstrained motion of uncrosslinked polymeric segments still dominates the relaxation processes of the plasma treated PDMS.
The FTIR-ATR-spectra of the pristine and the plasma treated PDMS (Figure 5) show the characteristics peaks of polydimethylsiloxane with symmetric (νs(CH3)) and asymmetric (νa(CH3)) stretching and deformation (νδ(CH3)) vibrations of the methyl groups at 2963, 2906, and 1258 cm−1, respectively. The methyl rocking and SiC vibrations appear around 800 cm −1, while the Si-O-Si asymmetric stretching vibrations emerge between 930 and 1200 cm−1. The weak broadband absorption centered around 3300 cm−1 is a clear indication of the hydroxyl group formation on the RF plasma-treated surface. In agreement with other studies,13, 29, 30 the absorbance reflecting the OH group concentration on the surface increasing gradually with increasing time of treatment up to 30 minutes. The increase in the absorbance around 3300 cm−1 is coupled to decreasing absorption at wavenumbers characteristics for the methyl group related stretching (2963 cm−1) and deformation (1258 cm−1) vibrations. The absorbance values measured at the untreated, 2 and 30 minutes plasma treated PDMS surfaces at 2963 cm−1 and 1258 cm−1 wavenumbers (Fig. 5B and 5C insets) were 0.0152, 0.0145, 0.0128 and 0.0977, 0.0929, 0.0840 absorbance units, respectively. The decrease of the SiC vibration related absorbance peak (797 cm−1) also supports the hypothesis that the concentration of hydroxyl groups increased while the methyl groups decreased in the surface layers of the plasma treated PDMS. The absorbance values measured at 797 cm−1 wavenumber on the untreated, 2 and 30 minutes plasma treated PDMS surface (Fig. 5C inset) were 0.296, 0.291, and 0.275 absorbance units, respectively. However, the information provided by the FTIR-ATR spectra is not specific to the utmost surface layers but reflects an average concentration in a surface region. The depth of this region is the penetration depth of the infrared radiation into the PDMS which is a few tenths of a micrometer with the germanium reflection element.31
Figure 5.

Infrared spectrum of pristine PDMS surface (
 ), and PDMS surfaces after air plasma treatments at 300 mtorr for 2 (
 ) and 30
 ) minutes. Figure 5B shows a segment of the spectra between 2800 and 3800 cm −1 with the characteristic peaks reflecting the hydroxyl group (3300 cm−1) and the methyl group (2906 and 2963 cm −1) concentrations on the PDMS surface. Figure 5C shows a segment of the spectra between 750 and 1550 cm −1 with the characteristic peaks of the SiC (797 cm −1) and the methyl group (1258 cm −1) vibrations. The insets in Figs 5B and C are blown up sections of the spectra at characteristic peaks.
The FTIR-ATR spectrum of a PDMS surface treated for 30 minutes with RF air plasma indicate higher hydroxyl group concentration on the surface compared to a specimen which has been exposed to the plasma treatment only for 2 minutes. During the longer plasma treatment the oxidation processes induced by the high energy plasma extends to deeper regions of the PDMS surface. Remarkably, the contact angle measurements suggest opposite trend. The contact angles measured on the 2 and 30 minutes plasma treated surfaces were 6.8 and 13.7 degree, respectively. This apparent contradiction is partly due to the differences of the information content of the data collected by the two methods. The FTIR-ATR data reflect the concentration of the hydroxyl groups in an approximately 0.2 μm thick PDMS layer on the surface of the PDMS specimen. In contrast, the contact angle results inform about the hydrophilicity of the utmost surface layer of the same specimen. Although, the latter is believed to be correlated with the surface concentration of the OH groups, as we showed above after 2 minutes of plasma treatment, independent of the O2 pressure in the plasma chamber, the surface hydrophilicity could not be decreased below 9±3 degrees (see Fig. 1). Accordingly, the difference in the measured values is believed to be related to changes (damage) in the structure of the utmost layers after the extended plasma treatment.
The changes of the chemical composition of the surface layers of PDMS during the relaxation processes induced by the plasma treatment were followed by recording the FTIR-ATR spectra of PDMS specimens treated with air plasma at 300 mtorr for 2 min and kept in air at 20 or 70 °C for one week. A segment of the spectra of PDMS between 2800 and 3800 cm −1 is shown in Figure 6. By comparing the spectra the following conclusions can be drawn: (i) the absorbance representing methyl groups is the largest in the pristine PDMS; (ii) the spectrum of the pristine PDMS has no indication for the presence of hydroxyl groups; (iii) the absorbance at 3300 cm−1, reflecting the presence of OH groups, remained constant when the plasma treated PDMS specimens were stored at room temperature for up to one week; (iv) the absorbance at 3300 cm−1 decreased significantly when the plasma treated PDMS specimens were stored at 70 °C for one week.
Figure 6.

Changes in the FTIR –ATR spectrum of PDMS surface in time following 2 minutes plasma oxidation at 300 mtorr. After the plasma treatment the specimens were exposed to ambient air for 7 days at room temperature (20 °C) and at 70 °C temperature. The inset shows the 3500 cm−1-3100 cm−1 section of the spectra with expanded scale on the absorbance axis.
Although, the FTIR-ATR spectra provided primarily qualitative information, due to the small absorbance values and the limited reproducibility of the sample and background signals, in combination with the contact angle data they support our interpretation of the relaxation processes in different environments following the plasma treatment. Since the absorbance values measured by FTIR-ATR represent average concentrations in the range of the penetration depth of the IR radiation (about ~ 0.2 μm region in PDMS using the germanium reflection element) it is not surprising that during a relatively short period (one week) and moderate temperature (room temperature) the absorbance reflecting the OH group concentration in the sub-surface layers remained constant (see (iii) above). However, if the polymeric chains may rotate during the relaxation processes, the hydrophilic properties of the surface will change without measurable changes in the average OH concentration in the penetration depth region of the IR radiation. This has been documented by the increasing contact angle data measured during the time course of the relaxation processes (Figs.1–4).
At longer times and higher temperatures (70 °C), the relaxation processes are expected to extend towards the PDMS bulk. In addition, condensation reactions may take place between silanol groups which become in the vicinity of each other29 and low molecular weight oligomers may emerge on the surface from the bulk of the polymer. Consequently, besides of the surface concentrations, which were documented as large increases in the measured contact angles, the average OH concentration decreases also in the sub surface layers.
Conclusion
Radiofrequency air plasma oxidation of PDMS is a fast, convenient and reproducible way for changing its highly hydrophobic surface to hydrophilic. Changes in the surface hydrophilicity (wettability) were characterized by contact angle measurements. The RF plasma treatment induced decrease in the measured contact angles was only slightly influenced by the treatment time, and the composition of the PDMS. Unfortunately, the plasma treatment induced hydrophilicity was gradually lost with time which has been followed by measuring the rate of the asymptotic increase of the contact angles on the studied surfaces. The rate of the change was facilitated when the specimens were placed in a low dielectric constant environment (air) or slowed down when placed into high dielectric constant environment (water). This led to the interpretation that the relaxation processes are correlated to the conformational/rotational changes of the polymeric chains as the generated OH groups tend towards a more hydrophilic/less hydrophobic environment. The combination of the results of the contact angle measurements and the chemical information provided by FTIR-ATR on the same surfaces support our interpretation. The experimental data are not in conflict with other interpretations emphasizing the importance of the migration of low molecular weight oligomers from the bulk to the surface of the PDMS specimens.17–19 Indeed, the relative importance of the different recovery mechanisms is expected to be different in different time domains.
Acknowledgments
The authors express their acknowledgement to Professor J. L. Ong for his guidance in the FTIR-ATR and contact angle measurements in his laboratory. This work has been supported by the NIH/NHLBI grant # 1 RO1 HL079147-01.
Contributor Information
I-Jane Chen, Email: ijchen@memphis.edu.
Ernõ Lindner, Email: elindner@memphis.edu.
References
- 1.Hahn JH, Makamba H, Kim JH, Lim K, Park N. Electrophoresis. 2003;24:3607–3619. doi: 10.1002/elps.200305627. [DOI] [PubMed] [Google Scholar]
- 2.Whitesides G, Sia S. Electrophoresis. 2003;24:3563–3576. doi: 10.1002/elps.200305584. [DOI] [PubMed] [Google Scholar]
- 3.Henry CS. Anal Chem. 2000;72:5939–5944. doi: 10.1021/ac000932l. [DOI] [PubMed] [Google Scholar]
- 4.Chen HY, Dou YH, Xu JJ. Electrophoresis. 2002;23:3558–66. doi: 10.1002/1522-2683(200210)23:20<3558::AID-ELPS3558>3.0.CO;2-#. [DOI] [PubMed] [Google Scholar]
- 5.Harrison DJ, Ocvirk G, Munroe M, Oleschuk R, Westra K. Electrophoresis. 2000;21:107–115. doi: 10.1002/(SICI)1522-2683(20000101)21:1<107::AID-ELPS107>3.0.CO;2-Y. [DOI] [PubMed] [Google Scholar]
- 6.Israelachvili JN, Alcantar NA, Aydil ES. J Biomed Mat Res. 2000;51:343–351. doi: 10.1002/1097-4636(20000905)51:3<343::aid-jbm7>3.0.co;2-d. [DOI] [PubMed] [Google Scholar]
- 7.Wirth M. Langmuir. 2002;18:9971–9976. [Google Scholar]
- 8.Oleschuk R, Wang B, Abdulali-Kanji Z, Dodwell E, Horton JH. Electrophoresis. 2003;24:1442–1450. doi: 10.1002/elps.200390186. [DOI] [PubMed] [Google Scholar]
- 9.Ruckenstein E, Chen JH. J Colloid Interface Sci. 1991;147:544–553. [Google Scholar]
- 10.Chen JK. J Adhes Sci Technol. 1996;70:231–242. [Google Scholar]
- 11.Ginn BT, Steinbock O. Langmuir. 2003;19:8117–8118. [Google Scholar]
- 12.Belanger MC, Marois Y. J Biomed Mat Res. 2001;58:467–477. doi: 10.1002/jbm.1043. [DOI] [PubMed] [Google Scholar]
- 13.Genzer J. J Colloid Interface Sci. 2002;254:306–316. doi: 10.1006/jcis.2002.8594. [DOI] [PubMed] [Google Scholar]
- 14.Green MD, Guild FJ, Adams RD. Proceedings of the 23rd Annual Meeting of the Adhesion Society. Myrtle Beach, South Carolina: 2000. pp. 541–543. [Google Scholar]
- 15.Lu, H. http://ocw.mit.edu/NR/rdonlyres/Electrical-Engineering-and-Computer-Science/6-152JFall2003/18CF8707-EFFC-4FF3-BA92-514447EAAA5E/0/lecture15.pdf
- 16.Morra M, Occhiello E, Marola R, Garbassi F, Humphrey P, Johnson D. J Colloid Interface Sci. 1990;137:11–24. [Google Scholar]
- 17.Kim J, Chaudhury M, Owen M. J Colloid Interface Sci. 2000;226:231–236. [Google Scholar]
- 18.Kim J, Chaudhury M, Owen M, Orbeck T. J Colloid Interface Sci. 2001;244:200–207. [Google Scholar]
- 19.Eddington D, Pucchinelli J, Beebe D. Sens Actuators, B. 2006;114:170–172. [Google Scholar]
- 20.DowCorning http://www.dowcorning.com/applications/search/default.aspx?r=131en
- 21.Andrade J, Gregonis DE, Smith LM. Surface and Interfacial Aspects of Biomedical Polymers. Plenum Press; New York: 1985. pp. 15–41. [Google Scholar]
- 22.Freeman I. Physics: Principles and Insights. McGraw-Hill; New York: 1968. p. 442. [Google Scholar]
- 23.Chaplin, M. http://www.lsbu.ac.uk/water/microwave.html
- 24.Meissner T, Wentz F. IEEE Trans Geosci Remote Sensing. 2004;42:1836–1849. [Google Scholar]
- 25.Armani D. 12th International Conference on MEMS, MEMS 99; Orland, FL. 1998. pp. 222–227. [Google Scholar]
- 26.Michel B, Schmid H. Macromolecules. 2000;33:3042–3049. [Google Scholar]
- 27.Campbell D, Beckman K, Calderon C, Doolan P, Moore R, Ellis A, Lisensky G. J Chem Educ. 1999;76:537–541. [Google Scholar]
- 28.Stevens MP. An Introduction. 2. Chapter 3.8 Oxford University Press; New York: 1990. Polymer Chemistry. [Google Scholar]
- 29.Nuyken O, Graubner VM, Jordan R. Macromolecules. 2004;37:5936–5943. [Google Scholar]
- 30.Ren J, Chen L, Bi R, Chen D. Electrophoresis. 2004;25:914–921. doi: 10.1002/elps.200305766. [DOI] [PubMed] [Google Scholar]
- 31.PikeTechnology http://www.piketech.com/technical/application-pdfs/AN_0601_CrystalPlates_MIRacle.pdf