Abstract
Many laboratories are developing depth-encoding detectors to improve the trade-off between spatial resolution and sensitivity in positron emission tomography (PET) scanners. One challenge in implementing these detectors is the need to calibrate the depth of interaction (DOI) response for the large numbers of detector elements in a scanner. In this work, we evaluate two different methods, a linear detector calibration and a linear crystal calibration, for determining DOI calibration parameters. Both methods can use measurements from any source distribution and location, or even the intrinsic LSO background activity, and are therefore well-suited for use in a depth-encoding PET scanner. The methods were evaluated by measuring detector and crystal DOI responses for all eight detectors in a prototype depth-encoding PET scanner. The detectors utilize dual-ended read out of lutetium oxyorthosilicate (LSO) scintillator arrays with position-sensitive avalanche photodiodes (PSAPDs). The LSO arrays have 7×7 elements, with a crystal size of 0.92×0.92×20 mm3 and pitch of 1.0 mm. The arrays are read out by two 8×8 mm2 area PSAPDs placed at opposite ends of the arrays. DOI is measured by the ratio of the amplitude of the total energy signals measured by the two PSAPDs. Small variations were observed in the DOI responses of different crystals within an array as well as DOI responses for different arrays. A slightly nonlinear dependence of the DOI ratio on depth was observed and the nonlinearity was larger for the corner and edge crystals. The DOI calibration parameters were obtained from the DOI responses measured in singles mode. The average error between the calibrated DOI and the known DOI was 0.8 mm if a linear detector DOI calibration was used, and 0.5 mm if a linear crystal DOI calibration was used. A line source phantom and a hot rod phantom were scanned on the prototype PET scanner. DOI measurement significantly improved the image spatial resolution no matter which DOI calibration method was used. A linear crystal DOI calibration provided slightly better image spatial resolution compared with a linear detector DOI calibration.
Keywords: Position sensitive APD, depth of interaction, positron emission tomography, small animal imaging
1. Introduction
Thick (2 cm or greater) scintillation crystals are needed for high detection sensitivity in PET scanners, but are not used in small animal PET scanners due to depth of interaction (DOI) or parallax errors (Tai et al., 2003; Tai et al., 2005; Rouze et al., 2004; Yang et al., 2004). Much effort has been devoted to develop depth-encoding PET detectors over the past several years (Inadama et al., 2006; Moses and Derenzo, 1994; Saoudi et al., 1999; Tsuda et al., 2004; Dokhale et al., 2004; Du et al., 2007; Burr et al., 2004; Zhang et al., 2003) to minimize the DOI effect. Dedicated small animal (Wang et al., 2006), human brain (Wienhard et al., 2002; Eriksson et al., 2002) and human breast (Huber et al., 2003) PET scanners have now been developed that utilize some form of depth-encoding detectors. With improving DOI resolution, one challenge in implementing these DOI detectors in a PET scanner is the need to accurately calibrate the depth of interaction (DOI) response for large numbers of detector elements such that coincidence events are placed in the projection data as accurately as possible.
We have previously developed depth-encoding PET detectors by using dual-ended read out of finely pixelated LSO arrays with two position sensitive avalanche photodiodes (PSAPDs) (Yang et al., 2008; Yang et al., 2006). For these dual-ended read out detectors DOI is determined by the ratio of the total signal measured by each PSAPD. Our previous results have shown that with 20 mm thick LSO crystals, crystals with a size down to 1 mm can be resolved, and that a uniform DOI resolution of 2 mm can be achieved. A prototype PET scanner using those detectors was also developed and it was shown that DOI measurement can significantly improve the spatial resolution in the reconstructed images (Yang et al., 2008).
In this work, we study how best to calibrate the DOI information across the 8 detector modules and several hundred LSO crystals in the prototype scanner. DOI responses are measured for all the detector modules by irradiating them at known depths. Two different DOI calibration methods are introduced, one based on a detector-level calibration, the other based on a crystal-level calibration. The error between the calibrated depths and the known depths was evaluated to determine how well the two DOI calibration methods work. The dependence of the DOI calibration parameters on source position and the effect of DOI calibration methods on image spatial resolution were studied. Both calibration methods investigated can use measurements from any source distribution and location, or even the intrinsic LSO background activity, and are therefore well-suited for use in a depth-encoding PET scanner based on these dual-ended readout detector modules.
2. Methods
2.1 Prototype PET scanner
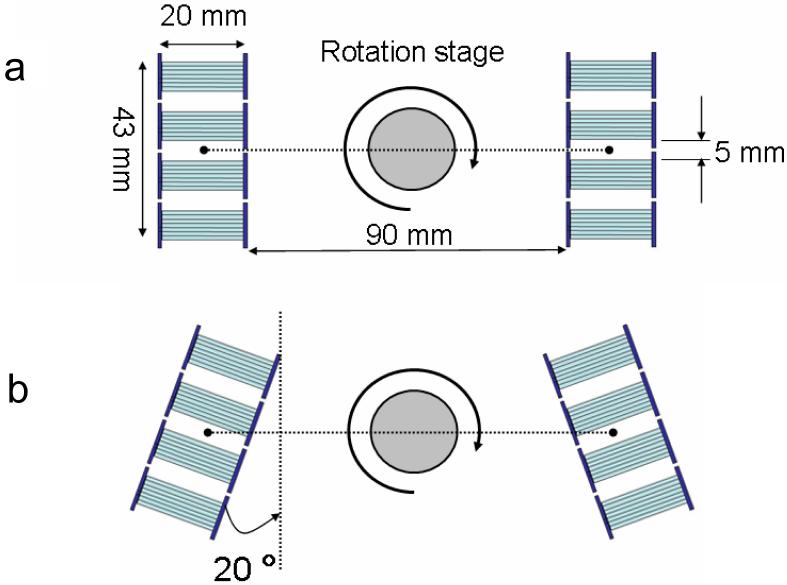
A schematic view of the prototype PET scanner is shown in Figure 1. The scanner consists of two rectangular detector plates, each made up from a linear array of 4 detector modules. The LSO arrays in each detector module have 7×7 elements, with a crystal size of 0.92×0.92×20 mm3 and pitch of 1.0 mm. The arrays are read out by two 8×8 mm2 area PSAPDs (Shah et al., 2004; Shah et al., 2002) placed at opposite ends of the array. Each PSAPD has four outputs, one at each corner. These four digitized signals from the two PSAPDs are combined and are used to determine the crystal of interaction using modified Anger logic (Yang et al., 2008). The sum of these four signals from each PSAPD is used to determine the DOI within the crystal by taking the ratio of the summed signal from the PSAPDs at opposite ends of the crystal array.
Figure 1.
A schematic view of the prototype PET scanner, (a) scanner configuration 1, (b) scanner configuration 2 in which detectors are rotated by 20° around their center.
Imaging studies were performed using two different configurations of the prototype PET scanner. In the first configuration the two detector plates are placed opposite and parallel to each other as shown in Figure 1a. In the second configuration (Figure 1b), one detector plate was rotated clockwise by 20 degrees and the other one was rotated counter-clockwise by 20 degrees to simulate oblique angles of incidence that would be seen in a complete ring scanner. The 20 degree rotation was around the geometric center of the 4 detector modules as indicated in Figure 1. The two detector plates remained stationary during data acquisition and tomographic projection data was obtained by rotating the object using a stepping motor located at the center of the scanner. Details of the electronics and data acquisition of the scanner can be found in our previous publications (Yang et al., 2008; Wu et al., 2008; Judenhofer et al., 2005).
2.2 DOI response variations across all crystals in an array
One detector module was measured in both singles and coincidence modes. In singles mode the detector was irradiated uniformly along all depths from one side by a 0.5 mm diameter point 22Na source (0.8 MBq). In coincidence mode, five depths of 2, 6, 10, 14 and 18 mm from one PSAPD were selectively irradiated with the point source by electronic collimation. Detail of the electronic collimation method has been previously published (Yang et al., 2006). The radiation beam width incident on the side of the array, estimated from the experimental geometry, is 2 mm. A crystal look-up table created from the measured flood histogram was used to define events occurring in each crystal.
2.3 DOI response variations of all eight detectors in the prototype PET scanner
All eight detectors from the prototype scanner were measured in both singles and coincidence modes. In coincidence mode, three depths of 2, 10 and 18 mm were selectively irradiated by electronic collimation. The measurements were performed with all detectors placed in the same position within the detector boxes as in the prototype scanner. The radiation beam width incident on the arrays is estimated from the experimental geometry to be ∼4 mm.
2.4 Effect of source position on DOI calibration parameters
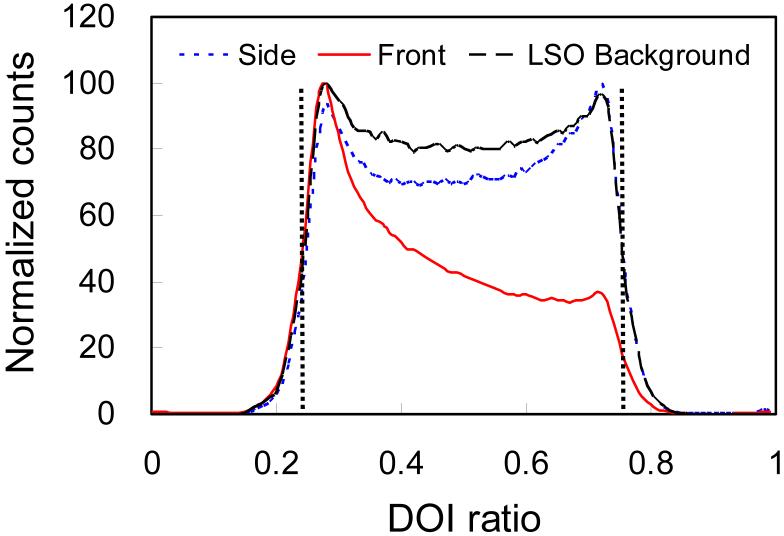
Four detectors from one detector plate were measured in singles mode with a point source positioned a) at the front of the detector; b) at the side of the detector and c) without a source (176Lu background from LSO). DOI responses of entire detector arrays and individual crystals measured with the point source at different positions and with the LSO background were compared.
2.5 Phantom studies
A line source phantom and a hot rod phantom were imaged on the prototype scanner with the two different scanner configurations shown in Figure 1. The line source phantom consisted of needles of 100 μm inner diameter, 200 μm outside diameter and 50 mm in length. For scanner configuration 1, needles at radial offsets of 0, 7.5 and 15 mm were imaged. For scanner configuration 2, in which DOI effects are maximized, needle offsets of 0 and 7.5 mm were used. The 7.5 mm offset roughly corresponds to the outer surface of a mouse. The hot rod phantom was the Ultra-Micro Hot Spot Phantom (Data Spectrum Corporation, Chapel Hill, NC, USA). The rod diameters are 0.75, 1.0, 1.35, 1.70, 2.0 and 2.4 mm with a rod to rod distance of twice the rod diameter. The phantoms were rotated through 40 projection angles over a 180 degree range during the scans. A plane source phantom of 48×20×5 mm3 was used for direct detector normalization. Separate normalizations were acquired for the two different scanner configurations. A lower energy threshold of 250 keV was applied when list mode data were sorted into projection data and events were histogrammed using 20 DOI bins (each bin corresponding to 1 mm along the length of the crystal) using one of two DOI calibration methods which will be described in detail later. All events were assigned to the center of the corresponding DOI bin. List mode data were histogrammed into sinograms of 120 view angles over 180 degrees and 192 radial samples with a 0.25-mm sampling distance. The fine sampling distance was used to take advantage of the oversampling provided by DOI measurements. However, because of the fine sampling distance, there exist sinogram bins that do not receive enough counts, which can cause streaking artifacts if not handled properly. This was a severe problem when we simulated cases with no DOI information. To address this problem, we considered all the sinogram bins that receive less counts than 1/20th of the maximum counts in the normalization scan as “poorly sampled.” The value of the threshold in all the experiments was above 500 counts. For all phantom scans, the values of the poorly sampled sinogram bins were estimated by a triangle-based linear interpolation using neighboring well-sampled bins after normalization. The images were reconstructed by filtered backprojection with a Shepp-Logan filter, cut off at 1.0 and 0.5 of the Nyquist frequency, for the line source phantom and hot rod phantom respectively. Gaussian fitting was used to obtain the full width at half maximum image spatial resolution. Filtered backprojection was chosen because it is a linear algorithm with no resolution compensation, thus enabling a fair comparison between the different methods.
3. Results
3.1 DOI response variations across all crystals in an array
For the dual-ended readout detector, the DOI ratio is calculated using the measured total energy signals from each of the two PSAPDs using the following equation:
| (1) |
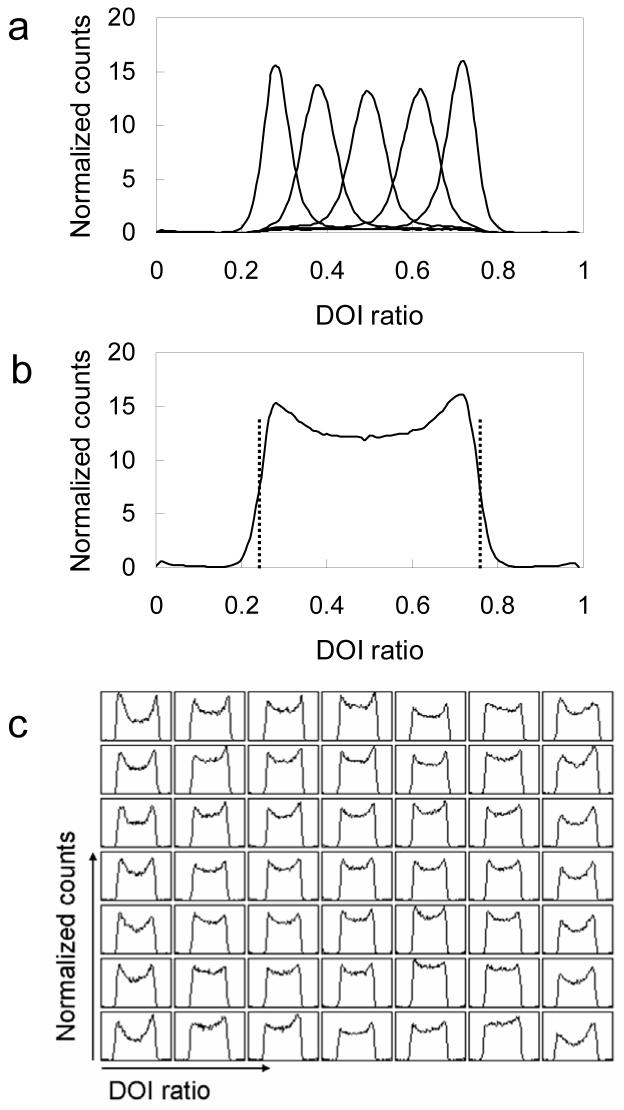
E1 and E2 are the summed energy signal measured from of PSAPD 1 and PSAPD 2 respectively and PSAPD 1 is defined as being the one on the front (entrance face) of the LSO array. k is a parameter to match the gain of the two PSAPDs. Figure 2a and 2b show the DOI responses obtained for all crystals in one detector module for depths of 2, 6, 10, 14, 18 mm, and for uniform irradiation. For each detector module, k is adjusted such that the DOI response corresponding to a depth of 10 mm (taken to be the average of the DOI ratios at depths of 0 mm and 20 mm as defined by the dashed lines in Figure 2b) has a DOI ratio of 0.5. Figure 2c shows the DOI responses of all 49 crystals in an array for uniform irradiation from the side.
Figure 2.
DOI responses of all crystals in an array (a) at five individual depths of 2, 6, 10, 14, 18 mm and (b) for simultaneous irradiation of all depths in the array. The two vertical lines in (b) mark the DOI ratio at half of the maximum counts on the left and right hand side of the DOI responses for the entire array, which are treated as corresponding to irradiation depths of 0 and 20 mm (two ends of the arrays). This information is used to derive the linear calibration curve. (c) DOI responses for all 49 crystals in one detector array.
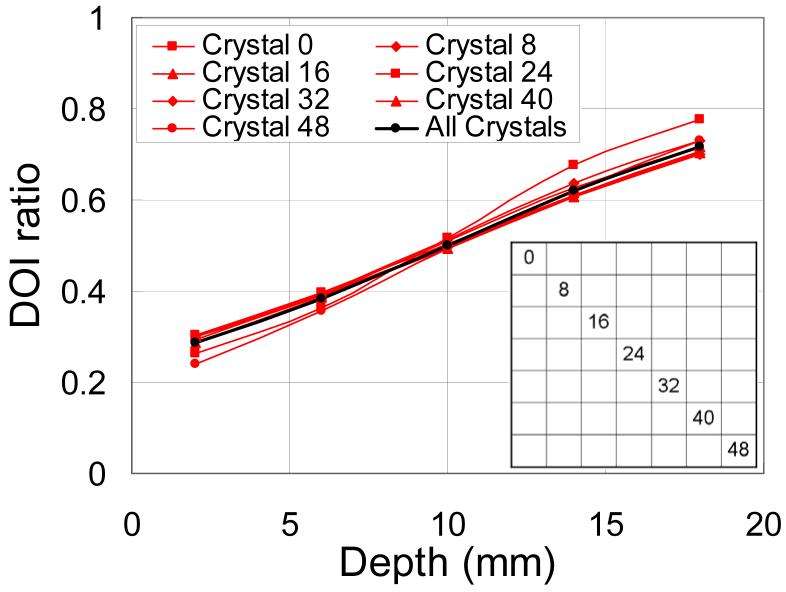
Figure 3 shows the dependence of the DOI ratio on irradiation depth for individual crystals and the average DOI ratio of all 49 crystals as a function of depth. Only the data for the 7 crystals along the diagonal of the LSO array are shown for clarity. The mean DOI ratio at different depths was obtained by Gaussian fitting of the DOI responses measured at that depth. Small variations in DOI ratio as a function of depth were observed for different crystals. There are many possible reasons for these variations such as differences in the surface roughness of the crystals, variations in reflector, the relative positions of crystals within an array and gain non-uniformity across the PSAPD surface. Figure 3 shows that the DOI ratio of all the central crystals is similar. We hypothesize that the larger variations in DOI ratio observed for the corner crystals is caused by increased light loss for these elements. Unpolished LSO arrays are used in this work in order to obtain a better DOI resolution (Yang et al., 2006) and the inter crystal reflector is a very thin (65 μm) ESR reflector (Weber et al., 2000) in order to increase LSO packing fraction. For the middle crystals in the array, light photons may still reach the PSAPDs through the neighboring crystals even if they penetrate the reflector. For the corner and edge crystals, a significant number of these penetrating photons will escape the array and will not impinge on the active surface of the PSAPD.
Figure 3.
DOI ratio versus depth for seven individual crystals and the average DOI ratio versus depth for all 49 crystals in an array.
Despite this effect, the DOI ratio variations across all crystals are relatively small. We have shown previously that the DOI resolution obtained from using the summed DOI response of all crystals is degraded by less than 10% compared with that obtained from DOI responses of individual crystals (Yang et al., 2008). A slightly nonlinear dependence of the DOI ratio on depth also was observed. The nonlinearity is largest for the corner and edge crystals. The peaks observed at either end of the DOI response curves when uniformly irradiating the whole length of the detector come from this nonlinear dependence (see Figure 2b).
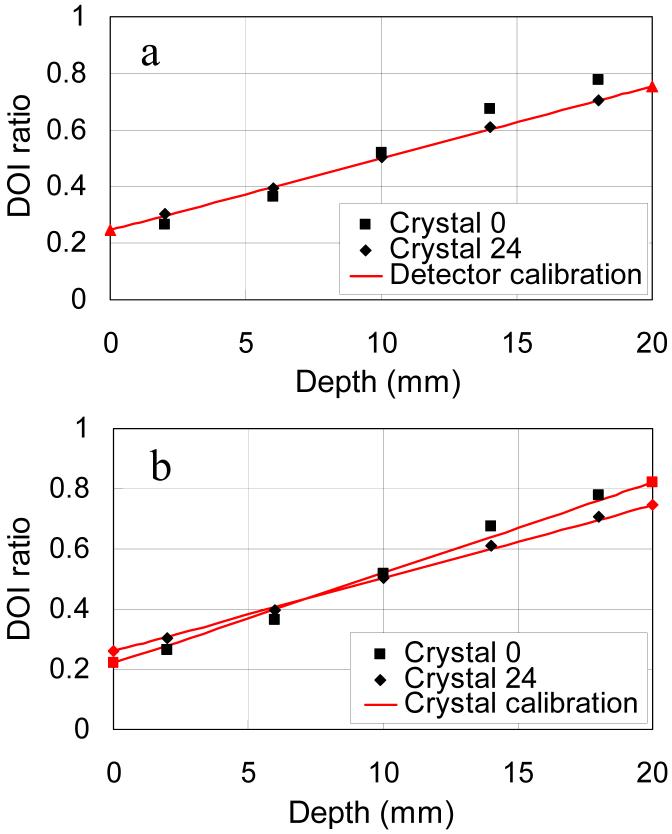
DOI calibration parameters can be obtained from the DOI ratio versus depth curves shown in Figure 3. But for a PET scanner consisting of many detectors it is very time consuming and sometimes even impractical to measure the DOI ratio versus depth curves for every single crystal in the scanner. For example, depending on the scanner geometry, it may not be possible to irradiate every detector from the side at known depths. In this work we introduce two simple and practical linear DOI calibration methods and evaluate how well they work. These methods do not require irradiation at known depths and all detectors can be calibrated simultaneously. The first method is a linear detector calibration and the second one is a linear crystal calibration. Figure 4 shows the outcome of the two DOI calibration methods superimposed on the experimental data from just 2 of the 49 crystals for clarity.
Figure 4.
Principle of (a) linear detector DOI calibration and (b) linear crystal DOI calibration. For the linear detector DOI calibration, the calibration parameters are obtained from the DOI response of the entire array. The red points at 0 and 20 mm depth are estimated from the dashed lines in Figure 2b and a linear fit (red line) is obtained. The same calibration parameters are used for all crystals in an array. For the linear crystal DOI calibration, DOI calibration parameters for each crystal are obtained individually from the DOI responses of that crystal using the data shown in Figure 2c. For clarity the calibration curves and data for just two crystals are shown.
For the linear detector DOI calibration, the histogram of the DOI ratio obtained from the entire array as shown in Figure 2b is used to derive the calibration parameters. The DOI ratio that corresponds to interactions at the two ends of the crystal array (e.g. 0 and 20 mm) is estimated by taking the points at which the DOI ratio distribution drops to one half of its maximum value as illustrated by the dashed lines in Figure 2b. The depth of interaction for any event is then given by linear interpolation within this DOI ratio range and the calibration is identical for all crystals within one detector module.
The linear crystal DOI calibration follows the same procedure, except that the DOI ratio corresponding to interactions at 0 and 20 mm are derived for every crystal independently (using data in Figure 2c), giving a unique linear calibration for every crystal in the detector (Wang et al., 2004).
Figure 4a shows that the detector-level calibration does well for the center crystals but makes an error for corner crystals. An intermediate error is made for edge crystals (data not shown). The crystal-level calibration accounts for position-dependent DOI responses and only makes the assumption that the DOI ratio varies linearly with depth. This gives a better fit to the measured data (Figure 4b), although the DOI ratio versus depth curves of individual crystals are not exactly linear, the approximation is not unreasonable (Figure 3) and leads to a simple calibration method.
Table 1 shows the error (computed as the standard deviation) between the calibrated depths and the known depths (depths of 2, 6, 10, 14, 18 mm) for all crystals in an array using the two DOI calibration methods. For the linear detector calibration the average DOI error is 0.8 mm. For the linear crystal DOI calibration the average DOI error is 0.5 mm. For the detector-level calibration the error is a combination of DOI ratio variations across all crystals and the non-linearity of the DOI ratio versus depth curves. For the crystal-level calibration the primary cause of error is assumed to be due to the non-linearity of the DOI ratio versus depth curves.
Table 1.
Average DOI error (standard deviation in mm) of the calibrated depths compared with known depths averaged over all crystals in one detector array
| Depth (mm) | 2 | 6 | 10 | 14 | 18 |
|---|---|---|---|---|---|
| Crystal Calibration | 0.44 | 0.65 | 0.23 | 0.61 | 0.34 |
| Detector Calibration | 0.92 | 0.87 | 0.32 | 0.90 | 0.87 |
3.2 DOI response variations of all eight detectors in the prototype PET scanner
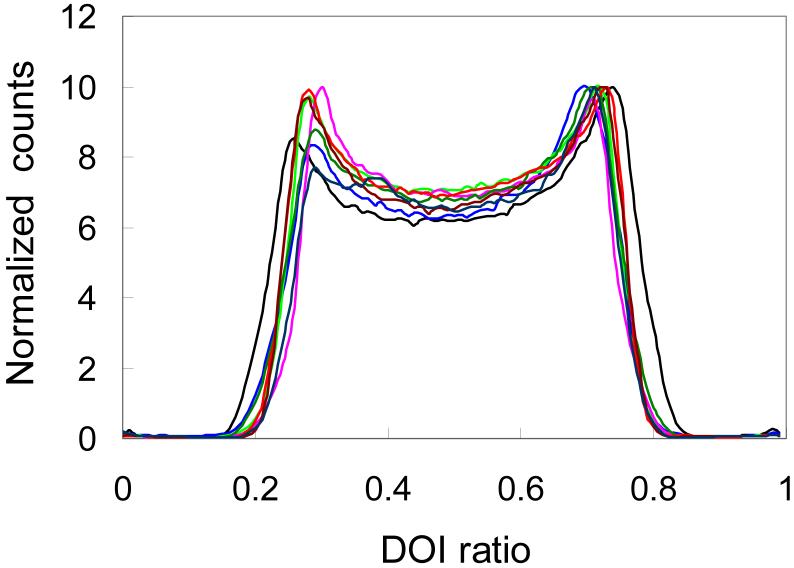
Figure 5 shows the DOI responses for each of the 8 detectors in the prototype scanner when the arrays were uniformly irradiated by a point source from one side. A small difference in the DOI response was observed and is thought to be mainly due to the array fabrication process, for example the exact crystal surface roughness of different arrays may be slightly different. Table 2 shows the DOI error (measured as standard deviation in mm) of the calibrated depths compared to the known depths averaged over all 49 crystals in each of the 8 detectors of the prototype scanner. The DOI errors for different detectors show similar trends. For the linear detector DOI calibration, the DOI error is smaller at the center of the detector than at either end. For the linear crystal DOI calibration, the DOI errors are smaller and less variable with depth. The mean DOI error across the 8 detector modules was 0.8 mm for the linear detector calibration and 0.5 mm for the linear crystal calibration.
Figure 5.
DOI responses of the entire array for all eight detectors in the prototype PET scanner obtained with a point source uniformly irradiating each detector from one side.
Table 2.
Average DOI error (standard deviation in mm) of the calibrated depths compared with known depths for all crystals for each of the eight detector arrays of the prototype scanner
| Depth (mm) | 2 | 10 | 18 | |||
|---|---|---|---|---|---|---|
| Crystal | Detector | Crystal | Detector | Crystal | Detector | |
| Detector 1 | 0.39 | 0.97 | 0.66 | 0.76 | 0.43 | 1.09 |
| Detector 2 | 0.52 | 1.29 | 0.49 | 0.35 | 0.73 | 0.89 |
| Detector 3 | 0.70 | 1.21 | 0.50 | 0.37 | 0.39 | 0.73 |
| Detector 4 | 0.60 | 1.26 | 0.57 | 0.53 | 0.31 | 0.98 |
| Detector 5 | 0.47 | 1.36 | 0.47 | 0.46 | 0.23 | 0.99 |
| Detector 6 | 0.20 | 0.67 | 0.21 | 0.18 | 0.37 | 0.42 |
| Detector 7 | 0.44 | 0.71 | 0.60 | 0.71 | 0.37 | 0.79 |
| Detector 8 | 0.43 | 1.43 | 0.81 | 1.35 | 0.53 | 1.02 |
| Average | 0.47 | 1.11 | 0.54 | 0.59 | 0.42 | 0.86 |
3.3 DOI calibration parameters on source positions
The DOI response as a function of source position was similar for all crystals and detectors, therefore only results from one detector are presented here to illustrate our findings. Figure 6 shows the DOI response for irradiation of the entire detector with a point source positioned at the side and front of the array, as well as using LSO background. The DOI ratio at which half of the maximum counts are registered (dashed lines) on the left and right sides of the curves are the same for all the three situations, demonstrating that the linear DOI calibration parameters that are derived do not depend on the source location. Thus, DOI calibration parameters for the two methods presented can be obtained from singles measurements with any source in the field of view of the scanner, or from the LSO background. This will allow all detectors in a scanner to be calibrated at the same time with no special equipment or set-up.
Figure 6.
DOI responses of an entire array measured with a point source positioned at the side, in front of the array and using just the LSO background. The two vertical lines mark the half-maximum DOI ratio used in the calibration to correspond to depths of 0 and 20 mm.
3.4 Phantom studies
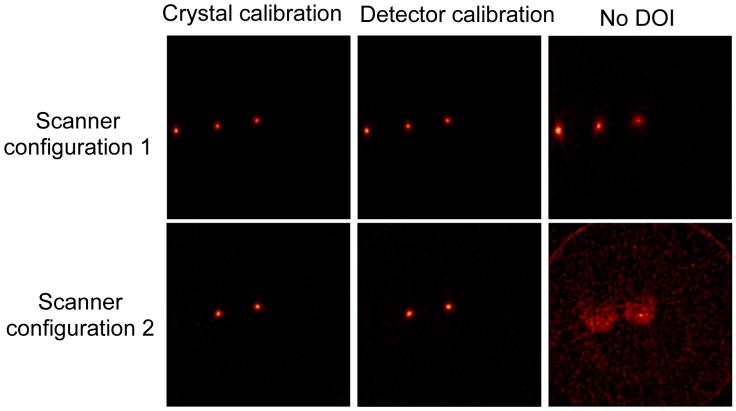
No significant differences were observed in the flood histograms obtained from each detector across the six different phantom scans performed. Crystal look-up tables for all detectors were created from the flood histograms obtained from the normalization phantom scan in scanner configuration 1 and applied to all other studies. For different phantom scans, slightly different DOI responses, which mainly were caused by temperature variations in the detector boxes, were observed for some detectors. The gain matching parameter k (see Equation 1) was adjusted when necessary to match the PSAPD responses. The DOI calibration parameters used were the same for all six scans. Figure 7 shows images of the line source phantom acquired with the two scanner configurations and reconstructed using the two different DOI calibration methods, and also without DOI information. Tables 3 and 4 show the measured image spatial resolution. As expected, DOI measurement greatly improved the reconstructed image spatial resolution. Only small differences were seen between the linear detector and the linear crystal DOI calibration methods. For the first scanner configuration, the reconstructed image resolution (averaged over x and y) for the central line source was 1.63 mm without DOI information, and 0.91 mm and 0.89 mm for detector and crystal DOI calibrations respectively. For the second scanner configuration, the image spatial resolution cannot be properly obtained from the image without DOI measurement since the image was badly degraded by parallax errors. The image spatial resolution of the central line source is 1.02 mm and 0.94 mm with the detector and crystal DOI calibrations. The improvement of the image spatial resolution when comparing crystal DOI calibration to detector DOI calibration is 8% for the second scanner configuration and 2% for the first scanner configuration.
Figure 7.
Images of a line source phantom reconstructed with (left) a linear crystal DOI calibration and (middle) a linear detector DOI calibration, and (right) without DOI information. The images were reconstructed by FBP with a Shepp-Logan filter cut off at the Nyquist frequency.
Table 3.
FWHM image resolution of the line source phantom reconstructed with a linear crystal DOI calibration, a linear detector DOI calibration and without DOI information. The scanner configuration is shown in Figure 1a
| DOI calibration methods | Crystal Calibration | Detector Calibration | No DOI | |
|---|---|---|---|---|
| Source 1 (x=0 mm) | x | 0.83 mm | 0.86 mm | 1.71 mm |
| y | 0.94 mm | 0.96 mm | 1.55 mm | |
| Source 2 (x=7.5 mm) | x | 0.78 mm | 0.80 mm | 1.00 mm |
| y | 0.92 mm | 0.97 mm | 1.62 mm | |
| Source 3 (x=15 mm) | x | 0.74 mm | 0.76 mm | 1.16 mm |
| y | 1.01 mm | 1.03 mm | 1.93 mm | |
Table 4.
FWHM image resolution of the line source phantom reconstructed with a linear crystal DOI calibration, a linear detector DOI calibration and without DOI information. The scanner configuration is shown in Figure 1b
| DOI calibration methods | Crystal Calibration | Detector Calibration | No DOI | |
|---|---|---|---|---|
| Source 1 (x=0 mm) | x | 0.94 mm | 1.00 mm | N/A |
| y | 0.93 mm | 1.03 mm | N/A | |
| Source 2 (x=7.5 mm) | x | 0.97 mm | 1.05 mm | N/A |
| y | 1.02 mm | 1.10 mm | N/A | |
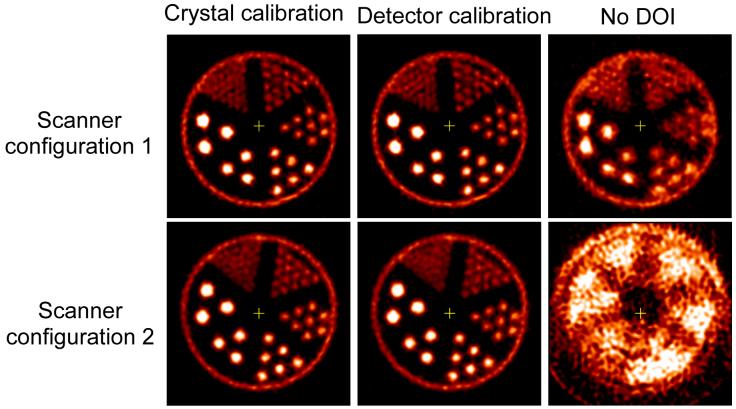
Figure 8 shows images of the hot rod phantom acquired with the two different scanner configurations and reconstructed with different DOI calibrations and without DOI information. For the first scanner configuration, using either detector or crystal DOI calibration, hot rods with a diameter of 0.75 mm were resolved. Without use of DOI information, rods with a diameter of 1.7 mm were barely resolved. No significant difference of the images obtained by using detector and crystal DOI calibration were observed. For the second scanner configuration, much bigger DOI effects were apparent as expected. Without DOI information, even the largest rods with a diameter of 2.4 mm diameter could not be resolved, because the effective detector size is about 6.8 mm. With DOI measurement, rods of 1 mm diameter were clearly resolved no matter whether the detector or crystal DOI calibration was used.
Figure 8.
Images of a hot rod phantom reconstructed with (left) a linear crystal DOI calibration and (middle) a linear detector DOI calibration, and (right) without DOI information. The rod diameters are 0.75, 1.0, 1.35, 1.70, 2.0 and 2.4 mm. Rod to rod separation is twice the rod diameter. The images were reconstructed by FBP with a Shepp-Logan filter cut off at 0.5 of the Nyquist frequency.
4. Discussion and Conclusion
DOI responses of eight dual-ended readout detectors within a prototype depth-encoding scanner were measured. Small variations in the DOI responses were observed for different detectors and the variation was mainly attributed to small differences in the LSO array fabrication process. DOI ratio variations between crystals in an array were also observed and possible reasons were discussed. A slightly non-linear dependence of the DOI ratio on depth was observed with a greater non-linearity for the edge and corner crystals. A linear detector DOI calibration method and a linear crystal DOI calibration method suitable for use in a depth-encoding scanner were investigated. The DOI error was similar for all eight detectors. The average DOI error is 0.8 mm if the detector-level DOI calibration is used, and 0.5 mm if the crystal-level calibration is used. These errors are smaller than the 2 mm DOI resolution of these detectors (Yang et al., 2008) and the 1 mm depth bins used to create the projection data, therefore these simple and practical calibrations are considered acceptable. The linear DOI calibration parameters can be obtained from any source distribution and location, as well as from the intrinsic LSO background. Phantom studies performed in the prototype scanner showed that DOI measurements significantly improved the image spatial resolution no matter which of the two DOI calibration methods was used and that the crystal DOI calibration provided slightly better image spatial resolution than the detector DOI calibration. The linear detector DOI calibration method needs less time than the crystal DOI calibration since the number of detector is on the order of a hundred times smaller than the number of crystals in a PET scanner.
In summary, we have demonstrated two simple and practical DOI calibration methods that allow the use of depth-encoding detectors within a PET scanner and permit correction of parallax errors to the level permitted by the DOI resolution of the detectors. DOI calibration parameters are not necessary for each individual scan. They can be obtained at the initial scanner setup and then intermittently over time, or after detector changes, much like detector normalization scans. Indeed, they can be incorporated as part of the detector normalization process. The methods used make an assumption of linearity in the depth response. For our detectors, this is demonstrated to be a good approximation and the calibration errors are significantly less than the detector DOI resolution. Calibration errors therefore are not limiting performance. For detectors with highly non-linear depth response, or with superior DOI resolution, more complex methods may be required, for example the approach proposed in (Shao et al., 2007).
Acknowledgements
This work was funded by NIH grant R01 EB006109 and by SBIR funding from NIBIB.
References
- Burr KC, Ivan A, Castleberry DE, LeBlanc JW, Shah KS, Farrell R. Evaluation of a prototype small animal PET detector with depth-of-interaction encoding. IEEE Transactions on Nuclear Science. 2004;51:1791–8. [Google Scholar]
- Dokhale PA, Silverman RW, Shah KS, Grazioso R, Farrell R, Glodo J, McClish MA, Entine G, Tran VH, Cherry SR. Performance measurements of a depth-encoding PET detector module based on position-sensitive avalanche photodiode read-out. Physics in Medicine and Biology. 2004;49:4293–304. doi: 10.1088/0031-9155/49/18/007. [DOI] [PubMed] [Google Scholar]
- Du HN, Yang YF, Cherry SR. Measurements of wavelength shifting (WLS) fibre readout for a highly multiplexed, depth-encoding PET detector. Physics in Medicine and Biology. 2007;52:2499–514. doi: 10.1088/0031-9155/52/9/011. [DOI] [PubMed] [Google Scholar]
- Eriksson L, Wienhard K, Eriksson M, Casey ME, Knoess C, Bruckbauer T, Hamill J, Schmand M, Gremillion T, Lenox M, Conti M, Bendriem B, Heiss WD, Nutt R. The ECAT HRRT: NEMA NEC evaluation of the HRRT system, the new high-resolution research tomograph. IEEE Transactions on Nuclear Science. 2002;49:2085–8. [Google Scholar]
- Huber JS, Choong WS, Wang J, Maltz JS, Qi J, Mandelli E, Moses WW. Development of the LBNL positron emission mammography camera. IEEE Transactions on Nuclear Science. 2003;50:1650–3. [Google Scholar]
- Inadama N, Murayama H, Hamamoto M, Tsuda T, Ono Y, Yamaya T, Yoshida E, Shibuya K, Nishikido F. 8-Layer DOI encoding of 3-dimensional crystal array. IEEE Transactions on Nuclear Science. 2006;53:2523–8. [Google Scholar]
- Judenhofer MS, Pichler BJ, Cherry SR. Evaluation of high performance data acquisition boards for simultaneous sampling of fast signals from PET detectors. Physics in Medicine and Biology. 2005;50:29–44. doi: 10.1088/0031-9155/50/1/003. [DOI] [PubMed] [Google Scholar]
- Moses WW, Derenzo SE. Design studies for a PET detector module using a PIN photodiode to measure depth of interaction. IEEE Transactions on Nuclear Science. 1994;41:1441–5. [Google Scholar]
- Rouze NC, Schmand M, Siegel S, Hutchins GD. Design of a small animal PET imaging system with 1 microliter volume resolution. IEEE Transactions on Nuclear Science. 2004;51:757–63. [Google Scholar]
- Saoudi A, Pepin CM, Dion F, Bentourkia M, Lecomte R, Andreaco M, Casey M, Nutt R, Dautet H. Investigation of depth-of-interaction by pulse shape discrimination in multicrystal detectors read out by avalanche photodiodes. IEEE Transactions on Nuclear Science. 1999;46:462–7. [Google Scholar]
- Shah KS, Farrell R, Grazioso R, Harmon ES, Karplus E. Position-sensitive avalanche photodiodes for gamma-ray imaging. IEEE Transactions on Nuclear Science. 2002;49:1687–92. [Google Scholar]
- Shah KS, Grazioso R, Farrell R, Glodo J, McClish M, Entine G, Dokhale P, Cherry SR. Position sensitive APDs for small animal PET imaging. IEEE Transactions on Nuclear Science. 2004;51:91–5. [Google Scholar]
- Shao Y, Li H, Yao R, Ma T. Calibration of a Dual-Scintillator-Readout PET Detector: A Practical and Accurate Method to Calibrate the Depth-of-Interaction Function of All Scintillator Crystals; IEEE Nuclear Science Symposium and Medical Imaging Conference; Honolulu, Hawaii. 2007. [Google Scholar]
- Tai YC, Chatziioannou AF, Yang YF, Silverman RW, Meadors K, Siegel S, Newport DF, Stickel JR, Cherry SR. MicroPET II: design, development and initial performance of an improved microPET scanner for small-animal imaging. Physics in Medicine and Biology. 2003;48:1519–37. doi: 10.1088/0031-9155/48/11/303. [DOI] [PubMed] [Google Scholar]
- Tai YC, Ruangma A, Rowland D, Siegel S, Newport DF, Chow PL, Laforest R. Performance evaluation of the microPET focus: A third-generation microPET scanner dedicated to animal imaging. Journal of Nuclear Medicine. 2005;46:455–63. [PubMed] [Google Scholar]
- Tsuda T, Murayama H, Kitamura K, Yamaya T, Yoshida E, Omura T, Kawai H, Inadama N, Orita N. A four-layer depth of interaction detector block for small animal PET. IEEE Transactions on Nuclear Science. 2004;51:2537–42. [Google Scholar]
- Wang GC, Huber JS, Moses WW, Choong WS, Maltz JS. Calibration of a PEM detector with depth of interaction measurement. IEEE Transactions on Nuclear Science. 2004;51:775–81. [Google Scholar]
- Wang YC, Seidel J, Tsui BMW, Vaquero JJ, Pomper MG. Performance evaluation of the GE healthcare eXplore VISTA dual-ring small-animal PET scanner. Journal of Nuclear Medicine. 2006;47:1891–900. [PubMed] [Google Scholar]
- Weber MF, Stover CA, Gilbert LR, Nevitt TJ, Ouderkirk AJ. Giant birefringent optics in multilayer polymer mirrors. Science. 2000;287:2451–6. doi: 10.1126/science.287.5462.2451. [DOI] [PubMed] [Google Scholar]
- Wienhard K, Schmand M, Casey ME, Baker K, Bao J, Eriksson L, Jones WF, Knoess C, Lenox M, Lercher M, Luk P, Michel C, Reed JH, Richerzhagen N, Treffert J, Vollmar S, Young JW, Heiss WD, Nutt R. The ECAT HRRT: Performance and first clinical application of the new high resolution research tomograph. IEEE Transactions on Nuclear Science. 2002;49:104–10. [Google Scholar]
- Wu Y, Catana C, Cherry SR. A multiplexer design for position-sensitive avalanche photodiode detectors in a PET scanner. IEEE Transactions on Nuclear Science. 2008;55:463–8. [Google Scholar]
- Yang Y, Tai YC, Siegel S, Newport DF, Bai B, Li QZ, Leahy RM, Cherry SR. Optimization and performance evaluation of the microPET II scanner for in vivo small-animal imaging. Physics in Medicine and Biology. 2004;49:2527–45. doi: 10.1088/0031-9155/49/12/005. [DOI] [PubMed] [Google Scholar]
- Yang YF, Dokhale PA, Silverman RW, Shah KS, McClish MA, Farrell R, Entine G, Cherry SR. Depth of interaction resolution measurements for a high resolution PET detector using position sensitive avalanche photodiodes. Physics in Medicine and Biology. 2006;51:2131–42. doi: 10.1088/0031-9155/51/9/001. [DOI] [PubMed] [Google Scholar]
- Yang YF, Wu YB, Qi J, James ST, Du HN, Dokhale PA, Shah KS, Farrell R, Cherry SR. A prototype PET scanner with DOI-encoding detectors. J. Nucl. Med. 2008;49:1132–40. doi: 10.2967/jnumed.107.049791. [DOI] [PMC free article] [PubMed] [Google Scholar]
- Zhang N, Thompson CJ, Cayouette F, Jolly D, Kecani S. A prototype modular detector design for high resolution positron emission mammography imaging. IEEE Transactions on Nuclear Science. 2003;50:1624–9. [Google Scholar]


