

Abstract
We incorporate stochastic, density-dependent seasonal recruitment in adult Anopheles mosquito populations in a discrete-event model of Plasmodium falciparum malaria transmission and find the probabilities of parasite extinction higher than with perennial transmission. Seasonal fluctuations in vector populations act to synchronize the dynamics of infection and immunity in host populations, leading to fluctuations in parasite prevalence greater than expected solely on the basis of high- and low-season vector densities. This synchronization also biases frequencies of infection with multiple parasite phenotypes or genotypes.
Keywords: host, infection, local extinction, malaria, parasite, seasonal, transmission, vector
Introduction
Plasmodium infection of a human begins with a small inoculum of sporozoites from the salivary glands of a blood-feeding female Anopheles mosquito. The sporozoites penetrate liver cells, and in hepatic schizogony transform and multiply to produce thousands of free merozoites. Each asexual merozoite invades a red blood cell, completes another multiplication (erythrocytic schizogony), then bursts the cell, releasing 8–32 more merozoites to invade more red blood cells. This asexual blood cycle may be repeated many times, in the course of which some invading merozoites may instead develop into the sexual, nonreplicating transmissible stages known as gametocytes. If viable gametocytes of each sex are taken up by a feeding Anopheles, fertilization may produce the zygotes from which infective sporozoites may arise.
In 1910, Ross developed the first mathematical model of malaria transmission. His modeling led to several conclusions that his contemporaries found patently absurd, among which was a concept of threshold densities of Anopheles, below which malaria became locally extinct: “Thus from such reasoning alone we derive the very important practical conclusion that in order to counteract malaria, anywhere we need not banish Anopheles there entirely—we need only to reduce their numbers below a certain figure” (Ross 1928). The results of campaigns in Malaysia and Egypt appeared to support this conclusion, but it was widely ignored, in Ross’ era and after.
In the 1950s Macdonald extended Ross’s basic model, analyzed several factors contributing to malaria transmission—at equilibrium—and concluded that “the least influence is the size of the mosquito population, upon which the traditional attack has always been made” (Macdonald 1956). His model guided the enormous global malaria-eradication campaign of his era, supporting its shift in focus from the reduction of overall Anopheles densities, through larvicides, to the specific targeting of older adult females, through residual household DDT.
A general concept of threshold densities has gained great prominence in infectious-disease epidemiology, of course, particularly with respect to vaccination (Anderson and May 1991), but these threshold densities are of hosts susceptible to directly transmitted infections. It has recently been argued that seasonal effects increase the probability of extinction of the etiological agent of measles, a directly transmitted virus, by increasing the synchrony of subpopulation epidemics (Grenfell et al. 1995), and that mosquitoes are so mobile and short-lived that the epidemiological dynamics of mosquito-borne and directly transmitted infections are essentially indistinguishable (Dye and Williams 1995). Twenty years ago Aron and May (1982) noted that the incorporation of simple sinusoidal variation in vector density within classic differential-equation malaria models produces relative phases in transmission cycles similar to those observed in seasonal environments.
Hackett (1937) argued that the spontaneous recession of malaria from much of northern Europe was largely a fortuitous byproduct of unintended anthropogenic influences on the seasonal dynamics of vector populations. Yet, Gill (1938) was the last to undertake a general, systematic investigation of seasonality in malaria. Having noted that “the cause of the seasonal periodicity of malaria is still imperfectly understood and … the whole question of the influence of climate and season upon the natural history of the disease requires re-examination,” he assembled and analyzed the available data—and inferred the existence of a relapsing form of Plasmodium vivax, a form not demonstrated empirically until the 1980s. There is no question that the overall density of Anopheles and frequency of malaria vary from place to place, and from time to time at a single place; a collection of relevant longitudinal field data is available in Appendix A.
Here we begin again to explore how such variations might be related, and how they might relate to the possibility of local or periodic extinctions of Plasmodium falciparum, the most prominent of the four species that cause human malaria.
Methods
Our discrete-event model of perennial P. falciparum transmission adapts the population-compartment scheme of classic models to the level of individuals within interacting host and vector populations, using a single timeline variable to track each parasite life cycle within and between individuals (Fig. 1). We have previously described the assumptions, implementation, and behaviors of the model in detail, and compared them to those of classic malaria-transmission models (McKenzie et al. 1998, 1999); some of this more detailed information is available in Appendix B.
Fig. 1.

A schematic of the discrete-event model, representing the status of a female Anopheles mosquito (top) and of a human (bottom) with respect to appropriate stages of the Plasmodium falciparum life cycle. Vector blood meals allow parasite transmission, linking the two phases. McKenzie et al. (1998) provides a detailed description.
As in our previous work, here we set the intervals required to progress from an infected to an infectious state at 10 and 20 d for the vector and host, respectively, and the host population size at 500, with 25% of the hosts and none of the vectors initially infected. The duration of host infectivity to vectors ranges from 10 to 40 d. “Prevalence” is the size of the population with a given attribute divided by the total size of the population examined at a given location at a given time. Unless stated otherwise, the numerator used to calculate prevalence in either hosts or vectors is the total number of individuals infected and/or infectious. As before, all prevalence figures represent means over 100 replicates for each parameter set (standard deviations <0.01). Here prevalence figures are calculated over one full year after an initial 2 yr of equilibration, rather than over 3 mo after 9 mo (McKenzie et al. 1998, 1999); this allows us to compare means over full annual cycles, following stabilization of the various seasonal patterns (Williams and Dye 1997). Prevalence calculations exclude the runs in which parasite extinction occurred during the initial 2 yr, but include those in which extinction occurred in the third year. That is, both the initial conditions and the date at which the parasite went extinct, if it did, bias the prevalence figures in the first 2 yr; if the parasite did not go extinct in the first 2 yr, its prevalence in the third year is more representative of the typical prevalence for the parameter set. For instance, each point in Figs. 4 and 6 represents a particular parameter set, and plots the percentage of replicate runs in which the parasite went extinct during the first 2 yr against the mean third-year prevalence of the parasite in runs in which it persisted through 2 yr.
Fig. 4.

The frequency of parasite extinction during the initial two years of runs, plotted against the mean prevalence of P. falciparum malaria in the third year, over the parameter ranges described in the text (see Methods), with vector populations of 100–500. R2 = 0.83 for extinction frequency relative to 0–0.13 prevalence.
Fig. 6.

The frequency of parasite extinction during the initial two years of runs, plotted against the mean prevalence in the third year, over the parameter ranges described in the text (see Methods), with high-season lengths of 1-6 mo. R2 = 0.61 for extinction frequency relative to 0–0.21 prevalence.
We use the term “parasite entity” to reflect the absence of a genetic, immunological, or other basis for discriminating among the labeled parasite groups represented in this model. In previous work (McKenzie et al. 1999), in the context of perennial transmission, we investigated two contrasting versions of the basic model (McKenzie et al. 1998): one version in which two parasite phenotypes operate in literal independence, with no interactions or effects of one on the other, and another in which the phenotypes clearly interact, through interactions with a shared human immune response. Here we incorporate our seasonal-transmission scheme in the basic, single-phenotype model, and then in the former, independent-immunity version of the multiphenotype model; we then investigate intrahost parasite diversity using four completely identical and independent parasite entities, tracking the number of such entities in each individual host over time.
The model defines immunity in terms of an individual human’s susceptibility to reinfection with a given parasite entity, determined by a daily decay of protection after clearance of infection with that entity. The absence of definitive empirical data makes it difficult to determine a relevant parameter range under this operational (or any other) definition of human immunity in malaria. Our previous work focused on 100 d as a standard half-life of immunity, and systematically explored the effects of values ranging from 50 to 150 d. Here we expand our overall range, by setting 2000 d as a standard half-life. With this change, we repeated all previous runs under perennial-transmission conditions, systematically explored the effects of half-lives ranging from 1000 to 3000 d, and, as before, used the best-fit planes for the full series of prevalence-response surfaces to compare the average effects of parameters. Each such surface proved to be lower than that with shorter immunity half-lives, but remained well within the bounds of field data from perennial-transmission regions and fully in accord with the qualitative conclusions of our previous work (McKenzie et al. 1998, 1999). In particular, the influence of host infectivity on overall prevalence remained comparable to that of vector mortality and greater than that of immunity half-life (Fig. 2A).
Fig. 2.
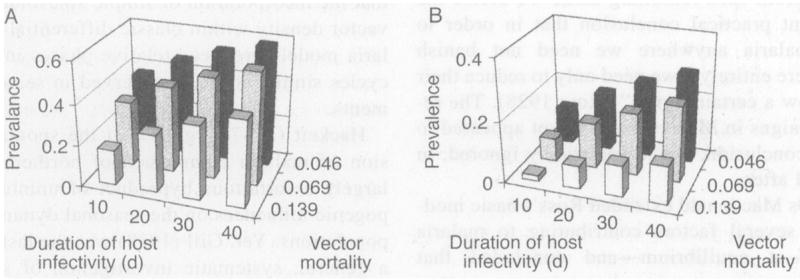
Prevalence of P. falciparum malaria, in a human population of 500, with the half-life of human immunity set at 2000 d, and with perennial vector populations of (A) 5000 or (B) 500. Other parameter values are as described in Methods and as shown.
Within the model, a given number of humans and mosquitoes are drawn at random each day, with replacement, for interaction through the taking of blood meals. Following Macdonald (1957) and our previous work, we fix the number of such bites per day at one-half the number of vectors, thereby assuming that humans are the sole source of vector blood meals and that there are no density-dependent changes in access to hosts. The mosquito-dynamics component of the model concerns only adult females, because only they are malaria vectors. It assumes a constant daily probability of death (parameter range 0.046–0.139, half-life 5–15 d), and in previous work maintained a constant population size by replacing each dead mosquito with one newly emerged adult. We generally assumed a constant 10:1 ratio of mosquitoes to humans, following Macdonald, but also derived an epidemiological power-law relationship over a range of ratios, specifically from 5:1 to 100:1 (McKenzie et al. 1998).
Here each dead mosquito is replaced by a number of newly emerged adults that is a Poisson random variable with parameter K/N, where N is the current vector population size; the length of each “season” and its corresponding value of K are parameters in the model. Here we set K at a “high-season” value (5000, a 10: 1 ratio with the human population) for 0, 30, 90, 180, or 360 d, and at a “low-season” value (500, a 1:1 ratio) for the remainder of each year. Because the number of mosquito deaths in a day is generally large (>10), we can approximate the Poisson by a normal random variable with mean and variance K/N, rounding the result to an integer (Haight 1967). The effect of density dependence swamps the stochastic fluctuations, so that even in very small mosquito populations (~25) the probability of vector extinction is near zero. As with most stochastic, density-dependent populations (Gotelli 1998), after equilibration the population mean fluctuates slightly below K (Fig. 3).
Fig. 3.

The time course of Anopheles population density, with daily vector mortality set at 0.069 and midyear “seasonal” switches from K = 500 to K = 5000 at day 135 and back at day 225.
As noted above, in the model with four completely identical and independent parasite entities we track the number of such entities in each individual host over time. We then compare the observed third-year frequency histograms for 0-, 1-, 2-, 3- and 4-entity infections to those expected by the binomial distribution of four entities, each with mean prevalence equal to that of the corresponding single-entity results for that parameter set and season length, and we compare the mean number of entities per host in each of the 100 replicates to the number expected under this null hypothesis. Because the observed values are not data, but estimates of the expectation of a random variable by a Monte Carlo process, assessing the significance of departures from a null hypothesis implies assessing how the variances resulting from the random number generator used in the simulation compare to those resulting from the phenomena as modeled. For this purpose we use a simple sign test, with a (one-tailed) 0.005 significance level, such that an observed value is considered to differ significantly from that expected under the null hypothesis when 66 or more replicates (of 100 for the parameter set) produce averages that are greater than the expected value.
Results
Perennially small vector populations
Fig. 4 shows the frequencies of parasite extinction during the initial 2 yr of runs, plotted against prevalence in humans in the third year, for the parameter ranges described above (see Methods) and constant vector populations of 100, 200, 300, 400, and 500. Extinctions occur only with mean prevalences below 14%; within this range, higher frequencies of extinction are associated with lower prevalences. Allowing for extinctions that occur during the third year (and depress mean prevalences), these observations indicate that critical prevalence thresholds exist and are in the 15–20% range for a host population of 500 and vector population of 500 or less. Though the persistence and prevalence of the parasite increase with vector population size, both characteristics depend as much or more on values within the parameter set per se. As with much larger perennial vector populations (McKenzie et al. 1998), here overall persistence and prevalence are most strongly influenced by the values of the vector-mortality and host-infectivity parameters (Fig. 2B). We have never observed extinction of the parasite with a host population of 500 and a constant vector population of 5000 or more.
Seasonal cycles in prevalence
Fig. 5 shows prevalence in humans over a typical annual cycle, with the vector-population K set at 5000 for a 6-mo high season and at 500 for a 6-mo low season, and illustrates the principle of synchronization of infections by seasonality in transmission. Host immunity decays during the low season, then, as the high season starts and vector density increases, the relatively low level of immunity allows infection rates that dramatically increase parasite prevalence. Immunity is high and prevalence falls as hosts clear the parasite; infection rates are reduced even further because prevalence in the vectors closely follows prevalence in the hosts. In this example, the low season begins just as the next upswing is starting. Prevalence falls dramatically, to levels well below the critical threshold associated with increased extinction frequencies.
Fig. 5.

The time course of parasite prevalence, with the half-life of human immunity set at 2000 d, daily vector mortality at 0.069, and duration of host infectivity at 20 d, and with high and low seasons each 180 d in length. The solid line represents the third-year prevalence, averaged over four replicates, and the (horizontal) dotted lines represent the corresponding equilibrium prevalences for perennial vector populations of 5000 (top, 0.42) and 500 (bottom, 0.15); overall mean annual third-year prevalence with this parameter set and season length is 0.28.
Variation in season length
Fig. 6 shows the frequencies of parasite extinction during the initial 2 yr of runs, plotted against prevalence in humans in the third year, for the parameter ranges described above (see Methods) and high seasons of 1, 3, and 6 mo. Extinctions occur only with mean prevalences below 22%, and within this range higher frequencies of extinction are associated with lower prevalences; the likely critical threshold is higher and the extinction-prevalence association less strong than with perennially small vector populations. Point-by-point inspection (not shown) indicates that overall prevalence depends not just on season length, but on values within the parameter set per se, with the influence of vector mortality greater than that of the duration of host infectivity, which is in turn greater than that of the decay rate of host immunity. With seasonal transmission, 87% of parameter sets in which extinctions occur include the highest vector-mortality parameter value (vs. 65% with a perennial vector population of 500); no extinctions occur with the lowest value (vs. 9%). For all parameter sets, mean annual third-year prevalence with seasonal transmission is close to the corresponding weighted mean with perennial high and low vector-density values, but is slightly lower with the highest vector-mortality parameter value and slightly higher with the lowest value.
Fig. 7 illustrates that extinction frequencies rise from a given level for a constant vector population of 500 to a peak with a 1-mo high season (vector population of 5000), and then fall off from that peak with longer periods of high transmission. This result holds over all parameter sets, although the mean annual third-year prevalences are at least equal and usually higher with longer high seasons. Extinction frequencies are generally higher with high seasons of 90 d, and lower with high seasons of 180 d, than those with a constant vector population of 500.
Fig. 7.

Extinction frequencies across varying high-season lengths, with daily vector mortality set at 0.139 and matched parameter sets, as shown. With the duration of host infectivity set at 30 d and half-life of human immunity at 2000 d, for high seasons of 0, 30, 90, and 180 d, mean annual third-year prevalence is 0.10, 0.11, 0.14, and 0.20, respectively; with 30 and 3000 d, 0.09, 0.10, 0.12, and 0.15; and with 20 and 2000 d, 0.08, 0.08, 0.10, and 0.14.
Seasonal variation with multiple parasite entities
Fig. 8 shows the prevalence in humans of single-, double-, triple-, and quadruple-entity infections over a typical annual cycle, with a 6-mo high and 6-mo low season and the same parameter set as in Fig. 5. Using the same parameter set, Fig. 9 illustrates how the relationship between the observed and expected mean number of parasite entities per host varies with the length of the high season. Compared to the values expected under the binomial distribution, observed histograms for all high-season lengths display a deficit of single and double infections, and a surplus of negatives, triple, and quadruple infections. These results hold for all combinations of parameter values and season length, except those for which parasite-extinction frequencies exceed 90% (in which case the histograms are meaningless).
Fig. 8.

The time course of parasite prevalence, with the same parameter set and season length as in Fig. 5 but with four completely identical and independent parasite entities. The four lines (top to bottom) represent the third-year prevalence of infections with 1, 2, 3, or 4 entities; overall mean third-year prevalence with this parameter set and season length is 0.63.
Fig. 9.

A comparison of the observed third-year frequencies for multi-entity infections, across varying high-season lengths with the same parameter set as in Figs. 5 and 8, to the frequencies expected under the binomial distribution of four entities, each with mean prevalence equal to that of the corresponding single-entity results. Each bar represents a ratio of the observed to the expected mean number of entities per host, overall (including negatives) or among positives.
If considered only in terms of overall prevalence, the observed histograms of third-year multiple-entity frequencies conform to those expected on the basis of the corresponding single-entity means, with perennial or with seasonal vector population densities. If only hosts positive for at least one entity are considered, however, with seasonal transmission the mean number of parasite entities per positive host is significantly greater than that expected under the usual null hypothesis of independence among the entities. That is, infections are synchronized by seasonal fluctuation in transmission such that “excess” numbers of entities per host occur in the high season, and are balanced by “excess” negatives in the low season. With perennial vector populations of 500 or 5000, the mean number of parasite entities per positive host is slightly greater than that expected under the binomial distribution; with 500 the departure is significant, and arises from an accumulation of parasite entities in the oldest fraction of the mosquito population, as discussed elsewhere (McKenzie and Bossert 1997a, McKenzie et al. 1999).
Discussion
The general ecological principles associated with seasonality in vector-borne infections have rarely been discussed in such terms during the past 60 yr (Williams and Dye 1997). This omission should be corrected, particularly if it is true that amplitudes and frequencies of seasonal oscillation in malaria influence the incidence of severe childhood disease (Brewster and Greenwood 1993, Snow et al. 1994) and are themselves influenced by development schemes (Giglioli 1963, Mukiama and Mwangi 1989), human migrations (Woube 1997, Somboon et al. 1998), and climate change (Loevinsohn 1994, Bouma and Dye 1997).
Our results indicate that local threshold densities of Anopheles with respect to malaria extinction may indeed exist, as Ross suggested long ago, but also that these densities are unlikely to be independent of vector mortality, host infectivity and other critical factors within the transmission system. Similarly, threshold prevalences may exist within a transmission system, akin to Macdonald’s “basic reproduction rate” (1957), but these are likely to be mediated by the influence of host immunity on frequencies of reinfection, as well as by the frequencies of potentially infectious bites and by other factors. That is, it is no surprise to find that whatever circumstances produce a lower prevalence of an infectious disease may also produce a higher frequency of extinction in the causative pathogen, but our results remind us that there may be many different paths to and from a given prevalence, particularly with a vector-borne infection. Such paths and their implications are not always readily distinguishable by equilibrium analyses of wholly deterministic system dynamics.
Synchronization of infection by a seasonal pulse in mosquito density leads to prevalence rising well above the equilibrium level associated with perennial high transmission; the consequent synchronization of human immunity leads to prevalence falling well below the equilibrium level associated with perennial low transmission (Fig. 5). It is, of course, the latter that increases the risk of local extinction for the parasite population. However, seasonal synchronization of infection and immunity may also increase the frequencies of contact and potential interaction among parasite entities (Fig. 8), and hence of recombination among multiple compatible genotypes. Biases in the intrinsic dynamics of parasite diversity, such as those reflected here, are likely to affect statistical assessments of independence among entities that may be biologically interactive. With respect to the four Plasmodium species of human malaria, for example, our previous work indicates that the number of parasite entities present in a population may be less important in determining frequencies of mixed infections than the identity of those entities and the timing of their contact (Mason et al. 1999, McKenzie and Bossert 1999). Similar principles may hold for immunologically defined P. faleiparum phenotypes (Gilbert et al. 1998, Roper et al. 1998), and may have clinical ramifications (Mercereau-Puijalon 1996, Smith et al. 1999).
Our results confirm that seasonal transmission increases the influence of vector mortality on malaria prevalence, relative to perennial-transmission conditions and other factors considered (McKenzie et al. 1998). With respect to more definitive relationships between seasonality, vector density, prevalence, and parasite extinction, we caution that at this point our results with this model system are limited, and pertain only to extinctions observed during an initial 2-yr period and to mean prevalences in a third year. Nonetheless, it should be noted that in large areas within the malarious regions of the world prevalence may fall below the putative critical threshold; for instance, a recent summary reports median prevalence below 20% at nine of the 30 Kenyan districts from which cross-sectional malaria data were available (OmUmbo et al. 1998).
Our model does not yet address spatial aspects of malaria persistence. Hosts and vectors are mobile, their populations “patchy,” and their mixing heterogeneous. Some hosts seem to be bitten by vectors more frequently than others, for instance, and in this context Dye and Hasibeder (1986; Hasibeder and Dye 1988) found that stochastic effects become less influential, and chance extinction of infection less likely, with increased heterogeneity in host-vector contact.
Successful, sustainable interventions in malaria will require a deep understanding of the relative influence of each of a multitude of biological factors. These factors and their interactions are most conveniently represented by measurable parameters and outcomes in a formal model. This paper represents a step toward realism in the mosquito-dynamics component of our discrete-event malaria model, but a small step. The model still does not encompass any of the dynamic aspects of larval stages, adult mating, survivorship, feeding or oviposition, or more general inter- or intraspecific ecological, physiological, or behavioral differences among vector Anopheles (Gillies 1988, Muir 1988). It ignores seasonal effects on rates of parasite development in vectors (Beier 1998), and pretends that all vectors feeding on gametocytemic humans become infected, and, if sufficiently long-lived, carriers of infective sporozoites, though this is clearly not the case (Vaughan et al. 1992). It applies only to P. falciparum malaria; the existence of relapsing forms of Plasmodium v/vfljcadds significant complications to its transmission dynamics, for instance. The model has many such shortcomings, some of which can be addressed with our next step in model development, and some by our planned incorporation of models of within-host parasite and immune-system dynamics (McKenzie and Bossert 1997b, 1998). In the interim, however, we hope that this step will serve to refocus attention on the critical seasonal dynamics of malaria.
Seasonality is a pervasive influence in ecology, of course, even in the purportedly “aseasonal” tropics (MacArthur 1972, Krebs 1985). Phenology may be most familiar as an aspect of plant ecology (Fenner 1998), but it is also important in insect ecology (Grist and Gurney 1997), including the biological control of pest species (DeBach 1974). Seasonal variation can be a significant force in population regulation (Hamback 1998, Tkadlec and Zejda 1998, Hansen et al. 1999), sustainable harvesting (Kokko and Lindstrom 1998), predator-prey dynamics (Scheffer et al. 1997), and life history evolution (Hairston 1988). Increased risks of extinction with small population sizes are familiar, e.g., from studies of island biogeography (Pimm et al. 1988, Rosenzweig and Clark 1994), and are often evaluated in the context of species conservation (Soule 1987).
Seasonal density-dependent recruitment is widespread, and an enhanced risk of extinction related to synchronization a common property of stochastic population models. These observations have already been coupled in theoretical investigations relating extinction probabilities and environmentally driven fluctuations in population size; Nisbet and Gurney (1982) were “forced to conclude that virtually all ecologically useful models of extinction will include environmental variability.” A striking feature of our model is that local extinctions of the parasite arise spontaneously through seasonally driven interactions among parasite, vector, and host populations. It is the synchronization of infection histories in hosts, mediated by birth and death pulses in the vector population, that endangers the parasite; in this sense, it seems the parasite that is prey. There is certainly no shortage of analogous real-world circumstances in ecology, and we look forward to further theoretical and empirical insights from them. Given our particular focus, aware as we are of the many simplifications in our model and uncontrollable complications in the real world, our results indicate that mass malaria interventions should target moments of maximum advantage, namely seasons of maximum extinction risk for P. falciparum.
Acknowledgments
We gratefully acknowledge the contributions of G. Bentley, L. Blassingame, J. DeMoss, B. J. Foster, M. Gisko, N. Nicholas, R. M. Nisbet, B. C. Sorkin, J. Thein, and an anonymous reviewer. Some of this material is based on studies supported by the Maurice Pechet Foundation. Ellis McKenzie is supported by a NIH National Research Service Award, Gerry Killeen and John Beier by NIH grant U19-AI-45511.
APPENDIX A
Information about several relevant aspects of seasonal variation in P. falciparum malaria and vector Anopheles populations, shown through a series of figures that summarize published longitudinal data, is available in ESA’s Electronic Data Archive: Ecological Archives E082-028-A1.
APPENDIX B
Detailed information about discrete-event models of P. falciparum malaria available in previous papers (McKenzie et al. 1998, 1999), i.e., how these models depict the biology of parasite development in individual humans and mosquitoes, and corresponding interactions between humans and mosquitoes under perennial transmission, is available in ESA’s Electronic Data Archive: Ecological Archives E082-028-A2.
Literature Cited
- Anderson RM, May RM. Infectious diseases of humans. Oxford University Press; Oxford, UK: 1991. [Google Scholar]
- Aron JL, May RM. The population dynamics of malaria. In: Anderson RM, editor. Population dynamics of infectious diseases. Chapman and Hall; London, UK: 1982. pp. 139–179. [Google Scholar]
- Beier JC. Malaria parasite development in mosquitoes. Annual Review of Entomology. 1998;43:519–543. doi: 10.1146/annurev.ento.43.1.519. [DOI] [PubMed] [Google Scholar]
- Bouma MJ, Dye C. Cycles of malaria associated with El Nino in Venezuela. Journal of the American Medical Association. 1997;278:1772–1774. [PubMed] [Google Scholar]
- Brewster DR, Greenwood BM. Seasonal variation of paediatric diseases in the Gambia, West Africa. Annals of Tropical Paediatrics. 1993;13:133–146. doi: 10.1080/02724936.1993.11747637. [DOI] [PubMed] [Google Scholar]
- DeBach P. Biological control by natural enemies. Cambridge University Press; London, UK: 1974. [Google Scholar]
- Dye C, Hasibeder G. Population dynamics of mosquito-borne disease: effects of flies which bite some people more frequently than others. Transactions of the Royal Society of Tropical Medicine and Hygiene. 1986;80:69–77. doi: 10.1016/0035-9203(86)90199-9. [DOI] [PubMed] [Google Scholar]
- Dye C, Williams BG. Non-linearities in the dynamics of indirectly-transmitted infections (or, does having a vector make a difference?) In: Grenfell BT, Dobson AP, editors. Ecology of infectious diseases in natural populations. Cambridge University Press; Cambridge, UK: 1995. pp. 260–279. [Google Scholar]
- Fenner M. The phenology of growth and reproduction in plants. Perspectives in Plant Ecology, Evolution and Systematics. 1998;1:78–91. [Google Scholar]
- Giglioli G. Ecological change as a factor in renewed malaria transmission in an eradicated area. Bulletin of the World Health Organization. 1963;29:131–145. [PMC free article] [PubMed] [Google Scholar]
- Gilbert SC, Plebanski M, Gupta S, Morris J, Cox M, Aidoo M, Kwiatkowski D, Greenwood BM, Whittle HC, Hill AVS. Association of malaria parasite population structure, HLA, and immunological antagonism. Science. 1998;279:1173–1177. doi: 10.1126/science.279.5354.1173. [DOI] [PubMed] [Google Scholar]
- Gill CA. The seasonal periodicity of malaria and the mechanism of the epidemic wave. J. & A. Churchill; London, UK: 1938. [Google Scholar]
- Gillies MT. Anopheline mosquitoes: vector behaviour and bionomics. In: Wernsdorfer WH, McGregor I, editors. Malaria. Churchill Livingstone; Edinburgh, UK: 1988. pp. 453–486. [Google Scholar]
- Gotelli NJ. A primer of ecology. Sinauer Associates; Sunderland, Massachusetts, USA: 1998. [Google Scholar]
- Grenfell BT, Bolker BM, Kleczkowski A. Seasonality and extinction in chaotic metapopulations. Proceedings of the Royal Society of London. 1995;B259:97–103. [Google Scholar]
- Grist EPM, Gurney WSC. Seasonal synchronicity and stage-specific life cycles: Topp’s beetles revisited. Mathematical Biosciences. 1997;145:1–25. doi: 10.1016/s0025-5564(97)00016-3. [DOI] [PubMed] [Google Scholar]
- Hackett LW. Malaria in Europe: an ecological study. Oxford University Press; London, UK: 1937. [Google Scholar]
- Haight FA. Handbook of the Poisson distribution. John Wiley; New York, New York, USA: 1967. [Google Scholar]
- Hairston NG., Jr Interannual variation in seasonal predation: its origin and ecological importance. Limnology and Oceanography. 1988;33:1245–1253. [Google Scholar]
- Hamback PA. Seasonality, optimal foraging, and prey coexistence. American Naturalist. 1998;152:881–895. doi: 10.1086/286215. [DOI] [PubMed] [Google Scholar]
- Hansen TF, Stenseth NC, Henttonen H. Multiannual vole cycles and population regulation during long winters: an analysis of seasonal density dependence. American Naturalist. 1999;154:129–139. doi: 10.1086/303229. [DOI] [PubMed] [Google Scholar]
- Hasibeder G, Dye C. Population dynamics of mosquito-borne disease: persistence in a completely heterogeneous environment. Theoretical Population Biology. 1988;33:31–53. doi: 10.1016/0040-5809(88)90003-2. [DOI] [PubMed] [Google Scholar]
- Kokko H, Lindstrom J. Seasonal density dependence, timing of mortality, and sustainable harvesting. Ecological Modelling. 1998;110:293–304. [Google Scholar]
- Krebs CJ. Ecology. Harper and Row; New York, New York, USA: 1985. [Google Scholar]
- Loevinsohn ME. Climatic warming and increased malaria incidence in Rwanda. Lancet. 1994;343:714–717. doi: 10.1016/s0140-6736(94)91586-5. [DOI] [PubMed] [Google Scholar]
- MacArthur RH. Geographical Ecology. Harper and Row; New York, New York, USA: 1972. [Google Scholar]
- Macdonald G. Epidemiological basis of malaria control. Bulletin of the World Health Organization. 1956;15:613–626. [PMC free article] [PubMed] [Google Scholar]
- Macdonald G. The epidemiology and control of malaria. Oxford University Press; London, UK: 1957. [Google Scholar]
- Mason DP, McKenzie FE, Bossert WH. The blood-stage dynamics of mixed Plasmodium malariae-Plasmodium falciparum infections. Journal of Theoretical Biology. 1999;198:549–566. doi: 10.1006/jtbi.1999.0932. [DOI] [PubMed] [Google Scholar]
- McKenzie FE, Bossert WH. Mixed-species Plasmodium infections of Anopheles (Diptera: Culicidae) Journal of Medical Entomology. 1997a;34:417–425. doi: 10.1093/jmedent/34.4.417. [DOI] [PMC free article] [PubMed] [Google Scholar]
- McKenzie FE, Bossert WH. The dynamics of Plasmodium falciparum blood-stage infection. Journal of Theoretical Biology. 1997b;188:127–140. doi: 10.1006/jtbi.1997.0478. [DOI] [PubMed] [Google Scholar]
- McKenzie FE, Bossert WH. The optimal production of gametocytes by Plasmodium falciparum. Journal of Theoretical Biology. 1998;193:419–428. doi: 10.1006/jtbi.1998.0710. [DOI] [PubMed] [Google Scholar]
- McKenzie FE, Bossert WH. Multispecies Plasmodium infections of humans. Journal of Parasitology. 1999;85:12–18. [PMC free article] [PubMed] [Google Scholar]
- McKenzie FE, Wong RC, Bossert WH. Discrete-event simulation models of Plasmodium falciparum malaria. Simulation. 1998;71:250–261. doi: 10.1177/003754979807100405. [DOI] [PMC free article] [PubMed] [Google Scholar]
- McKenzie FE, Wong RC, Bossert WH. Discrete-event models of mixed-phenotype Plasmodium falciparum malaria. Simulation. 1999;73:213–217. doi: 10.1177/003754979907300403. [DOI] [PMC free article] [PubMed] [Google Scholar]
- Mercereau-Puijalon O. Revisiting host/parasite interactions: molecular analysis of parasites collected during longitudinal and cross-sectional surveys in humans. Parasite Immunology. 1996;18:173–180. doi: 10.1046/j.1365-3024.1996.d01-79.x. [DOI] [PubMed] [Google Scholar]
- Muir DA. Anopheline mosquitoes: vector reproduction, life-cycle and biotope. In: Wernsdorfer WH, McGregor I, editors. Malaria. Churchill Livingstone; Edinburgh, UK: 1988. pp. 43 1–452. [Google Scholar]
- Mukiama TK, Mwangi RW. Seasonal population changes and malaria transmission potential of Anopheles pharoensis and the minor anophelines in Mwea Irrigation Scheme, Kenya. Acta Tropica. 1989;46:181–190. doi: 10.1016/0001-706x(89)90035-1. [DOI] [PubMed] [Google Scholar]
- Nisbet RM, Gurney WSC. Modelling fluctuating populations. John Wiley and Sons; Chichester, UK: 1982. [Google Scholar]
- Omumbo J, Ouma J, Rapuoda B, Craig MH, le Sueur D, Snow RW. Mapping malaria transmission intensity using geographical information systems (GIS): an example from Kenya. Annals of Tropical Medicine and Parasitology. 1998;92:7–21. doi: 10.1080/00034989860120. [DOI] [PubMed] [Google Scholar]
- Pimm SL, Jones HL, Diamond J. On the risk of extinction. American Naturalist. 1988;132:757–785. [Google Scholar]
- Roper C, Richardson W, Elhassan IM, Giha H, Hviid L, Satti GMH, Theander TG, Arnot DE. Seasonal changes in the Plasmodium falciparum population in individuals and their relationship to clinical malaria: a longitudinal study in a Sudanese village. Parasitology. 1998;116:501–510. doi: 10.1017/s0031182098002650. [DOI] [PubMed] [Google Scholar]
- Rosenzweig ML, Clark CW. Island extinction rates from regular censuses. Conservation Biology. 1994;8:491–494. [Google Scholar]
- Ross R. Studies on malaria. John Murray; London, UK: 1928. [Google Scholar]
- Scheffer M, Rinaldi S, Kuznetsov YA, Van Nes EH. Seasonal dynamics of Daphnia and algae explained as a periodically forced predator-prey system. Oikos. 1997;80:519–532. [Google Scholar]
- Smith T, Felger I, Beck H-P, Tanner M. Consequences of multiple infection with Plasmodium falciparum in an area of high endemicity. Parassitologia. 1999;41:247–250. [PubMed] [Google Scholar]
- Snow RW, I, de Azevedo B, Lowe BS, Kabiru EW, Nevill CG, Mwankusye S, Kassiga G, Marsh K, Teuscher T. Severe childhood malaria in two areas of markedly different falciparum transmission in East Africa. Acta Tropica. 1994;57:289–300. doi: 10.1016/0001-706x(94)90074-4. [DOI] [PubMed] [Google Scholar]
- Somboon P, Aramrattana A, Lines J, Webber R. Entomological and epidemiological investigations of malaria transmission in relation to population movements in forest areas of north-west Thailand. Southeast Asian Journal of Tropical Medicine and Public Health. 1998;29:3–9. [PubMed] [Google Scholar]
- Soule ME, editor. Viable populations for conservation. Cambridge University Press; Cambridge, UK: 1987. [Google Scholar]
- Tkadlec E, Zejda J. Small rodent population fluctuations: the effects of age structure and seasonality. Evolutionary Ecology. 1998;12:191–210. [Google Scholar]
- Vaughan JA, Noden BH, Beier JC. Population dynamics of Plasmodium falciparum sporogony in laboratory-infected Anopheles gambiae. Journal of Parasitology. 1992;78:716–724. [PubMed] [Google Scholar]
- Williams BG, Dye C. Infectious disease persistence when transmission varies seasonally. Mathematical Biosciences. 1997;145:77–88. doi: 10.1016/s0025-5564(97)00039-4. [DOI] [PubMed] [Google Scholar]
- Woube M. Geographical distribution and dramatic increases in incidences of malaria: consequences of the resettlement scheme in Gainbela, SW Ethiopia. Indian Journal of Malariologv. 1997;34:140–163. [PubMed] [Google Scholar]