

Abstract
A novel method for monitoring proton-deuteron (H/D) exchange at backbone amides is based on the observation of H/D isotope effects on the 13C NMR signals from peptide carbonyls. The line shape of the carbonyl 13Ci signal is influenced by differential H/D occupancy at the two adjacent amides: the HNi+1 (β-site) and the HNi (γ-site). At a carbon frequency of 75.4 MHz, the H→D isotope shifts on the 13C signal are about 5–7 Hz for exchange at the β-site and 2 Hz or less for exchange at the γ-site. Since the effects at the two sites are additive, the time-dependence of the line shape of a particular carbonyl resonance can report not only the exchange rates at the individual sites, but also the level of dual exchange. Therefore, the data can be analyzed to determine the rate (kc) and degree of correlated exchange (Xβγ) at the two sites. We have applied this approach to the investigation of the pH dependence of hydrogen exchange at several adjacent residues in Streptomyces subtilisin inhibitor (SSI). Two selectively labeled SSI proteins were produced: one with selective 13C′ labeling at all valyl residues and one with selective 13C′ labeling at all leucyl residues. This permitted the direct observation by one-dimensional 13C NMR of selected carbonyl signals from residues with slowly exchanging amides at the i and i+1 positions. The residues investigated were located in an α-helix and in a five-stranded antiparallel β-sheet. Samples of the two labeled proteins were prepared at various pH*values, and 13C NMR spectra were collected at 50 °C prior to and at various times subsequent to transferring the sample from H2O to 2H2O. Most of the slowly exchanging amides studied were intramolecular hydrogen bond donors. In agreement with prior studies, the results indicated that the exchange rates of the amide hydrogens in proteins are governed not only by hydrogen bonding, but also by other factors. For example, the amide hydrogen of Thr34 exchanges rapidly even though it is an intramolecular hydrogen bond donor. Over nearly the whole pH range studied, the apparent rates of uncorrelated exchange (kβ and kγ) were proportional to [OH−], and the apparent rates of correlated exchange at two adjacent sites (kc) were roughly proportional to [OH−]2. This enabled us to extract the pH-independent exchange rates (kβ°, kγ°, and kc°). In all cases in which correlated exchange could be measured, the observed sigmoidal pH-dependence of Xβγ could be replicated roughly from the derived pH-independent rates.
Keywords: Streptomyces subtilisin inhibitor, SSI, carbonyl 13C NMR, stable isotope assisted NMR, H/D exchange, amide hydrogen, isotope shift, β-shift, γ-shift, correlated hydrogen exchange
The internal fluctuations of protein molecules are deeply related to their structure and stability and contribute to their functions. Protein fluctuations have been studied extensively by many methods (1). One of the most important approaches has been to measure exchange rates of labile hydrogens, including the backbone amide hydrogens (2). A wide variety of studies have reported the use of these hydrogens as structural probes (3, 4). Hydrogen exchange also has been used to detect intermediates during protein folding (5, 6, 7, 8) or interactions between proteins and other molecules (9, 10, 11). The exchange rates of the backbone amide hydrogens have been measured by many methods, such as ultraviolet spectroscopy (12) and infrared spectroscopy (13, 14), without regard to their location in proteins. Advances in high-resolution NMR1 spectroscopy have enabled the measurement of exchange rates of individual amide hydrogens in a site-specific manner (15, 16). Thus, it has become possible to obtain detailed information about the dynamic structure of proteins. Exchange occurs not only at amides located near the surface of the protein molecule but also at those fully buried in the interior of protein, even though they appear to be inaccessible to solvent molecules in static structural models derived from X-ray crystallography or NMR spectroscopy (17). The exchange rates of amide hydrogens in proteins are often very slow, and it is not uncommon for the rates to be reduced by several orders of magnitude, as compared to those of free small peptides. In order to explain the remarkable reduction of the exchange rates, several factors have been proposed, such as hydrogen bonding, the effect of secondary structures, the depth from the surface of the protein molecule, the solvent accessibility, and so on. All of these factors are important, but none of them is definitive; therefore, the reasons for the slower exchange rates are still unclear (18). It is important to consider the mechanisms of exchange in studying relationship between internal fluctuations and the amide hydrogen exchange rates. The proposed models for exchange may be divided in two general categories: the solvent penetration model (19) or expansile cavity model (20), and the local unfolding model (21, 22). The former does not easily explain the correlated exchange of the amide hydrogens, which is observed under certain conditions. Correlated exchange requires a large conformational change, almost to the point of denaturation, and such global unfolding has been reported in some cases (23, 24, 25). Internal motions, such as global unfolding, have been studied indirectly by the pH dependence of the exchange rates; however, more details can be obtained if correlated exchange is detected directly. Correlated exchange of the amide hydrogens in the β-sheet of BPTI was detected by measuring NOEs observed between pairs of amide hydrogens, as a function of the extent of H/D exchange (23, 26). Miranker et al. (27) applied electrospray ionization mass spectrometry to lysozyme, to distinguish the exchange mechanisms from the line shapes of the molecular ion peaks caused by partial deuteration. In addition, a method has been reported for determining the exchange mechanism from mass spectrometric identification of the distribution of the molecular weights of enzymatic fragments of a protein undergoing H/D exchange (28).
In this paper, we report a new method for the measurement of amide hydrogen exchange rates and correlated exchange occurring at adjacent residues. The method utilizes selective 13C labeling and direct 13C signal detection (29, 30, 31). The approach takes advantage of isotope effects from the neighboring amide hydrogens on the carbonyl 13C chemical shift (32). H/D exchange at two amide hydrogens, HNi+1 (β-site) and HNi (γ-site), can induce isotope effects on the carbonyl carbon resonance of the ith residue (Figure 1). When a protein prepared in H2O is dissolved in 2H2O, the amide protons will start to exchange with deuterons. The chemical shift of the carbonyl 13C NMR resonance moves to a higher field, when the neighboring amide proton is replaced with deuteron. The typical H/D isotope effects at 75.4 MHz are 5–7 Hz for the β-shift and 2 Hz or less for γ-shift (30, 33). Since the isotope effects from the neighboring amide hydrogens have different values, up to four peaks can be observed for each carbonyl carbon. These peaks are derived from the isotopomers, which have different combinations of protons (H) and/or deuterons (D) at the two sites (Figure 2). These species are represented by [H,H], [D,H], [H,D], and [D,D], in which the first and second letters in the brackets indicate the isotopes occupying the γ- and β-sites, respectively. Under conditions of slow exchange, the populations of the four species can be derived from their respective peak areas, and the method can be used to determine not only the exchange rates at the individual β- and γ-sites but also the rate of correlated exchange at the two sites. Under intermediate or fast exchange conditions, the line shape no longer provides separate information about the four sites.
Figure 1.

H/D exchange at positions i (γ-site) and i+1 (β-site) can lead to isotope effects on the NMR chemical shift of the carbonyl carbon 13Ci. Typical values of these isotope effects at 75.4 MHz are 5–6 Hz for H/D exchange at the β-site and about 2 Hz for H/D exchange at the γ-site (30, 36).
Figure 2.

Simulated line shape of for carbonyl carbon resonance 13C′i with partially-exchanged neighboring amide hydrogens at positions i and i+1. The four peaks originate from various [i, i+1] isotopomers: from left-to-right [H,H], [D,H], [H,D] and [D,D]. The simulation assumed slow exchange on the chemical shift time scale, β-shift = 6 Hz, γ-shift = 2 Hz, and line width = 1 Hz.
We have applied this method to the investigation of the pH-dependence of H/D exchange in Streptomyces subtilisin inhibitor (SSI). SSI is a homodimeric serine protease inhibitor (23 kDa for the dimer). The two subunits of SSI face one other, with a five-stranded β-sheet at the interface. The dimeric structure of SSI is very stable; the dissociation constant to the monomers is estimated to be below 5×10⁻⁷ M at pH = 7 (34). The structural and functional features of SSI have been studied by many methods (35). SSI is known to have remarkably slowly exchanging amide hydrogens (24, 36) that are amenable to study by observation of the 13C NMR signals from samples labeled selectively by incorporation of [13C′-Leu] or [13C′-Val]. The slowly exchanging amide hydrogens of SSI were found to be concentrated on the 5-stranded β-sheet. We report here the pH dependence of non-correlated and correlated H/D exchange at six adjacent residues in SSI. In addition, we have investigated non-correlated exchange at another four adjacent residues in SSI.
MATERIALS AND METHODS
When a protein sample prepared in H2O is dissolved in 2H2O, adjacent amide protons exchange to deuterons according to the pathway,
 |
(1) |
If a large excess of 2H2O is present, then the reverse reaction will be negligible. In eq.1, kβ′ and kγ′ are the exchange rate constants for the β- and γ-sites in the process whereby amide hydrogens exchange independently and never simultaneously. In the correlated exchange process, characterized by the rate constant kc, both the β- and γ-sites exchange “simultaneously” (during the same unfolding step). Species [D,H] and [H,D] are only produced in a stochastic manner, but [D,D] is produced not only by two sequential stochastic process but also by the correlated process. In this way, the time-dependence of the four species can be analyzed to yield the uncorrelated exchange rates of the neighboring amide hydrogens (kβ and kγ) and the rate of correlated exchange at the two adjacent sites (kc). The rate constant kc accounts for the excess build-up of [D,D] that cannot be accounted by the sum (kβ + kγ).
The time-dependence of the populations of the four species can be expressed as,
| (2) |
| (3) |
| (4) |
| (5) |
where [H,H]0 is the initial population of the [H,H] species. These equations represent the behavior of populations of the four species completely. In the actual analysis, these equations are integrated by the accumulation period. The apparent exchange rate constants of the β- and γ-sites are represented by
| (6) |
| (7) |
The fraction of H/D exchange at the β- and γ-sites occurring by the correlated mechanism, Xβγ, is defined by
| (8) |
with 0 ≤ Xβγ ≤ 1. The limiting case of Xβγ = 0 means that no correlated exchange occurred, and Xβγ = 1 indicates that all of the exchange occurred in a correlated manner.
Preparation of isotopically labeled amino acids and SSIs
[1-13C]-DL-leucine and [1-13C]-DL-valine were prepared from Na13CN and isovaleraldehyde and isobutyraldehyde, respectively, by Bucherer’s method. The 13C labeled SSIs were prepared by aerobic fermentation of Streptomyces albogriseolus S-3253, obtained from Prof. Murao at Osaka Prefectural University, in medium containing an amino acid mixture in which the desired normal amino acid was replaced by the isotopically labeled one as has been described in a previous paper (29).
13C NMR spectroscopy
All 13C NMR spectra were recorded on a Varian XL-300 spectrometer at a 13C frequency of 75.4 MHz under the condition of full 1H decoupling by MLRV16. The time-dependent amide hydrogen exchange experiments were carried out as follows. Lyophilized labeled SSI (20 mg) was dissolved in 0.5 mL of water, and the pH was adjusted by adding small amounts of dilute HCl or NaOH. After incubation for 1 h at 60 °C, the pH value was confirmed. If the meter reading was considerably different from the desired value, then the pH was readjusted. Then, the solution was lyophilized. The sample was dissolved in 0.5 mL of 2H2O at 0 °C as rapidly as possible, with avoidance of moisture, and then 13C NMR spectra were collected at 50 °C as a function of time. The pH* value of each sample were measured just before and after the NMR measurement to confirm that it had not changed significantly. The delay in collecting the first data set for each sample was about 10 min. The spectral width (about 1 kHz) covered only the carbonyl region, and 4 k of time-domain data were collected. Each time-domain data set was the average of 1024 FID transients, and the accumulation time was 34 min. All data sets were subjected to a 0.5 Hz line broadening function and were Fourier transformed to yield a spectrum consisting of 8 k data points. Data were collected until the intensities of the [H,H] and [D,D] peaks were almost equal.
Determination of the exchange rate constants and the fraction of correlated exchange
The exchange rate constants kβ′, kγ′, and kc were determined from total line-shape analysis by the nonlinear least squares method. In the analysis, we made three, generally-accepted assumptions: 1) the exchange to deuteron from hydrogen does not reverse, since there is a large excess of 2H2O over H2O; 2) the lifetimes of the four isotopomeric species are sufficiently long, relative to the NMR time scale, that the chemical shifts and the line widths are independent of the exchange rates; and 3) the line shapes of the resonances are Lorentzian. In order to carry out the line shape analysis, subspectra containing only one or two (if the signals overlapped) carbonyl resonances were extracted from a time series of 13C NMR spectra. In most cases, each time point represented the summation over an appropriate time interval for obtaining a high signal to noise ratio. The resonance lines were fitted by Lorentzian functions, and the intensities of the four species were calculated by time averaging, from eq. 2 to eq. 5. Namely, the fitting functions are represented as follows.
| (9) |
| (10) |
| (11) |
| (12) |
The above lines of each species indicate the time averaged concentrations for the accumulation period (Δt). The chemical shifts and the line widths were fixed in the calculation. The nonlinear least square program, which used the modified Marquardt method (37), was written in BASIC language and run on a personal computer. The exchange rates and the degrees of correlation on the γ- and β-sites were calculated from eq.6 to eq.8.
RESULTS
Amide hydrogen exchange rates and the degree of correlation in SSI
Typical results from H/D investigations of [L]SSI and [V]SSI are shown in Figure 3. The assignments of these carbonyl resonances (residue numbers shown at the bottom of the figure) were determined primarily by the 15N-13C double labeling method (29). The details of the assignments will be reported elsewhere. Residues were classified into three groups on the basis of the time-dependence of their 13C′i signals. The first group constituted residues that showed no time-dependent spectral changes: Leu6, Val20, Val56, Leu60, Leu63, Val69, Val74, and Val110. The 13C′ chemical shifts of these residues did not change even when the sample was incubated for 1 h at 60 °C, and therefore both of the neighboring amide hydrogens of these carbonyl carbons had exchanged fully to equilibrium before the first spectrum was recorded. The second group included Val31, Leu33, Leu53, Val91, and Val96. The signals from these residues were observed as two peaks during the exchange process. The respective chemical shift differences for these peaks were 2.6 Hz, 3.2 Hz, 7.0 Hz, 2.2 Hz, and 6.1 Hz. The larger values for Leu53 and Val96 were indicative of the β-shift, and the others were indicative of the γ-shift. In this group, the only time-dependent effect arose from the amide hydrogen with the slow exchange rate, since the other exchange was too fast to detect. All of these amide hydrogens, except for Leu53, are located on the edges of a β-sheet in SSI, and those at the γ- and β-sites do not participate in intramolecular hydrogen bonds. Although the amide hydrogens of both Leu33 and Thr34 form hydrogen bonds in the β-sheet, that from Thr34 exchanges very rapidly for reasons discussed in detail in the following section. The third group, which included the 13C′ signals from Val13, Val16, Val31, Val78, Val85, and Leu80, displayed four peaks during the exchange. Since both of the neighboring amide hydrogens of these carbonyl carbons exchanged slowly, they allowed the measurement of both the uncorrelated and correlated exchange rates. All of these slowly exchanging amide hydrogens are located in the antiparallel 5-stranded β-sheet of SSI. The observed values of the β-and γ-shifts are summarized in Table 1. At 75.4 MHz the magnitudes of the β-shifts were about 6 to 7 Hz, and the γ-shifts were 2 Hz or less. We also found that the magnitudes of these isotope shifts were independent of pH* in the range from 6 to 10.
Figure 3.

Time dependence of 75.4 MHz 13C NMR spectra of selectively labeled SSI samples at pH* 7.4 at various times following transfer of the protein from H2O to 2H2O: (A): [L]SSI and (B): [V]SSI. The temperature of the samples was kept at 50 °C. Each spectrum represents the accumulation of 4096 transients of FID signals for 2.26 h. The 13C′ resonance assignments are indicated by residue numbers at the bottom. Some of the resonances exhibited time-dependent spectral changes. The decrease in the peaks of [H,H] and the increase in the peaks of [D,D] are represented by broken and straight lines, respectively.
Table 1.
The β- and γ-shift values for selected 13C′ resonances in [L]SSI and [V]SSI.
| Residue | β-shift (Hz) | γ-shift (Hz) |
|---|---|---|
| Val13 | 6.1 | 2.5 |
| Val16 | 6.1 | 1.9 |
| Val31 | n.d. | 2.6 |
| Leu33 | n.d. | 3.2 |
| Leu53 | 7.0 | n.d. |
| Val78 | 6.6 | 1.9 |
| Leu80 | 6.5 | 1.6 |
| Val82 | 7.1 | 2.9 |
| Val85 | 6.1 | 2.3 |
| Val91 | n.d. | 2.2 |
| Val96 | 6.1 | n.d. |
All of the data were collected on a Varian XL-300 spectrometer (13C frequency of 75.4 MHz) under the conditions of pH* 7.3 at 50 °C. These isotope shifts were found to be independent of pH* in the range from 6 to 10. The notation “n.d.” indicates that the isotope shift was not detected.
In order to determine the exchange rates quantitatively, a total line shape analysis was carried out. In the case of the resonances in which both of the isotope effects were observed, the exchange rates were determined, as described below. A typical example is shown in Figure 4. The thick line shows the observed spectrum of Val85 at 50 °C and pH* 7.8. In this case, the spectrum was obtained by summing from the first to the 18th subspectrum. Since each subspectrum was accumulated for 0.57 h, the accumulation period was 10.26 h. An initial dead time of 0.17 h was needed, for instrumentation preparation, such as probe tuning and shimming. The line shape analysis was carried out using eq. 9 to eq. 12 with kβ′ = 0.1 min−1, kγ′ = 0.1 min−1 and kc = 0.1 min−1 as the initial values, and the values of the β- and γ-shifts and the line widths of the four species were fixed as 6.1 Hz, 2.3 Hz and 8.3 Hz, respectively. These fixed values were estimated from the summed spectrum and were finally determined by trial and error with the calculations. The baseline was corrected by a straight line. Since the convergences of the fitting calculation to the observed spectra were fast and stable after a few iterations, the initial values could be roughly estimated. We confirmed that several choices of appropriate initial values converged to the same values within the calculation errors. The broken line indicates the calculated spectrum, and the solid lines represent the individual [H,H], [D,H], [H,D] and [D,D] species. The results are summarized in Table 2.
Figure 4.

Line shape analysis of the carbonyl resonance of Val85 of SSI acquired at 75.4 MHz at 50 °C and pH* = 7.8. The thick line represents the observed signal, which was accumulated for 10.26 h. The thin continuous lines indicate the signals corresponding to the four [i, i+1] isotopomers: from left to right, [H,H], [D,H], [H,D], and [D,D]. The fitted spectrum obtained by adding the four subspectra is represented by the broken line. One division of the axis shows 10 Hz. The line shape analysis was carried out with the constant values of 6.1 Hz, 2.3 Hz, and 8.3 Hz for the β-shift, γ-shift, and line width, respectively. The exchange rates determined by using appropriate initial values were: kβ′ = 2.30×10⁻³ min−1, kγ′ = 1.63×10⁻³ min−1, and kc = 6.38×10⁻⁴ min−1. (See text for details).
Table 2.
H/D exchange at selected sites in SSI 50 °C: apparent rates of backbone amide hydrogen exchange at residues i and i+1 (kγ and kβ, respectively), apparent rates of correlated exchange at the two sites (kc), and fraction of exchange occurring by the correlated mechanism (Xβγ).
| Residue i | pH* | kβ(min−1) apparent rate of exchange by the non-correlated mechanism at residue i+1 | kγ(min−1) apparent rate of exchange by the non-correlated mechanism at residue i | kC (min−1) apparent rate of correlated exchange | Xβγ fraction of exchange occurring by the correlated mechanism |
|---|---|---|---|---|---|
| Val13 | 7.4 | 1.40×10⁻³ | 2.72×10⁻⁴ | 2.48×10⁻⁴ | 0.30 |
| 7.8 | 2.84×10⁻³ | 1.00×10⁻³ | 8.92×10⁻⁴ | 0.46 | |
| 8.6 | 9.27×10⁻³ | 5.27×10⁻³ | 4.57×10⁻³ | 0.63 | |
| 9.1 | 8.52×10⁻³ | 5.45×10⁻³ | 4.20×10⁻³ | 0.60 | |
| 9.5 | 1.03×10⁻² | 1.04×10⁻³ | 7.55×10⁻³ | 0.73 | |
|
| |||||
| Val16 | *7.4 | 3.25×10⁻³ | 7.18×10⁻³ | 1.08×10⁻¹¹ | 0.00 |
| 7.8 | 6.22×10⁻³ | 2.49×10⁻³ | 6.70×10⁻⁴ | 0.15 | |
| 8.6 | 7.98×10⁻³ | 4.70×10⁻³ | 2.38×10⁻³ | 0.38 | |
| 9.1 | 1.20×10⁻² | 6.08×10⁻³ | 2.72×10⁻³ | 0.30 | |
|
| |||||
| †Val31 | 6.1 | 3.20×10⁻³ | |||
| 7.4 | 1.19×10⁻³ | ||||
| 7.8 | 1.65×10⁻³ | ||||
| 8.6 | 3.97×10⁻³ | ||||
| 9.1 | 9.20×10⁻³ | ||||
| 9.5 | 1.07×10⁻² | ||||
|
| |||||
| †Leu33 | 7.3 | 1.82×10⁻³ | |||
| 8.0 | 3.72×10⁻³ | ||||
| 9.2 | 3.48×10⁻³ | ||||
| 9.4 | 5.18×10⁻³ | ||||
| 10.0 | 2.25×10⁻² | ||||
|
| |||||
| †Leu53 | 6.1 | 5.87×10⁻³ | |||
|
| |||||
| Val78 | 6.1 | 6.21×10⁻⁵ | 2.00×10⁻⁵ | 7.30×10⁻⁶ | 0.18 |
| 7.4 | 2.53×10⁻⁴ | 7.87×10⁻⁵ | 3.33×10⁻⁵ | 0.20 | |
| 7.8 | 3.79×10⁻⁴ | 1.62×10⁻⁴ | 8.93×10⁻⁵ | 0.33 | |
| 8.6 | 1.27×10⁻³ | 9.55×10⁻⁴ | 4.49×10⁻⁴ | 0.40 | |
| 9.1 | 3.00×10⁻³ | 1.76×10⁻³ | 1.13×10⁻³ | 0.48 | |
| 9.5 | 8.88×10⁻³ | 6.86×10⁻³ | 5.83×10⁻³ | 0.74 | |
| 10.1 | 1.90×10⁻² | 1.17×10⁻² | 1.05×10⁻² | 0.69 | |
|
| |||||
| Leu80 | 6.1 | 3.38×10⁻⁴ | 1.11×10⁻⁴ | 6.63×10⁻⁵ | 0.30 |
| *7.3 | 8.02×10⁻⁴ | 1.68×10⁻³ | 3.27×10⁻¹¹ | 0.00 | |
| 8.0 | 1.77×10⁻³ | 1.79×10⁻³ | 5.35×10⁻⁴ | 0.30 | |
| *9.4 | 6.85×10⁻³ | 4.80×10⁻³ | 4.80×10⁻³ | 0.82 | |
| 10.0 | 1.05×10⁻² | 6.73×10⁻³ | 6.73×10⁻³ | 0.78 | |
|
| |||||
| Val82 | 6.1 | 2.78×10⁻⁴ | 2.53×10⁻⁴ | 2.80×10⁻⁵ | 0.11 |
| 7.4 | 1.10×10⁻³ | 1.15×10⁻³ | 3.52×10⁻⁵ | 0.03 | |
| 7.8 | 2.13×10⁻³ | 2.44×10⁻³ | 1.03×10⁻³ | 0.45 | |
| 8.6 | 3.35×10⁻³ | 4.05×10⁻³ | 2.75×10⁻³ | 0.74 | |
| 9.1 | 6.30×10⁻³ | 8.07×10⁻³ | 5.37×10⁻³ | 0.75 | |
| 9.5 | 9.36×10⁻³ | 9.56×10⁻³ | 8.25×10⁻³ | 0.87 | |
|
| |||||
| Val85 | 6.1 | 3.71×10⁻⁴ | 2.78×10⁻⁴ | 7.08×10⁻⁵ | 0.22 |
| 7.4 | 1.37×10⁻³ | 1.06×10⁻³ | 4.12×10⁻⁴ | 0.34 | |
| 7.8 | 2.94×10⁻³ | 2.27×10⁻³ | 6.38×10⁻⁴ | 0.25 | |
| 8.6 | 7.17×10⁻³ | 5.80×10⁻³ | 2.08×10⁻³ | 0.32 | |
| 9.1 | 1.66×10⁻² | 2.54×10⁻² | 8.37×10⁻³ | 0.40 | |
|
| |||||
| †Val91 | 7.4 | 1.43×10⁻³ | |||
| 7.8 | 3.62×10⁻³ | ||||
| 8.6 | 7.77×10⁻³ | ||||
| 9.1 | 1.39×10⁻² | ||||
| 9.5 | 9.63×10⁻² | ||||
|
| |||||
| †Val96 | 7.8 | 1.66×10⁻³ | |||
| 8.6 | 3.28×10⁻³ | ||||
| 9.1 | 7.03×10⁻³ | ||||
| 9.5 | 1.03×10⁻² | ||||
These data may contain relatively large errors, because the S/N ratios of the observed resonances were low.
These data were analyzed by a two-site exchange model to determine the apparent exchange rates; since one of the isotope effects was not observed due to fast exchange it was not possible to measure correlated exchange at these sites.
Since the carbonyl resonances of Val31, Leu33, Leu53, Val91, and Val96 displayed only one of the isotope effects, their signals were analyzed by the two-site exchange model, which yielded one apparent exchange rate constant, kobs (Table 2 and Figure 6). Since the carbonyl resonances of Leu12, Leu14, and Leu79 were heavily overlapped, we were unable to determine the exchange rates of these amide hydrogens. The logarithms of the apparent exchange rates (log kβ and log kγ) and the fraction of correlated exchange (Xβγ) are plotted as a function of pH* in Figure 5.
Figure 6.
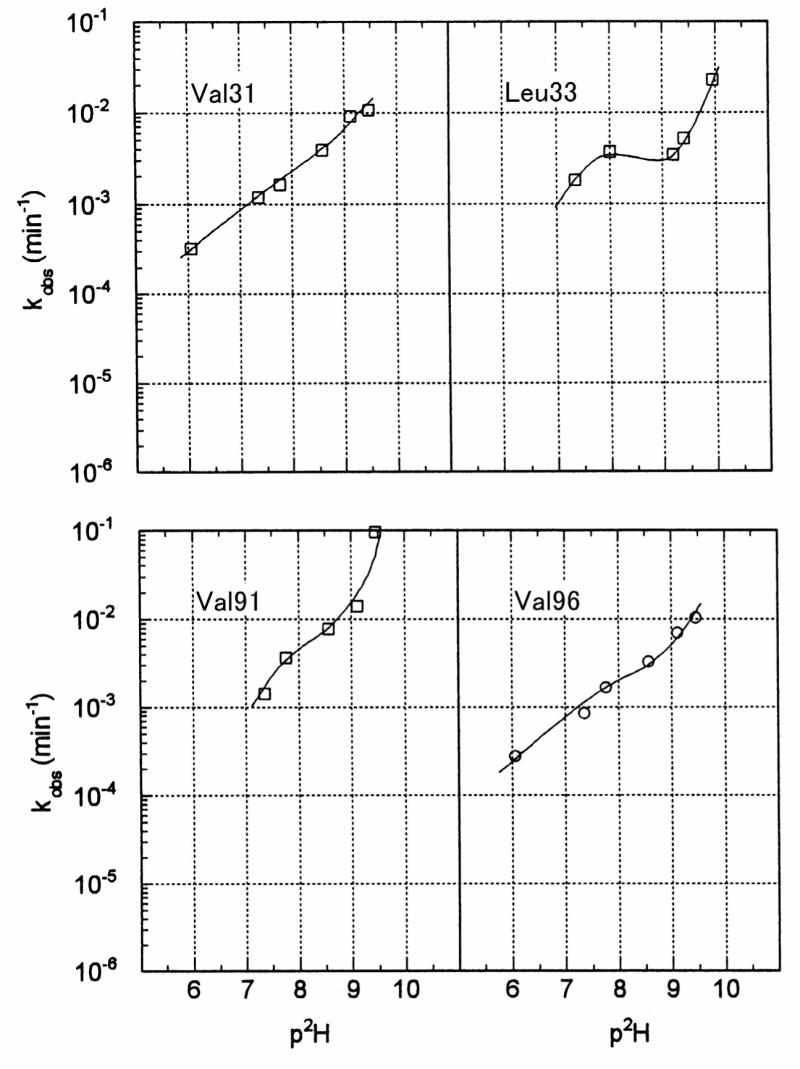
The pH* dependence of the logarithm of the apparent H/D exchange rates (kβ and kγ) of adjacent amides in SSI at 50 °C. The residue whose carbonyl carbon (13C′i) was monitored is indicated in each panel. The open circles and squares represent kβ, and kγ, respectively. The line shape analyses were carried out by the two-site exchange model, because the data did not support the determination of correlated exchange at these sites. (See text for details).
Figure 5.

The pH* dependence of the logarithm of the apparent H/D exchange rates (kβ and kγ) of adjacent amides in SSI at 50 °C and the fraction of exchange occurring by the correlated mechanism (Xβγ). The residue whose carbonyl carbon (13C′i) was monitored is indicated in each panel. The open circles, squares, and triangles represent kβ, kγ, and Xβγ, respectively. (See text for details).
All pairs of residues showed low fractions of correlated exchange at low pH but increased fractions at higher pH. Val13-Leu14, Val78-Leu79, Leu80-Thr81 and Val82-Asp83 achieved fractions of correlated exchange approaching 0.7 to 0.8 at high pH. However, the Val16-Gly17 and Val85-Trp86 pairs only achieved correlated exchange fractions of about 0.4 at high pH*.
DISCUSSION
Amide groups amenable to investigation by the approach used here
Native protein molecules are stabilized by many interactions, such as hydrogen bonds, hydrophobic and electrostatic interactions and disulfide bonds, if present. Since the free energy for the stabilization of a native protein molecule is only about 10 kcal mol−1 (38), thermal fluctuations can affect the dynamic structure and function of proteins. The analysis of the exchangeable hydrogens, especially the backbone amide hydrogens, in a protein is one of the most important ways to study its dynamic features. Since contact with solvent molecules is necessary to exchange the buried amide hydrogens, some native interactions must be partially or fully broken.
Each SSI subunit contains two α-helices and one 5-stranded β-sheet, and some of the Leu and Val residues are distributed within these secondary structures. Amide hydrogens that are not involved in these secondary structures exchange very rapidly (Leu6, Tyr7, Val20, Ser21, Leu60, Asn61, Leu63, Thr64, Val 69, Met70, Val74, and Try75). Amide hydrogens located at the edge of the β-sheet and not participating in hydrogen bonding also displayed fast exchange (Thr32, Ser92, and Val96). The N-terminal region from Asp1 to Leu6 of SSI projects away from the globular part of the molecule and is mobile. The relative solvent accessibilities (Ra) of Leu6 and Tyr7 were determined to be 100% (39). Since this region is freely accessible to the solvent, regardless of the rest of the SSI molecule, the exchange rates may be as fast as those of small peptides. The high mobility of this region was also indicated by the narrow line width of the Leu6 resonance (Figure 3). The Ra values of some of the other fast exchanging amide hydrogens without secondary structures (Val20, Ser21, Asn61, Leu63 and Val74) were 0 %; however, these amide hydrogens are located near the surface of the molecule and exchanged rapidly apparently as the result of local fluctuations. None of the exchange rates of these rapidly exchanging amides could be determined by the method employed here.
Those slowly exchangeable amides of SSI that could be investigated by the carbonyl 13C NMR approach employing selective labeling of Leu and Val residues are listed in Table 1. Although the amide hydrogens of Leu12 and Thr15 were found to exchange slowly, as judged from the spectral changes, the carbonyl resonances were overlapped, and the exchange rates could not be determined. All of these amide hydrogens, except for those of Ala54, were localized in the 5-stranded β-sheet. Since the exchange rate of Ala54 was relatively fast, it was determined only at pH* = 6.1; at higher pH* values the rate was too fast to measure by this method. SSI is a dimeric protein with each subunit composed of a 5-stranded β-sheet, which is formed with an abundance of hydrophobic amino acid residues, including c.a. 60 % of Leu and Val residues. Most of the amide hydrogens of the β- and γ-sites of these Leu and Val residues participate in β-sheet hydrogen bonds (Figure 7). As shown in Figure 5, the exchange rates of these amide hydrogens depend on pH* and extend from 10−5 min−1 to 10−1 min−1 in the range of 6 < pH* < 10. Akasaka et al. (24) reported the 10 slowest exchanging amide hydrogens in SSI, and our results agree well with their data.
Figure 7.

Schematic drawing of hydrogen bonding network in the 5-stranded anti-parallel β-sheet in SSI. The stippled atoms designate the carbonyl carbons of Leu and Val residues. The dashed lines represented hydrogen bonds determined by X-ray crystallography (39).
It is well known that hydrogen bond formation reduces amide exchange rates remarkably. Our results bear this out in general, but there are exceptions. The amide hydrogens of Gly17, Leu79, and Leu80 are located at the end of a β-sheet, where the hydrogen bond network as determined by X-ray analysis (39) is disordered. Although the amide hydrogen of Leu79 had one of the slowest exchange rates, it does not participate in any hydrogen bond. The 5-stranded β-sheets of the respective subunits of SSI face one other at an angle of approximately 30 °; therefore, the region of the β-sheet bearing these amide hydrogens was not covered by another subunit. However, this part of the β-sheet seems to be sequestered from the solvent by the loop structure from Lys18 to Glu28. We also found that the amide hydrogen of Thr34 hydrogen bonded to the carbonyl oxygen of Ser40; however, the β-shift on the carbonyl resonance of Leu33 was not observed over the entire pH* range. This means that exchange of the Thr34 amide hydrogen is very fast in spite of its participation in a hydrogen bond. The shortest strand (β3), which contains Ser40, is located at the edge of the β-sheet and forms only 3 hydrogen bonds with strand β2. Therefore, one might expect that the interaction between these strands should be weak and that the hydrogen bond between Thr34 and Ser40 may easily break; however, this is one of the slowly exchanging sites. Similarly, Leu78, which is one of most slowly exchanging sites, is located in the region that includes Gly17, Leu79 and Leu80. We found that the exchange rate of Ala54 was relatively fast, even though it is located in the center of an α-helix and forms a hydrogen bond. Similar anomalous exchange results have been reported for other proteins (17, 18). Zhang et al. (28) reported that the amide hydrogens located in the hydrophobic interface displayed slow exchange. Most of the slowly exchanging amide hydrogens in SSI are located in the hydrophobic interface of the subunit. Pederson et al. (18) discussed the exchange rates in terms of the factors of hydrogen bonding, types of secondary structure, and depth from the surface of the protein molecule. They concluded that all of the factors were important, but the exchange rates were not uniquely determined by any of these factors definitively.
Correlated motions in SSI
It is widely accepted that fluctuations are required for the solvent exchange of amide hydrogens that are fully or partially buried within a protein molecule. The local unfolding model (21, 22) is one of the mechanisms by which the buried amide hydrogens can exchange. Two types of fluctuations can be envisioned. One is a local fluctuation that requires only a low activation energy. The other is a global fluctuation that induces a wider range of disorder in the protein molecule and requires larger activation energy. Both of these processes could coexist in actual proteins and facilitate the exchange of amide hydrogens. The exchange process in the local unfolding model is represented by the following equation (40),
| (13) |
where N represents the folded conformation. An internal amide hydrogen in a protein cannot exchange, because the solvent molecules do not have access to it. O indicates the unfolded state, in which the amide hydrogen can exchange. Since the native state of a protein favors the folded conformation, the equilibrium lies toward the N state, and then k1 ≪ k2. In this situation, the exchange rate, kex, is represented by
| (14) |
When k1 ≪ k2 and k2 ≪ k3 (EX1 condition), the equation simplifies to.
| (15) |
Since the opening rate of the protein determines the exchange rate under these conditions, the exchange rate displays the internal fluctuation directly. On the other hand, when k1 ≪ k2 and k3 ≪ k2 (EX2 condition), the exchange rate is given by
| (16) |
where K = k1/k2. The exchange rates, k3, are available (41, 42), and thus the equilibrium constants for the individual amide hydrogens can be determined.
The exchange scheme is more complicated in the case of SSI, because SSI is a dimeric protein constructed from two identical subunits. The detailed exchange equation in the case of SSI is represented by
| (17) |
where DN, MN, and MO represent the folded state in the dimer, the folded state in the monomer, and the unfolded state in the monomer, respectively. However, it is known that the equilibrium between the dimer and the monomer extremely favors the dimer, and the dissociation constant is estimated to be lower than 5×10⁻⁷ M in SSI (34). Moreover, it has been reported on the basis of thermal (29, 43) and SDS (44) denaturation experiments that the monomeric form of SSI should be unfolded. These results indicate that k4 ≪ k5 and k7 ≪ k6, and thus the concentration of the MN species would be very low. Therefore, the exchange scheme can be simplified to that of eq. 14, which represents the case of a simple monomeric protein. We can discuss the amide hydrogen exchange on SSI without any special considerations due to dimeric protein.
The general approach used in distinguishing whether a given amide hydrogen exchanges by the EX1 or EX2 mechanism is to examine its pH dependence. Normally, the assumption is made that the unfolding equilibrium is pH independent. In this case the observed exchange rate is proportional to the catalyst concentration in the EX2 limit and independent of the catalyst concentration in the EX1 limit. Some methods for the direct detection of correlated exchange have been reported. For example, correlated exchange was detected in the β-sheet of BPTI by analyzing the time-dependence of NOEs between amide hydrogens; when normalized for single site exchange rates, the NOE intensities of sites undergoing correlated exchange decreased more rapidly than those undergoing uncorrelated exchange (23, 26). Mass spectroscopic investigations have indicted that the amide hydrogens in lysozyme at pH 3.8 and 69 °C exchange predominantly by the EX2 mechanism (27). Mass spectrometry was used in detecting correlated exchange in aldolase (28).
In none of the previous investigations of correlated hydrogen exchange has a detailed analysis of the pH dependence of exchange been carried out. In principle, one expects in the EX2 limit that the correlated exchange rate will be much lower than the uncorrelated rate. In addition, whereas the uncorrelated rate in the EX2 limit depends on the catalyst concentration, in this limit the correlated rate should depend on the square of the catalyst concentration. In the EX1 limit, both rates should be independent of catalyst concentration. The pH at which the transition from EX2 to EX1 occurs may be different for the uncorrelated and correlated exchange rates, depending on their relative magnitudes.
On inserting the expected EX2 limit pH dependence into the rates, eq. 8 becomes
| (18) |
where the zeroes indicate the pH-independent rates. Thus, one predicts that Xβγ will be pH dependent with a sigmoidal dependence as observed in Figure 5.
We have analyzed the data from Table 2 to extract the pH-independent rate constants for the single site and two-site correlated exchange. The best fits were for the data from the carbonyls of Val78 and Val85. Except for the pH 9.5 and 10.1 data points for Val78, the fitted rate constants when inserted into eq. 18 provided reasonable approximations of the observed pH dependence of Xβγ (Figure 5). The reconstructed pH dependence of Xβγ is shown in Figure 8. Our analysis assumes that
Figure 8.

Simulated plot of Xβγ vs. pH according to eq. 18. The pH-independent exchange rate constants used in the simulation were kβ ° = 1.5×10² M−1min−1, kγ° = 2.1×10² M−1min−1, and kc* = 5.7×10⁶ M−2min−1 (Table 3). These values were estimated from fitting the experimental data for Val78 (Table 2).
is independent of pH. In the case of SSI, this assumption should be satisfied, because SSI is a very stable protein and its native structure persists even at pH = 13.3 and 25 °C, or pH = 12.2 and 50 °C (45). The results of this study can be explained by exchange occurring in the EX2 limit, including two-site correlated exchange. We provide for the first time, an analysis of the rates of correlated exchange at two adjacent peptide amides.
The amide pairs in SSI shown here to undergo correlated exchange at high pH are located in antiparallel β-sheet participate in hydrogen bonds (Figure 7). The amide hydrogens of adjacent residues in a β-strand project toward opposite sides and form hydrogen bonds with opposite strands. Therefore, correlated exchange of these amide hydrogens implies global unfolding that involves all three β-strands. Since the 5-stranded β-sheet forms the interface of the dimer, this transition must also involve the dissociation of SSI to monomers.
Table 3.
Fitted values for the pH-independent rate constants derived from linear regression analysis of the data from Table 2.
| kβ° (min−1 M−1) | r2 | kγ° (min−1 M−1) | r2 | kc° (min−1 M−2) | r2 | |
|---|---|---|---|---|---|---|
| Val13 | 2.2 × 10² | 0.53 | 2.9 × 10² | 0.89 | 5.6 × 10⁶ | 0.66 |
| Val16 | 4.8 × 10² | 1.00 | 2.7 × 10² | 0.86 | 8.8 × 10⁶ | 0.48 |
| Val78 | 1.5 × 10² | 0.96 | 2.1 × 10² | 0.98 | 5.7 × 10⁶ | 1.00 |
| Leu80 | 9.6 × 101 | 0.86 | 5.6 × 101 | 0.80 | 5.3 × 10⁶ | 0.63 |
| Val82 | 2.7 × 10² | 0.91 | 2.8 × 10² | 0.82 | 7.2 × 10⁶ | 0.75 |
| Val85 | 1.2 × 10³ | 0.99 | 2.0 × 10³ | 0.99 | 5.0 × 10⁷ | 0.98 |
Acknowledgments
The late Prof. Yoshimasa Kyogoku (Osaka University) generously shared the NMR facilities at the Protein Research Institute and contributed thoughtful discussions on this research. We thank Dr. Katsuhiko Kushida (Varian Associates) for his assistance in collecting the NMR data.
Footnotes
This work was supported by grant from CREST/JST; JLM received support from the National Institutes of Health National Center for Research Resources grant RR02301.
Abbreviations: NMR, nuclear magnetic resonance; NOE, nuclear Overhauser effect; pH*, pH meter value measured in 2H2O solution with a glass electrode containing buffers in H2O; SSI, Streptomyces subtilisin inhibitor; [L]SSI, SSI with all leucines labeled with [1-13C]Leu; [V]SSI, SSI with all valines labeled with [1-13C]Val; TMS, tetramethylsilane; Ra, relative solvent accessibility; β-site, backbone amide hydrogen (HNi+1) in residue i+1 relative to the carbonyl carbon in residue i; γ-site, backbone amide hydrogen (HNi) in the same residue as the carbonyl carbon in residue i; β-shift, isotope shift in 13Ci′ induced by deuteration at the β-site; γ-shift, isotope shift in 13Ci′ induced by deuteration at the γsite; [H,H], the isotopomer in which both the γ- and β-sites are occupied by hydrogens; [H,D], the isotopomer in which the γ- and β-sites are occupied by a hydrogen and a deuteron, respectively; [D,H], the isotopomer in which the γ- and β-sites are occupied by a deuteron and a hydrogen, respectively; [D,D], the isotopomer in which both the γ- and β-sites are occupied by deuterons; kβ′, rate derived from the time dependence of the peak corresponding to the [H,D] isotopomer; kβ, apparent rate constant for H/D exchange at the β-site; kβ°, pH-independent rate constant for H/D exchange at the β-site; kγ′, rate derived from the time dependence of the peak corresponding to the [D,H] isotopomer; kγ, apparent rate constant for H/D exchange at the γ-site; kγ°, pH-independent rate constant for H/D exchange at the γ-site; kc, apparent rate constant for correlated H/D exchange at the β- and γ-sites; kc°, pH-independent rate constant for correlated H/D exchange at the β- and γ-sites; Xβγ, fraction of H/D exchange at the β- and γ-sites occurring by the correlated mechanism.
References
- 1.Karplus M, McCammon JA. The internal dynamics of globular proteins. CRC Crit Rev Biochem. 1981;9:293–349. doi: 10.3109/10409238109105437. [DOI] [PubMed] [Google Scholar]
- 2.Linderstrom-Lang K. Deuterium exchange between peptides and water. Chem Soc Spec Publ. 1955;2:1–20. [Google Scholar]
- 3.Woodward C, Simon I, Tuchsen E. Hydrogen exchange and the dynamic structure of proteins. Mol Cell Biochem. 1982;48:135–160. doi: 10.1007/BF00421225. [DOI] [PubMed] [Google Scholar]
- 4.Englander SW, Kallenbach NR. Hydrogen exchange and structural dynamics of proteins and nucleic acids. Quart Rev Biophys. 1984;16:521–655. doi: 10.1017/s0033583500005217. [DOI] [PubMed] [Google Scholar]
- 5.Englander SW, Mayne L. Protein folding studied using hydrogen-exchange labeling and two-dimensional NMR. Ann Rev Biophys Biomol Struct. 1992;21:243–265. doi: 10.1146/annurev.bb.21.060192.001331. [DOI] [PubMed] [Google Scholar]
- 6.Baldwin RL. Pulsed H/D-exchange studies of folding intermediates. Curr Opin Struct Biol. 1993;3:84–91. [Google Scholar]
- 7.Bai Y, Sosnick TR, Mayne L, Englander SW. Protein folding intermediates: native-state hydrogen exchange. Science. 1995;269:192–197. doi: 10.1126/science.7618079. [DOI] [PMC free article] [PubMed] [Google Scholar]
- 8.Krishna MMG, Hoang L, Lin Y, Englander SW. Hydrogen exchange methods to study protein folding. Methods. 2004;34:51–64. doi: 10.1016/j.ymeth.2004.03.005. [DOI] [PubMed] [Google Scholar]
- 9.Mayne L, Paterson Y, Cerasoli D, Englander SW. Effect of antibody binding on protein motions studied by hydrogen-exchange labeling and two-dimensional NMR. Biochemistry. 1992;31:10678–10685. doi: 10.1021/bi00159a006. [DOI] [PubMed] [Google Scholar]
- 10.Zahn R, Spitzfaden C, Ottger M, Wüthrich K, Pluckthun A. Destabilization of the complete protein secondary structure on binding to the chaperone GroEL. Nature. 1994;368:261–265. doi: 10.1038/368261a0. [DOI] [PubMed] [Google Scholar]
- 11.Reid CW, Brewer D, Clarke AJ. Substrate binding affinity of Pseudomonas aeruginosa membrane-bound lytic transglycosylase B by hydrogen-deuterium exchange MALDI MS. Biochemistry. 2004;43:11275–11282. doi: 10.1021/bi049496d. [DOI] [PubMed] [Google Scholar]
- 12.Loftus D, Gbenle GO, Kim PS, Baldwin RL. Effects of denaturants on amide proton exchange rates: a test for structure in protein fragments and folding intermediates. Biochemistry. 1986;25:1428–1436. doi: 10.1021/bi00354a036. [DOI] [PubMed] [Google Scholar]
- 13.Englander JJ, Calhoun DB, Englander SW. Measurement and calibration of peptide group hydrogen-deuterium exchange by ultraviolet spectrophotometry. Ann Biochem. 1979;92:517–524. doi: 10.1016/0003-2697(79)90693-6. [DOI] [PubMed] [Google Scholar]
- 14.Harmen HJ, de Jong HH, Goormaghtigh E, Ruysschaert J-M. Tertiary stability of native and methionine-80 modified cytochrome c detected by proton-deuterium exchange using online Fourier transform infrared spectroscopy. Biochemistry. 1985;34:172–179. doi: 10.1021/bi00001a021. [DOI] [PubMed] [Google Scholar]
- 15.Wagner G, Wüthrich K. Structural interpretation of the amide proton exchange in the basic pancreatic trypsin inhibitor and related proteins. J Mol Biol. 1979;134:75–94. doi: 10.1016/0022-2836(79)90414-5. [DOI] [PubMed] [Google Scholar]
- 16.Wagner G, Wüthrich K. Amide protein exchange and surface conformation of the basic pancreatic trypsin inhibitor in solution. Studies with two-dimensional nuclear magnetic resonance. J Mol Biol. 1982;160:343–361. doi: 10.1016/0022-2836(82)90180-2. [DOI] [PubMed] [Google Scholar]
- 17.Kossiakoff AA. Protein dynamics investigated by the neutron diffraction-hydrogen exchange technique. Nature. 1982;296:713–721. doi: 10.1038/296713a0. [DOI] [PubMed] [Google Scholar]
- 18.Pederson TG, Sigurskjold BW, Anderson KV, Kjaer M, Poulsen FM, Dobson CM, Redfield C. A nuclear magnetic resonance study of the hydrogen-exchange behaviour of lysozyme in crystals and solution. J Mol Biol. 1991;218:414–426. doi: 10.1016/0022-2836(91)90722-i. [DOI] [PubMed] [Google Scholar]
- 19.Lumry R, Rosenberg A. The mobile defect hypothesis of protein function. Coll Int C N R S L’Eau Syst Biol. 1975;246:55–63. [Google Scholar]
- 20.Richards FM. Packing defects, cavities, volume fluctuations, and access to the interior of proteins. Carsberg Res Commun. 1979;44:47–63. [Google Scholar]
- 21.Englander SW, Mauel C. Hydrogen exchange studies of respiratory proteins. II Detection of discrete, ligand-induced changes in hemoglobin. J Biol Chem. 1972;247:2387–2394. [PubMed] [Google Scholar]
- 22.Englander SW, Calhoun DB, Englander JJ, Kallenbach NR, Leim RH, Malin EL, Mandal C, Rogero JR. Individual breathing reactions measured in hemoglobin by hydrogen exchange methods. Biophys J. 1980;32:577–589. doi: 10.1016/S0006-3495(80)84991-5. [DOI] [PMC free article] [PubMed] [Google Scholar]
- 23.Roder H, Wagner G, Wüthrich K. Individual amide proton exchange rates in thermally unfolded basic pancreatic trypsin inhibitor. Biochemistry. 1985;24:7396–7407. doi: 10.1021/bi00346a056. [DOI] [PubMed] [Google Scholar]
- 24.Akasaka K, Inoue T, Hatano H, Woodword CK. Hydrogen exchange kinetics of core peptide protons in Streptomyces subtilisin inhibitor. Biochemistry. 1985;24:2973–2979. doi: 10.1021/bi00333a025. [DOI] [PubMed] [Google Scholar]
- 25.Kawata Y, Goto Y, Hamaguchi KHayashi F, Kobayashi Y, Kyogoku Y. Hydrogen-exchange kinetics of the indole NH proton of the buried tryptophan in the constant fragment of the immunoglobulin light chain. Biochemistry. 1988;27:346–350. doi: 10.1021/bi00401a052. [DOI] [PubMed] [Google Scholar]
- 26.Wagner G. A novel application of nuclear Overhauser enhancement (NOE) in proteins: analysis of correlated events in the exchange of internal labile protons. Biochim Biophys Rev Commun. 1980;97:614–620. doi: 10.1016/0006-291x(80)90308-3. [DOI] [PubMed] [Google Scholar]
- 27.Miranker A, Robinson CV, Radford SE, Aplin RT, Dobson CM. Detection of transient protein folding populations by mass spectrometry. Science. 1993;262:896–900. doi: 10.1126/science.8235611. [DOI] [PubMed] [Google Scholar]
- 28.Zhang Z, Post CB, Smith DL. Amide hydrogen exchange determined by mass spectrometry: application to rabbit muscle aldolase. Biochemistry. 1996;35:779–791. doi: 10.1021/bi952227q. [DOI] [PubMed] [Google Scholar]
- 29.Kainosho M, Tsuji T. Assignment of the three methionyl carbonyl carbon resonances in Streptomyces subtilisin inhibitor by a carbon-13 and nitrogen-15 double-labeling technique, A new strategy for structural studies of proteins in solution. Biochemistry. 1982;21:6273–6279. doi: 10.1021/bi00267a036. [DOI] [PubMed] [Google Scholar]
- 30.Kainosho M, Nagao H, Tsuji T. Local structural features around the C-terminal segment of Streptomyces subtilisin inhibitor studied by carbonyl carbon nuclear magnetic resonances three phenylalanyl residues. Biochemistry. 1987;26:1068–1075. doi: 10.1021/bi00378a013. [DOI] [PubMed] [Google Scholar]
- 31.Uchida K, Miyake Y, Kainosho M. Reductive cleavage and regeneration of the disulfide bonds in Streptomyces subtilisin inhibitor (SSI) as studied by the carbonyl 13C NMR resonances of cysteinyl residues. J Biomol NMR. 1991;1:49–64. doi: 10.1007/BF01874568. [DOI] [PubMed] [Google Scholar]
- 32.Markley JL, Kainosho M. Stable isotope labeling and resonance assignments in larger proteins. In: Roberts GCK, editor. NMR of Macromolecules. Oxford University Press; New York: 1993. pp. 101–152. [Google Scholar]
- 33.Hansen PE. Isotope effects on nuclear shielding. Ann Rep NMR Spectroscopy. 1983;15:105–234. [Google Scholar]
- 34.Akasaka K, Fujii S, Hayashi F, Rokushika S, Hatano H. A novel technique for the detection of dissociation-association equilibrium in a highly associable macromolecular system. Biochem Ind. 1982;5:637–642. [Google Scholar]
- 35.Hiromi K, Akasaka K, Mitsui Y, Tonomura B, Murao S. Protein Protease Inhibitor – The Case of Streptomyces Subtilisin Inhibitor (SSI) Elsevier; Amsterdam, The Netherlands: 1985. [Google Scholar]
- 36.Nakanishi M, Tsuboi M. Structure and fluctuation of a Streptomyces subtilisin inhibitor. Biochim Biophys Acta. 1976;434:365–376. doi: 10.1016/0005-2795(76)90228-2. [DOI] [PubMed] [Google Scholar]
- 37.Marquardt DW. An algorithm for least squares estimation of nonlinear parameters. J Soc Indust Appl Math. 1963;11:431–441. [Google Scholar]
- 38.Goto Y, Hamaguchi K. The role of the intrachain disulfide bond in the conformation and stability of the constant fragment of the immunoglobulin light chain. J Biochem (Tokyo) 1979;86:1433–1441. doi: 10.1093/oxfordjournals.jbchem.a132661. [DOI] [PubMed] [Google Scholar]
- 39.Mitsui Y, Satow Y, Watanabe Y, Iitaka Y. Crystal structure of a bacterial protein proteinase inhibitor (Streptomyces subtilisin inhibitor) at 2.6 A resolution. J Mol Biol. 1979;131:697–724. doi: 10.1016/0022-2836(79)90198-0. [DOI] [PubMed] [Google Scholar]
- 40.Havdt A, Nielsen SO. Hydrogen exchange in proteins. Advan Protein Chem. 1966;21:287–386. doi: 10.1016/s0065-3233(08)60129-1. [DOI] [PubMed] [Google Scholar]
- 41.Molday RS, Englander SW, Kallen RG. Primary structure effects on peptide group hydrogen exchange. Biochemistry. 1972;11:150–158. doi: 10.1021/bi00752a003. [DOI] [PubMed] [Google Scholar]
- 42.Bai Y, Milne JS, Mayne L, Englander SW. Primary structure effects on peptide group hydrogen exchange. Proteins. 1993;17:75–86. doi: 10.1002/prot.340170110. [DOI] [PMC free article] [PubMed] [Google Scholar]
- 43.Komiyama T, Miwa M, Yatabe T, Ikeda H. A circular dichroism study on thermal denaturation of a dimeric globular protein, Streptomyces Subtilisin inhibitor. J Biochem. 1984;95:1569–1575. doi: 10.1093/oxfordjournals.jbchem.a134769. [DOI] [PubMed] [Google Scholar]
- 44.Akasaka K. Molecular strategy for the active conformation of Streptomyces subtilsin inhibitor. Biomedical Research. 1984;25(Supplement):177–186. [Google Scholar]
- 45.Akasaka K. Proton magnetic resonance spectra of a new proteinase inhibitor, Streptomyces Subtilisin inhibitor (SSI) at 360 MHz. In: Conti F, editor. General characteristic and tyrosine titrations, in Proceedings of the European Conference on NMR of Macromolecules; Rome: Lerici; pp. 475–483. [Google Scholar]