

Abstract
The neural representations associated with learned auditory behaviours, such as recognizing individuals based on their vocalizations, are not well described. Higher vertebrates learn to recognize complex conspecific vocalizations that comprise sequences of easily identified, naturally occurring auditory objects1,2, which should facilitate the analysis of higher auditory pathways. Here we describe the first example of neurons selective for learned conspecific vocalizations in adult animals—in starlings that have been trained operantly to recognize conspecific songs. The neuronal population is found in a non-primary forebrain auditory region, exhibits increased responses to the set of learned songs compared with novel songs, and shows differential responses to categories of learned songs based on recognition training contingencies. Within the population, many cells respond highly selectively to a subset of specific motifs (acoustic objects) present only in the learned songs. Such neuronal selectivity may contribute to song-recognition behaviour, which in starlings is sensitive to motif identity3,4. In this system, both top-down and bottom-up processes may modify the tuning properties of neurons during recognition learning, giving rise to plastic representations of behaviourally meaningful auditory objects.
The constraints on natural-object representation imposed by stimulus complexity and behaviour argue for the use of model systems in which both the form and function of the sensory input are well understood2. We are investigating the representation of vocal-communication signals in songbirds, in which the ecological relevance of sensory signals (that is, songs) is well established. The competitive reproductive environments in which songbirds function require adult birds to discriminate and classify conspecific vocalizations on the basis of intra-species acoustic variation, and various forms of vocal recognition are widespread among song-birds5. Song-recognition behaviour has been studied extensively in European starlings (Sturnus vulgaris). Starling songs comprise sequences of repeated, discrete, multiple-note clusters, referred to as ‘motifs’6 (see, for example, Fig. 3a). The behavioural data suggest that motifs are perceived as auditory objects. Motifs vary in length from 200 to 1,000 ms, but the pattern of notes within a given motif type is largely stable between renditions. Individual birds tend to sing unique motifs. In laboratory experiments with artificial mixtures of songs, the relative proportions of motifs from different singers predicted song-recognition behaviour, suggesting that starlings form memories of motifs as part of the song-recognition process3,4,7. Recent results have identified auditory-forebrain pathways in songbirds beyond the primary thalamo-recipient telencephalic region known as field L8, including ventral hyperstriatal neurons with complex response properties9,10 (Fig. 1a). Here we report on data recorded from single neurons in the caudomedial ventral hyperstriatum (cmHV) of starlings trained operantly to recognize sets of conspecific songs (Fig. 1b-d). Many of these neurons responded selectively to learned motifs.
Figure 3.

Neuronal responses in the cmHV. a, Response of a selective cmHV unit to nine different song stimuli. Familiar songs are outlined in red, unfamiliar songs in blue. The peri-stimulus time histogram (PSTH) of the response is superimposed over the sonogram of each stimulus. The selectivity index, SI, for this cell was the closest to the mean for selective cells (0.497). An example of a single motif is outlined in green. b, Detailed view of the response of the unit in a to the song stimulus denoted by the red star. Traces from top to bottom show the raw spike waveform for a single stimulus presentation (showing excellent single-unit isolation), the PSTH, spike raster plots for several stimulus presentations (showing the reliability of the response), and the stimulus sonogram. The response strength, RS, for this song was 8.93. c, Example of another selective cmHV neuron responding to six different song stimuli, organized as in a. The SI for this cell was 0.259, near the lower limit for selective cells. Horizontal and vertical scale bars show 5 kHz and 1 s, respectively, for a and c.
Figure 1.

Background and behaviour. a, Schematic of the songbird forebrain auditory system (in blue; Ov, nucleus ovoidalis; L1-L3: field L complex; NCM, caudomedial neostriatum; cHV, caudoventral hyperstriatum). The cmHV is outlined in red. Nuclei in the adjacent vocal ‘song’ system are shown in grey. b, Schematic of the operant apparatus. Animals probed openings in the panel in response to different songs to receive a food reward. c, Acquisition curves showing mean performance (as the proportion of correct responses) for all subjects over the first 60 blocks of training (100 trials per block). Acquisition rates differed significantly between training regimes (F(59,354) = 1.597, P < 0.01). d, Mean proportion of correct responses over the last 500 trials before recording, plotted separately for the two sets of training stimuli (light and dark bars) within each regime. The mean (±s.e.m.) proportion of correct responses at asymptote (0.93 ± 0.01) was significantly above chance (chi-squared test, P ≪ 0.0001), and did not vary significantly between the two training regimes, or within regimes between stimulus sets.
Eight adult starlings were trained, four each on a two-alternative choice or go/no-go procedure (Fig. 1b), to discriminate accurately between four to ten 10-s samples of conspecific songs divided equally into two training sets. Each bird achieved asymptotic behaviour with highly accurate recognition of the training songs (Fig. 1c, d). We then anaesthetized each subject with urethane and recorded the extracellular responses of single neurons in the cmHV to a large ensemble of auditory stimuli. The stimulus ensemble comprised the song stimuli that were used during operant recognition training (‘familiar’ songs), novel conspecific song stimuli (‘unfamiliar’ songs) and two synthetic stimuli. The stimulus ensemble was similar across subjects, except that the familiarity or novelty of the song stimuli varied systematically on the basis of their operant training; the unfamiliar songs for one subject served as half of the training songs for another subject (see Methods). Neurons were tested with 33-77 unique song motifs (73-178 total motifs), depending on the set of familiar songs used to train each animal and the set of unfamiliar songs used during testing. Because preliminary experiments indicated that many cmHV neurons had very low spontaneous rates and responded to only a few stimuli, we used the entire stimulus ensemble (familiar and unfamiliar songs, and synthetic stimuli) to search for auditory units as well as to test the neurons’ responses. We report here on the 45 single units in cmHV that showed significant excitatory responses to one or more of the test stimuli (see Methods).
As a population, cmHV neurons responded selectively to the class of familiar songs. The mean response strength (RS; see Methods) was strongly biased towards familiar songs (6.7 ± 1.8) compared with unfamiliar songs (3.9 ± 1.3), and the difference between the normalized RS (z-scores; see Methods) for familiar and unfamiliar songs was highly significant (F(1,43) 25.55, P, < 0.0001; Fig. 2a). The strong response bias for familiar songs was consistent in animals trained under both the two-alternative choice and go/no-go operant regimes (F(1,43) = 1.85, no significant interaction found between stimulus familiarity and operant training; Fig. 2a). Thus, in this paradigm, song-recognition learning shapes the responses of cmHV neurons.
Figure 2.

cmHV response strengths. a, RS z-scores (see Methods) for familiar (red and green) and unfamiliar (blue) songs, split by training regime (two-alternative choice, squares; go/no-go, circles). b, RS z-scores as in a but with the two sets of training stimuli and their accompanying responses shown separately (two-alternative choice, green; go/no-go, red). The differences between all three classes for the go/no-go regime were significant (see text). c, Rank-ordered RS z-scores for the three most potent familiar (red) and unfamiliar (blue) stimuli for song-selective (filled symbols) and non-selective neurons (open symbols). The interaction between stimulus rank-order and response selectivity among the familiar songs (red symbols) is significant (F(2,72) = 23.16, P < 0.0001) and shows the strong bias in the song-selective cells for a single stimulus. The difference between the red and blue curves shows the population-level bias for familiar songs. d, RS z-scores for song-selective (filled symbols) and non-selective (open symbols) neurons, with the response to the preferred stimulus (the stimulus that elicited the strongest response) removed from the analysis. The differences are highly significant (see main text). All values are reported as mean ± s.e.m.
Whereas subjects trained using the two-alternative choice procedure showed no reliable difference between response strengths associated with the two sets of training songs (one-tailed test, t = -0.67, not significant; n = 14 neurons, 4 birds), those trained with the go/no-go procedure did (n = 31 neurons, 4 birds). Songs associated with positive reinforcement (S+ stimuli) elicited significantly stronger responses than those associated with punishment (S- stimuli; Fig. 2b) (two-tailed test, t = 2.68, P < 0.05). This difference was not the result of an overall failure to respond to the S- stimulus, as the S- stimuli elicited stronger responses than unfamiliar songs (two-tailed test, t = 2.28, P < 0.05; Fig. 2b). Thus, although animals in both operant regimes learned to discriminate equally well between the sets of training songs (Fig. 1c, d), the reinforcement contingencies specific to each regime (see Methods) had differential effects on the distributions of neuronal responses. These task-specific effects may reflect the use of different strategies to solve each task, and/or the differential cost of incorrect responses under each regime (see Methods and Supplementary Information). In either case, the results suggest that ‘top-down’ associative processes as well as ‘bottom-up’ stimulus activation shape the responses of cmHV neurons, which are linked to song-recognition learning.
The bias for familiar songs indicates that cmHV neurons did not respond equally to all songs in the test ensemble. To examine this in more detail, we quantified each neuron’s selectivity as a function of the different test stimuli by expressing the maximum stimulus-elicited RS for a given cell as a selectivity index (SI) score. If the SI score for a cell exceeded the 95th percentile in a simulated distribution of random SI scores (see Methods), the cell was termed ‘song-selective’ for the song that elicited the maximum RS. Cells for which the SI did not exceed the 95th percentile were classed as ‘non-selective’. By this definition, 64.4% (29 out of 45) of the cells in the cmHV gave a selective response to one of the test stimuli. Notably, 27 of the 29 song-selective cells preferred one of the training songs (Fig. 3). This overwhelming bias in the proportion of preferred stimuli towards familiar songs is significantly different from that expected by chance, given the distribution of familiar and unfamiliar stimuli in the test ensemble (X2 = 12.03, P < 0.005) — that is, after correcting for the bias introduced by searching and testing with greater numbers of familiar than unfamiliar songs (Fig. 2c). Different measures of selectivity resulted in different distributions of selective and non-selective cells, but did not eliminate the strong, significant bias towards familiar songs (see Supplementary Information). Among the non-selective cells, the proportions of preferred stimuli were also skewed towards familiar songs, but the bias was not significantly different from chance (X2 = 3.50, P = 0.18). The difference in the distributions of responses to the familiar and unfamiliar songs was not wholly dependent on the response to the preferred song. Even when the preferred song was removed from the analysis, the mean RS associated with the familiar songs remained significantly greater than that for the unfamiliar songs (F(1,43) = 12.67, P < 0.001). This was observed for non-selective as well as song-selective cells (Fig. 2d), showing that, as a population, cmHV neurons evince selectivity for the class (or a subset) of familiar songs. The strong bias in the selectivity of single neurons for familiar songs resembles biases seen in the song control system for a bird’s own song11,12. However, this is the first report of neuronal selectivity for songs of conspecifics that adults have learned to recognize, and obtains for neurons outside the song control system.
Both song-selective and non-selective cells could respond with phasic or tonic patterns of activity, and with high or low spontaneous firing rates (Fig. 4a). However, there was a significant bias for song-selective cells to have more phasic responses (Mann-Whitney U-test, P < 0.01) and lower spontaneous firing rates (Mann-Whitney U-test, P < 0.05) than non-selective cells. Thus, most cells with near-zero spontaneous firing rates and highly phasic responses were selective. For many of the song-selective cells, responses were restricted to one or a small number of repeated motifs within one or a few songs, typically with suppression of background activity for all other motifs (Fig. 3a, b). Examining the response data (RS scores) on a motif-by-motif basis, by simply counting the number of motifs that elicited a significant response from each cell, revealed that the song-selective cells responded to significantly fewer motifs (8.0 ± 1.5) than non-selective cells (20.5 ± 3.8; Mann-Whitney U-test, P < 0.0005; Fig. 4b). We quantified the relationship between motif features and each neuron’s response using a multiple linear regression between the RS associated with each motif in a given cell’s test ensemble and the 50 strongest coefficients from a wavelet decomposition of the sonogram for each motif (see Supplementary Information). The mean non-adjusted R2 value (see Methods) for regressions with the song-selective cells (0.675 ± 0.033) was significantly greater than that for the non-selective cells (0.554 ± 0.048; Mann-Whitney U-test, P < 0.05), indicating that acoustic features in individual motifs predicted the responses of the song-selective cells better than those of non-selective cells. This neuronal sensitivity to acoustic features is the result of nonlinear response properties, as demonstrated by the poor predictions made by linear estimates of each cell’s receptive field (see Supplementary Information). Thus, ‘song-selectivity’ in cmHV is expressed as a tendency towards phasic responses to specific acoustic features that appear in only a small number of motifs. The selective representation of acoustic features that are diagnostic for single or small sets of motifs, observed here, could help starlings to evaluate the proportion of familiar motifs within a given song, which behavioural work has shown is important for conspecific song recognition4.
Figure 4.
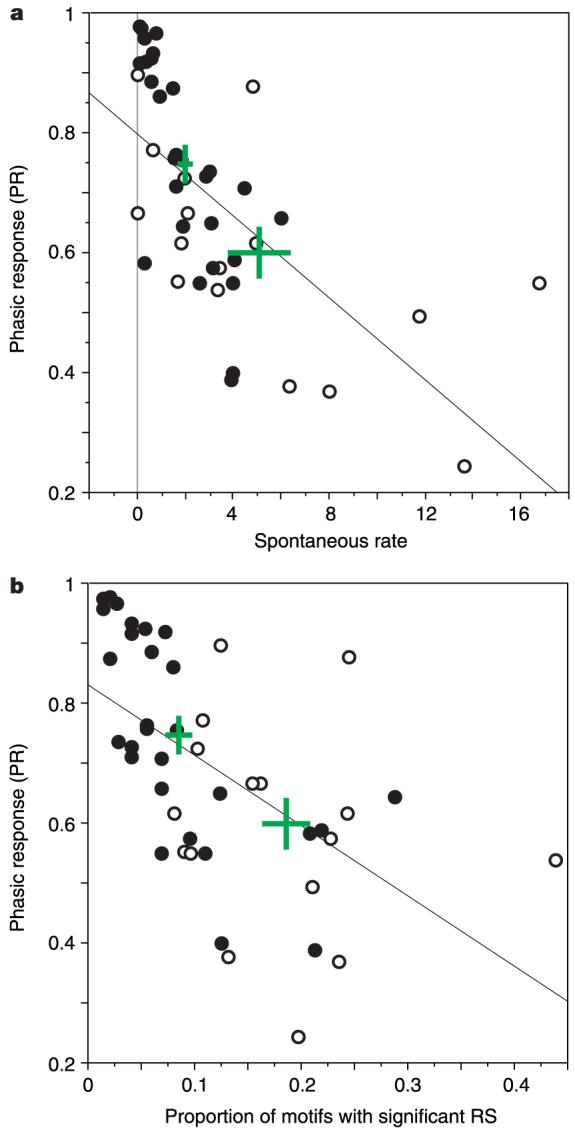
Response scattergrams. a, Scatter plot showing the distribution of phasic responses (PR) across the population of selective (filled symbols) and non-selective (open symbols) cmHV neurons, as a function of spontaneous firing rate (spikes s-1). The means (±s.e.m.) for each class are shown as the green crosses. The line shows the significant linear regression (Fisher’s r to z, r = -0.65, P < 0.0001). The PR is a normalized measure of the tendency of a cell’s discharges to occur in bursts, quantified using the stimulus-driven interspike interval such that the PR for a maximally tonic response is zero, and that for maximally phasic response is 1. The PR of cells depicted in Fig. 3a, c were 0.86 and 0.40, respectively. b, Asin a but with PR plotted as a function of the proportion of motifs that elicited RS values significantly above chance (see Methods). The line shows the significant linear regression (Fisher’s r to z, r = -0.57, P < 0.0001).
The data suggest that mechanisms of experience-dependent representational plasticity act to modify the responses of cmHV neurons on the basis of the functional demands of song recognition. The acoustic features of the motifs (as represented by the wavelet coefficients) were correlated with the response strength of many cmHV neurons. However, the explicit spectrotemporal parameters underlying the selectivity of cmHV neurons have not yet been determined, and it is unlikely that a purely acoustic account of cmHV responses, as implied by the ‘feature-detector’ terminology, will obtain. The distribution of cmHV response properties depends not only on the spectrotemporal patterns of motifs in familiar and unfamiliar stimuli, but also on the specifics of the conditioning paradigm. All responses to stimuli were rewarded or punished in the two-alternative choice condition, whereas only some were rewarded or punished in the go/no-go condition. Because song recognition mediates a variety of behaviours in both agonistic and antagonistic contexts, different forms of learning under more natural conditions may act on the recognition system to produce a variety of top-down effects on auditory response properties. The presence of these influences on representational plasticity complicates the search for neural correlates in the absence of well-controlled behaviour, and may account for the few reports of such neurons in sensory systems.
Even with the use of extensive stimulus repertoires that animals were trained to recognize, we estimate that less than 50% of the neurons responded to our stimuli (see Methods). The neurons unresponsive to our stimuli may not have been auditory, or may have responded to other songs that these wild-caught birds had previously learned. Given that we find almost no cells selectively tuned to the motifs in unfamiliar songs, the data argue that subpopulations of cmHV neurons are selected from a pool composed primarily of neurons that have already been shaped by the animal’s previous experiences with conspecific songs, rather than from a large pool of non-selective neurons. cmHV neurons were more selective than is observed in field L (analogue of the primary auditory cortex) of starlings, where cells commonly respond to numerous novel conspecific vocalizations13. Response biases for species-specific vocalizations have been reported in field L of birds13,14, and in mammalian primary and secondary auditory cortex15,16. Experience-dependent representational plasticity, reported in a variety of animals and sensory systems17, is typified by shifts in the topography of primary cortical receptive fields18-21. In the auditory system, this plasticity leads to over-representation of the spectral and temporal properties of the stimulus22. Thus, in a hierarchical scheme of sensory processing, plasticity at primary levels should influence higher-order regions, such as cmHV, so that the neuronal response properties and organization are expressly determined by an animal’s unique experience on behaviourally relevant tasks. These higher-order regions could contribute to species-specific vocal recognition, and could influence motor tasks such as counter-singing and vocal learning.
Neural correlates of learned object recognition have also been reported in the extrastriate visual cortex, where cells are broadly tuned23,24, and in the prefrontal cortex25, where selectivity for familiar objects is generally evidenced by a decrease in the numbers of neurons responding to a given object — an effect taken to indicate sharpening of the tuning for such objects26. By contrast, the proportion of cmHV cells selective for familiar songs was much larger than that for unfamiliar songs, and many cells were sharply tuned. For vocal recognition, the predictability imparted by species-specific characteristics of vocalizations, and the constraints imposed by evolutionary history and experience, probably yield a population of neurons predisposed to represent those vocalizations2. We argue that the response properties of cmHV neurons are elaborated continuously towards new functional representations depending on the specific songs and behavioural contingencies an animal encounters. As in juvenile song learning27, the rules by which functional representations arise from biased populations may be complex, and are unlikely to be well predicted by simple spectrotemporal similarities between the target songs and the initial representations of cmHV neurons. The learned representation of auditory objects provides starlings, and perhaps other higher vertebrates, with an efficient mechanism for recognizing a wide and changing array of behaviourally important natural stimuli.
Methods
Stimuli
Training and testing song stimuli were made from recordings of three adult male starlings, from which we drew three sets of song samples. Each set contained five samples of continuous song from one male (mean sample length, 9.72 ± 0.18 s). Two sets served as operant-training stimuli; the third set served as unfamiliar stimuli during electrophysiological testing.
Assignment of each set as either ‘training’ or ‘unfamiliar’, and numbers of songs used from each set were counterbalanced across subjects. Subjects were naive to all of the song stimuli before operant training. No motifs were shared between sets, and very few or none within a set. We also presented synthetic noise and frequency-modulated stimuli.
Behavioural training
Six male and two female wild-caught European starlings learned to discriminate between two of the three sets of songs using one of two standard operant-conditioning procedures: a two-alternative choice procedure3,4,7 or a go/no-go procedure (see Fig. 1b and Supplementary Information). In each procedure, subjects learned (n = 4 per procedure) to recognize the songs in the two training sets using different reward contingencies. All correct responses were positively reinforced in the two-alternative choice procedure, whereas correct responses to only half of the training stimuli (S+) were positively reinforced in the go/no-go procedure (see Supplementary Information).
Electrophysiology
Electrophysiological recordings were conducted using standard extracellular techniques, with free-field stimuli presented to restrained animals inside a sound-isolation chamber. The 45 neurons reported here reflect all the cmHV single neurons that showed significant auditory responses to at least one test stimulus, and for which responses to at least five repetitions (mean, 11.47 ± 0.16) of each test stimulus were obtained. No neurons exhibited only suppression of activity. On the basis of the numbers of cells that did not meet the criterion of five-repetitions per stimulus or show significant auditory responses, we estimate, as an upper bound, that 50% of cmHV cells responded to our stimulus set. We observed no systematic differences between recordings from either hemisphere or sex.
Data analysis
For each neuron, we calculated the mean and variance of the firing rate (spikes s-1) over the duration of each song sample and motif, and during spontaneous activity. We calculated the response strength, RS, associated with each stimulus, as the ratio of stimulus-driven spike-rate variance to the spontaneous spike-rate variance, and used RS as the basis for subsequent analyses. To compare RS values across cells (see, for example, Fig. 2) we converted them to z-scores. Unless noted otherwise, we used a repeated-measures ANOVA (analysis of variance with Greenhouse-Geisser correction) to examine differences in RS z-scores between various stimulus classes (after correcting any deviations from normality). Corrected and uncorrected data yielded statistically identical results.
We quantified each cell’s stimulus selectivity using the selectivity index, , where RSmax is the maximum response strength associated with a stimulus, is the mean response strength across all N test stimuli presented to that cell, and RSi is the response strength associated with the ith test stimulus for that cell. SI ranges from N-1 to 1, with maximal selectivity (SI = 1) in the case in which a cell responds to only a single test stimulus. We determined the significance threshold for each cell’s SI by simulating (1,000 times) the random response of that cell to the same number of test stimuli and repetitions presented during testing, with RS modelled as a gaussian-distributed random variable (mean = 0, variance = 1), or by the real distribution of RS scores (see Supplementary Information). From the simulated RS data, we compiled a distribution of SI scores for each cell and used the value at the 95th percentile of the simulated SI distribution as the threshold for calling a cell ‘selective’.
We compared the proportions of cells selective for familiar songs, unfamiliar songs and artificial stimuli using the chi-squared test. The expected proportions of cells selective for a given stimulus type were equal to the means of the proportions of familiar and unfamiliar stimuli presented to each cell. Mean SI for the population was 0.497 ± 0.033 (mean ± s.e.m.). Similar analyses using different selectivity thresholds, and with SI scores derived from the mean and variance of the spike rate (rather than RS) produced results qualitatively similar to those reported here (see Supplementary Information).
For the wavelet-decomposition analysis, the proportion of significant multiple regressions for the song-selective cells (17 out of 28, 60.1%) was significantly larger than that for the non-selective cells (3 out of 16, 18.8%; chi-squared test, P < 0.01). Identical effects are observed using R2 values adjusted for the large number of regressors in each model.
Complete descriptions of the stimuli, training, methods and data analyses are provided in the Supplementary Information.
Supplementary Material
Acknowledgements
We thank F. E. Theunissen for generously providing software and assistance for calculating STRFs, M. Konishi and L. M. Kay for valuable critiques of the manuscript, Z. Chi and S. Shea for helpful discussions, and D. Baleckaitis for histology. This work was supported by grants from the National Institutes of Health to T.Q.G. and D.M.
Footnotes
Competing interests statement The authors declare that they have no competing financial interests.
References
- 1.Kroodsma DE, Miller EH, editors. The Design of Animal Communication. MIT Press; Cambridge, Massachusetts: 1999. [Google Scholar]
- 2.Gentner TQ, Margoliash D. In: Acoustic Communication. Simmons AM, Popper AN, Fay RR, editors. Springer; New York: 2002. pp. 324–386. [Google Scholar]
- 3.Gentner TQ, Hulse SH, Bentley GE, Ball GF. Individual vocal recognition and the effect of partial lesions to HVc on discrimination, learning, and categorization of conspecific song in adult songbirds. J. Neurobiol. 2000;42:117–133. doi: 10.1002/(sici)1097-4695(200001)42:1<117::aid-neu11>3.0.co;2-m. [DOI] [PubMed] [Google Scholar]
- 4.Gentner TQ, Hulse SH. Perceptual classification based on the component structure of song in European starlings. J. Acoust. Soc. Am. 2000;107:3369–3381. doi: 10.1121/1.429408. [DOI] [PubMed] [Google Scholar]
- 5.Kroodsma DE, Miller EH, editors. Ecology and Evolution of Acoustic Communication in Birds. Cornell Univ. Press; Ithaca: 1996. [Google Scholar]
- 6.Eens M, Pinxten R, Verheyen RF. Temporal and sequential organization of song bouts in the starling. Ardea. 1989;77:75–86. [Google Scholar]
- 7.Gentner TQ, Hulse SH. Perceptual mechanisms for individual vocal recognition in European starlings, Sturnus vulgaris. Anim. Behav. 1998;56:579–594. doi: 10.1006/anbe.1998.0810. [DOI] [PubMed] [Google Scholar]
- 8.Vates GE, Broome BM, Mello CV, Nottebohm F. Auditory pathways of caudal telencephalon and their relation to the song system of adult male zebra finches. J. Comp. Neurol. 1996;366:613–642. doi: 10.1002/(SICI)1096-9861(19960318)366:4<613::AID-CNE5>3.0.CO;2-7. [DOI] [PubMed] [Google Scholar]
- 9.Müller CM, Leppelsack HJ. Feature-extraction and tonotopic organization in the avian auditory forebrain. Exp. Brain Res. 1985;59:587–599. doi: 10.1007/BF00261351. [DOI] [PubMed] [Google Scholar]
- 10.Sen K, Theunissen FE, Doupe AJ. Feature analysis of natural sounds in the songbird auditory forebrain. J. Neurophysiol. 2001;86:1445–1458. doi: 10.1152/jn.2001.86.3.1445. [DOI] [PubMed] [Google Scholar]
- 11.Margoliash D. Acoustic parameters underlying the responses of song-specific neurons in the white-crowned sparrow. J. Neurosci. 1983;3:1039–1057. doi: 10.1523/JNEUROSCI.03-05-01039.1983. [DOI] [PMC free article] [PubMed] [Google Scholar]
- 12.Margoliash D. Preference for autogenous song by auditory neurons in a song system nucleus of the white-crowned sparrow. J. Neurosci. 1986;6:1643–1661. doi: 10.1523/JNEUROSCI.06-06-01643.1986. [DOI] [PMC free article] [PubMed] [Google Scholar]
- 13.Leppelsack HJ, Vogt M. Responses of auditory neurons in forebrain of a songbird to stimulation with species-specific sounds. J. Comp. Physiol. 1976;107:263–274. [Google Scholar]
- 14.Scheich H, Langner G, Bonke D. Responsiveness of units in the auditory neostriatum of the guinea fowl (numida-meleagris) to species-specific calls and synthetic stimuli, 2: discrimination of iambus-like calls. J. Comp. Physiol. 1979;132:257–276. [Google Scholar]
- 15.Wang X, Kadia SC. Differential representation of species-specific primate vocalizations in the auditory cortices of marmoset and cat. J. Neurophysiol. 2001;86:2616–2620. doi: 10.1152/jn.2001.86.5.2616. [DOI] [PubMed] [Google Scholar]
- 16.Rauschecker JP, Tian B, Hauser M. Processing of complex sounds in the macaque nonprimary auditory cortex. Science. 1995;268:111–114. doi: 10.1126/science.7701330. [DOI] [PubMed] [Google Scholar]
- 17.Gilbert CD, Sigman M, Crist RE. The neural basis of perceptual learning. Neuron. 2001;31:681–697. doi: 10.1016/s0896-6273(01)00424-x. [DOI] [PubMed] [Google Scholar]
- 18.Bakin JS, Weinberger NM. Classical conditioning induces CS-specific receptive field plasticity in the auditory cortex of the guinea pig. Brain Res. 1990;536:271–286. doi: 10.1016/0006-8993(90)90035-a. [DOI] [PubMed] [Google Scholar]
- 19.Recanzone GH, Schreiner CE, Merzenich MM. Plasticity in the frequency representation of primary auditory cortex following discrimination training in adult owl monkeys. J. Neurosci. 1993;13:87–103. doi: 10.1523/JNEUROSCI.13-01-00087.1993. [DOI] [PMC free article] [PubMed] [Google Scholar]
- 20.Kilgard MP, Merzenich MM. Order-sensitive plasticity in adult primary auditory cortex. Proc. Natl Acad. Sci. USA. 2002;99:3205–3209. doi: 10.1073/pnas.261705198. [DOI] [PMC free article] [PubMed] [Google Scholar]
- 21.Kay LM, Laurent G. Odor- and context-dependent modulation of mitral cell activity in behaving rats. Nature Neurosci. 1999;2:1003–1009. doi: 10.1038/14801. [DOI] [PubMed] [Google Scholar]
- 22.Kilgard MP, Merzenich MM. Plasticity of temporal information processing in the primary auditory cortex. Nature Neurosci. 1998;1:727–731. doi: 10.1038/3729. [DOI] [PMC free article] [PubMed] [Google Scholar]
- 23.Logothetis NK, Pauls J, Poggio T. Shape representation in the inferior temporal cortex of monkeys. Curr. Biol. 1995;5:552–563. doi: 10.1016/s0960-9822(95)00108-4. [DOI] [PubMed] [Google Scholar]
- 24.Kobatake E, Wang G, Tanaka K. Effects of shape-discrimination training on the selectivity of inferotemporal cells in adult monkeys. J. Neurophysiol. 1998;80:324–330. doi: 10.1152/jn.1998.80.1.324. [DOI] [PubMed] [Google Scholar]
- 25.Rainer G, Asaad WF, Miller EK. Selective representation of relevant information by neurons in the primate prefrontal cortex. Nature. 1998;393:577–579. doi: 10.1038/31235. [DOI] [PubMed] [Google Scholar]
- 26.Rainer G, Miller EK. Effects of visual experience on the representation of objects in the prefrontal cortex. Neuron. 2000;27:179–189. doi: 10.1016/s0896-6273(00)00019-2. [DOI] [PubMed] [Google Scholar]
- 27.Tchernichovski O, Mitra PP, Lints T, Nottebohm F. Dynamics of the vocal imitation process: how a zebra finch learns its song. Science. 2001;291:2564–2569. doi: 10.1126/science.1058522. [DOI] [PubMed] [Google Scholar]
Associated Data
This section collects any data citations, data availability statements, or supplementary materials included in this article.