

Abstract
OBJECTIVES
Volume-outcome relationships for esophageal cancer resection have been well described with centers of excellence defined by volume. No consensus exists for what constitutes a “high volume” center. We aim to determine if an objective evidence-based threshold of operative volume associated with improvement in operative outcome for esophageal resections can be defined.
METHODS
Retrospective analysis was performed on patients undergoing esophageal resection for cancer in the 1998–2005 Nationwide Inpatient Sample. A series of multivariable analyses were performed, changing the resection volume cutoff to account for the range of annual hospital resections. The goodness-of-fit of each model was compared by pseudo r2, the amount of data variance explained by each model.
RESULTS
4,080 patients underwent esophageal resection. Median annual hospital resection volume was 4 (range:1–34). The mortality rate of “high volume” centers ranged from 9.94% (>=2 resection/yr) to 1.56% (>=30resections/yr). The best model was with an annual hospital resection volume >=15 (3.87% of data variance explained). The difference in goodness-of-fit between the best model and other models with different volume cutoffs was 0.64%, suggesting that volume explains <1% of variance in perioperative death.
CONCLUSIONS
Our data does not support the use of volume cutoffs for defining centers of excellence for esophageal cancer resections. Although volume has an incremental impact on mortality, volume alone is insufficient for defining centers of excellence. Volume appears to function as an imperfect surrogate for other variables, which may better define centers of excellence. Additional work is needed to identify these variables.
Introduction
Resection of the esophagus, either total or partial, is a complex surgical procedure, which carries a relatively high risk of operative mortality. Because of this, a significant body of work has focused on the relationship between volume and outcome for esophageal resections. The beneficial effect of increased volume of esophagectomy on outcome has been clearly demonstrated in multiple studies. (1–4) Based on the results of these, and similar studies, esophageal resection has been identified as a potential procedure for volume-based regionalization, and as such resection volume has been proposed as a measurement for defining centers of excellence. An example of this is the Leapfrog Group, which defined criteria for “evidence-based hospital referral” for esophageal resection as hospitals performing a minimum of 13 resections per year. (5)
In addition to the volume cutoff for esophageal resections set by the Leapfrog Group, various other thresholds for defining high volume centers have been used in the literature. These annual hospital volume thresholds range from 6 to 20 esophageal resections per year. (2, 6, 7) However, these cutoff points have often been imprecisely or arbitrarily defined and there is little data to support the use of specific volume cutoffs.
The aim of this study was, therefore, to determine if an objective, evidence-based threshold of operative volume associated with improved hospital-level outcomes for esophageal resection for cancer could be defined. Should this threshold be identified, it could potentially be considered a candidate in the criteria for defining high-volume hospitals for esophageal resection.
Methods
Data Source
A retrospective analysis was performed using patient data collected from the Nationwide Inpatient Sample (NIS) file between 1998 and 2003. The NIS database comprises comprised of discharge records approximating a 20% sample of hospital discharges in the United States, and is maintained by the Agency for Healthcare Research and Quality as part of the Healthcare Cost and Utilization Project. (8) It approximates 7 million patient discharge records per year, originating from approximately 1,000 different hospitals per year, nationwide. Data available within the NIS include patient and hospital demographics, payer information, treating and concomitant diagnoses, in-patient procedures, in-patient mortality and length of stay. (9) This study was approved by the Johns Hopkins Institutional Review Board, who exempted the need for patient consent.
Patient Population
Initial inclusion criteria for this study were patients from the NIS database older than 17 years of age admitted with the diagnosis of esophageal cancer as identified by the International Classification of Diseases, Ninth Revision (ICD-9) diagnosis codes (150.X). (10) Inclusion criteria was further limited to patients who underwent esophageal resection as identified by ICD-9 Clinical Modification (ICD-9-CM) procedure codes of 42.4 and 42.40 (esophagectomy NOS), 42.41 (partial esophagectomy), 42.42 (total esophagectomy), and 43.99 (esophagogastrectomy). (2)
Statistical Analysis
Multivariable analysis was performed with in-hospital death as the outcome of record from the discharge summaries. Independent variables included annual hospital resection volume, teaching status of the hospital at which the procedure was performed, the year the procedure was performed, patient age, gender, race and comorbidities as measured by the Charlson Index. The NIS dataset defines teaching hospital status as hospitals which have any American Medical Association-approved residency program, belong to the Council of Teaching Hospitals, or have a ratio of no more than 4:1 beds to full-time equivalent interns and residents. (11)
Patient comorbidities were standardized via calculation of the Deyo modification of the Charlson Index (12,13) per the methods of Romano et al. (14) A standardized calculation of patient health, the Charlson Index is determined by weighted scoring of comorbidities including cardiac, vascular, pulmonary, neurologic, endocrine, renal, hepatic, gastrointestinal, and immune diseases as well as any documented history of cancer.
Individual annual hospital procedure volume was determined by calculating the number of esophageal resections performed using NIS-assigned unique hospital identification numbers. The annual hospital mortality rate for esophageal resections was calculated using the NIS annual hospital resection volume for esophageal resections.
Esophageal resection volume was included as a dichotomous variable to identify the volume cutoff that best models outcome. A series of multiple sequential logistic regression models with a dependent variable of in-hospital death, a set of common independent variables including patient age, gender, race and Charlson Index of comorbidities, procedure year and hospital teaching status, and a sequentially changing independent variable of dichotomized annual hospital resection volume, were tested. This sequentially changing variable of annual hospital resection volume was dichotomized at 2 continuously up to 34, accounting for all of the esophageal resections in the NIS database in the time period studied. The resection volumes within this range are nearly continuous.
Each volume threshold dichotomizes the data and creates two categories for comparison: hospitals with annual resection volume less than that cutoff, and hospitals with annual resection volume greater than, or equal to, that cutoff. Each volume threshold is then taken forward in the multivariable regression analysis as the independent variable.
Statistical analysis was performed using the software package STATA 10.0 (College Station, TX). Bivariate analysis of categorical data was performed using the Chi Squared test. Analysis of continuous data was performed using Student’s t-test. Multivariable analysis was performed using linear and logistic regression models. A p-value of ≤0.05 was considered to be statistically significant. The goodness-of-fit, a measurement of the amount of variability in the data explained by the model, was tested for each model by calculation of McFadden’s pseudo r2 and the Area Under the Curve (AUC). McFadden’s pseudo r2 is one such measure of goodness-of-fit, and has been rescaled from 0 to 100% for ease of interpretation and comparison. It represents the percent of variance in a data pattern that is explained by the set of variables in a particular model. For instance, a model explaining 7% of the variation in the data would have a pseudo r2 of 0.07. Results are primarily reported as pseudo r2. (15–17) AUC is also reported, and improves as the value approaches 1.
Results
Patient Population
Analysis of the NIS dataset identified 53,168 patients with the diagnosis of esophageal cancer, of which 4,080 patients (7.7%) underwent esophageal resection, as defined by the previously-listed ICD-9-CM codes. Of these patients, 79.6% were male, and the median age was 64 years. These esophagectomies were performed at 1,506 hospitals. The median annual hospital resection volume was 4, with the range from 1 to 34 [Interquartile range (IQR) of 2 to 9]. Of the patients studied, 83.9% were white, 8.8% were black and the remainder of unreported race. A total of 2,883 patients (70.7%) underwent resection at teaching hospitals. The median Charlson Comorbidity Index for the 4.080 patients studied was 3, with an IQR of 2 to 8, a range of 2 to 14, out of a possible range from 0 to 33. Between 444 and 552 patients underwent esophageal resection per year. There were 387 in-hospital deaths for this patient group, resulting in an overall in-hospital mortality rate of 9.49%. See Table 1 for demographics.
Table 1.
Demographics of the study population.
| Characteristic | n | % |
|---|---|---|
| Esophageal Cancer Cases | 53,168 | |
| Esophageal Resections | 4,080 | 7.7% |
| Procedures by ICD-9-CM Codes: | ||
| 42.40 (esophagectomy NOS) | 134 | 3.3% |
| 42.41 (partial esophagectomy) | 1,633 | 40.0% |
| 42.42 (total esophagectomy) | 958 | 23.5% |
| 43.99 (esophagogastrectomy) | 1,393 | 34.1% |
| Age median years (Interquartile Range) | 64 | 56–71 |
| Male gender | 3,246 | 79.6% |
| Known Race: | 2,944 | |
| White | 2,471 | 83.9% |
| Black | 258 | 8.8% |
| Other | 215 | 7.3% |
| Median Charlson Index Score (Interquartile Range) | 3 | 2–8 |
| Surgery at Teaching Hospital | 2,883 | 70.7% |
| Median Annual Hospital | 4 | 2–9 |
| Resection Volume (Interquartile Range) | ||
| Year of Surgery: | ||
| 1998 | 506 | 12.4% |
| 1999 | 549 | 13.5% |
| 2000 | 444 | 10.9% |
| 2001 | 524 | 12.8% |
| 2002 | 531 | 13.0% |
| 2003 | 521 | 12.8% |
| 2004 | 453 | 11.1% |
| 2005 | 552 | 13.5% |
| In-hospital deaths | 387 | 9.5% |
Hospital volume-mortality relationship
The unadjusted annual in-hospital mortality rate was calculated for each hospital. This ranged between 0 and 100%, with a median value of 0 and a mean value of 11.5%. This is depicted in Figure 1.
Figure 1. Graph of in-hospital mortality rates for individual hospitals by annual hospital esophageal resection volume.
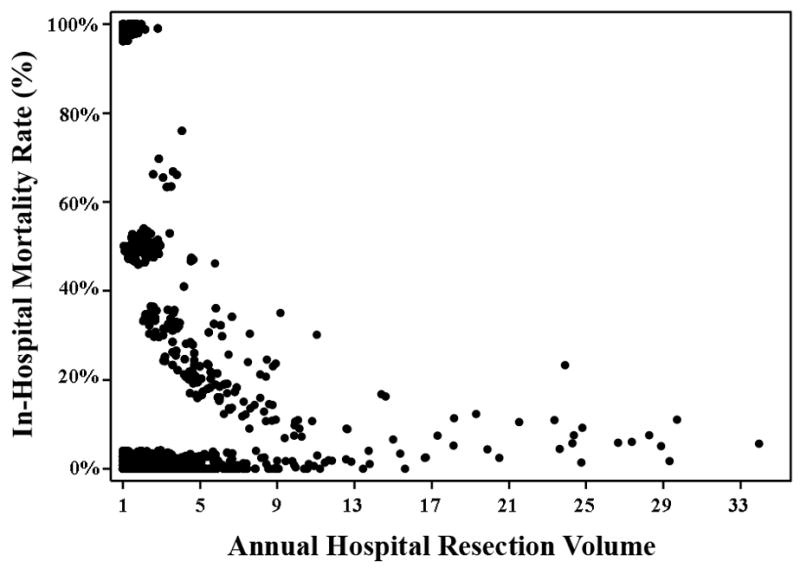
These data represent the annual hospital mortality rates of in-hospital death at 1,506 different hospitals. The data points have been staggered to illustrate the trend, due to the high frequency of overlapping values.
In-Hospital Mortality
A series of multiple logistic regression models were tested with a dependent variable of in-hospital death and common independent variables including patient age, gender, race and Charlson Index of comorbidities, procedure year, and hospital teaching status. In each model a sequentially changing variable of annual hospital resection volume threshold was inserted, dichotomizing volume into less than versus greater than or equal to that volume threshold. The mortality of patients at “high volume” and “low volume” hospitals defined at each threshold level, and the various representations of goodness-of-fit (McFadden’s pseudo r2 and AUC of that particular multiple logistic regression model), are presented in Table 2.
Table 2.
Mortality rates and goodness-of-fit to data of multiple high volume threshold models†.
| Volume Threshold | Mortality Rate at Centers with Volume Less than Volume Threshold (%) | Mortality Rate at Centers with Volume Equal to or Greater than Volume Threshold (%) | P-value | McFadden’s Pseudo r2 (shown as %) | AUC |
|---|---|---|---|---|---|
| Baseline | - | - | - | 3.23 | 0.6354 |
| 1 | - | 9.94% | - | 3.31 | 0.6364 |
| 2 | 13.31% | 8.63% | <0.001 | 3.43 | 0.6431 |
| 3 | 12.38% | 8.03% | <0.001 | 3.46 | 0.6430 |
| 4 | 11.54% | 7.71% | <0.001 | 3.35 | 0.6392 |
| 5 | 11.31% | 7.36% | <0.001 | 3.44 | 0.6414 |
| 6 | 11.04% | 7.09% | <0.001 | 3.43 | 0.6412 |
| 7 | 10.96% | 6.54% | <0.001 | 3.52 | 0.6425 |
| 8 | 10.86% | 6.35% | <0.001 | 3.56 | 0.6418 |
| 9 | 10.68% | 5.98% | <0.001 | 3.57 | 0.6435 |
| 10 | 10.58% | 5.37% | <0.001 | 3.73 | 0.6440 |
| 11 | 10.50% | 5.22% | <0.001 | 3.73 | 0.6440 |
| 12 | 10.35% | 5.31% | <0.001 | 3.79 | 0.6449 |
| 13* | 10.26% | 5.39% | <0.001 | 3.80 | 0.6450 |
| 14 | 10.22% | 5.50% | <0.001 | 3.76 | 0.6444 |
| 15 | 10.16% | 5.30% | <0.001 | 3.87 | 0.6465 |
| 16 | 10.14% | 5.26% | <0.001 | 3.87 | 0.6461 |
| 17 | 10.08% | 5.39% | 0.001 | 3.76 | 0.6441 |
| 18 | 10.01% | 5.57% | 0.002 | 3.67 | 0.6425 |
| 19 | 9.97% | 5.57% | 0.003 | 3.69 | 0.6428 |
| 20 | 9.95% | 5.10% | 0.002 | 3.64 | 0.6417 |
| 21 | 9.92% | 5.14% | 0.003 | 3.64 | 0.6417 |
| 23 | 9.92% | 4.87% | 0.002 | 3.69 | 0.6427 |
| 24 | 9.91% | 4.60% | 0.002 | 3.71 | 0.6437 |
| 25 | 9.83% | 4.33% | 0.004 | 3.70 | 0.6449 |
| 26 | 9.75% | 4.43% | 0.012 | 3.60 | 0.6430 |
| 27 | 9.71% | 4.52% | 0.021 | 3.50 | 0.6408 |
| 28 | 9.67% | 4.67% | 0.040 | 3.50 | 0.6408 |
| 29 | 9.63% | 4.92% | 0.080 | 3.40 | 0.6387 |
| 30 | 9.61% | 1.56% | 0.029 | 3.51 | 0.6390 |
| 34 | 9.54% | 2.94% | 0.191 | 3.31 | 0.6359 |
Multivariable logistic regression model adjusted for patient age, gender, race and Charlson Index of comorbidities, procedure year and hospital teaching status, and a sequentially changing independent variable of dichotomized annual hospital resection volume.
indicates the definition of “high volume” as suggested by the Leapfrog Group(5).
Table showing the relationship of different high volume thresholds to mortality rates and the goodness-of-fit [McFadden’s pseudo r2 and the Area Under the Curve (AUC)] of each model. An example of interpretation of the values for a volume threshold of 15 would signify that, on average, hospitals which perform greater than or equal to 15 esophageal resections per year have a mortality rate of 5.30%, compared to 10.16% at hospitals which perform less than 15 resections per year. The P-value for the χ2 statistic of these mortality rates is <0.001, and this model has a pseudo r2 of 3.87% and AUC of 0.6465.
The values presented represent the average mortality rate for all hospitals with esophagectomy volumes less than the volume threshold, as well as the average mortality rate for all hospitals with esophagectomy volumes greater than, or equal to, the volume threshold. An example of interpretation of the values for a volume threshold of 15 would signify that hospitals which perform greater than or equal to 15 resections per year have an average post-operative mortality rate of 5.30%, compared to an average post-operative mortality rate of 10.16% at hospitals which perform less than 15 esophageal resections per year (P<0.001). Comparison of mortality rates of hospitals with annual esophagectomy volumes for esophageal cancer above and below each volume threshold reveals that they are significantly different for all volume thresholds compared (P<0.05), except when volume is greater than or equal to 29 esophagectomies/year (P=0.08) and greater than or equal to 34 esophagectomies/year (P=0.19). These results are depicted graphically in Figure 2.
Figure 2. Graph showing the different mortality rates above and below each volume threshold.
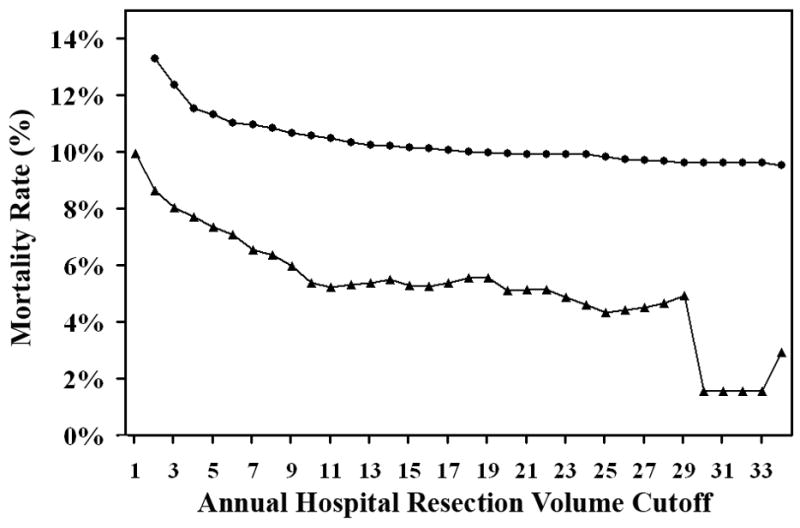
Squares indicate the mortality rates of hospitals with annual esophagectomy volumes for esophageal cancer less than the volume threshold. Triangles indicate the mortality rates of hospitals with annual esophagectomy volumes for esophageal cancer greater or equal to the volume threshold. The difference between each pair of mortality rates at a given annual hospital volume is statistically significant for all volume thresholds except ≥29 and ≥34. Associated data are listed in Table 2.
The goodness-of-fit of different models with different volume thresholds, as measured by McFadden’s pseudo r2, ranged from a baseline of 3.23%, where the volume variable is not included in the model, to 3.87%. The models with the best fit to data were those that defined high-volume threshold at 15 and 16, with McFadden’s pseudo r2 of 0.0387 or 3.87%. It should be noted that, when the volume threshold was set at 13 as suggested by the Leapfrog Group, the resulting model had a McFadden’s pseudo r2 of 3.80%. A graphical depiction of the changes in goodness-of-fit as defined by McFadden’s pseudo r2 of different volume thresholds is shown in Figure 3. The goodness-of-fit for the dichotomous model improved as the volume threshold was raised from 1 to 15, peaking at a threshold of 15 resections per year. Subsequently, the goodness-of-fit of the model deteriorated as the volume threshold was further raised.
Figure 3. Graph of goodness-of-fit versus annual hospital resection volume.
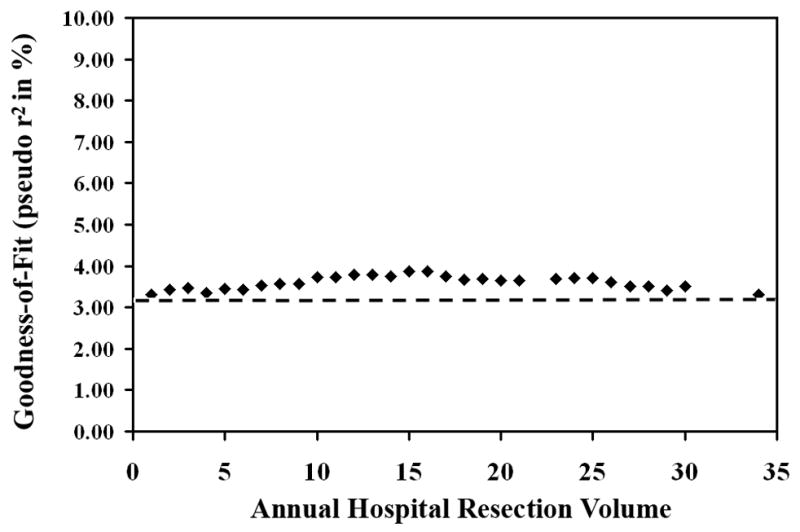
Each point represents one resection volume. McFadden’s pseudo r2 is shown as percent. Dashed line represents “baseline” McFadden’s pseudo r2 from the model without resection volume (3.23%).
Results from calculation of the AUC as a measure of goodness-of-fit are reported in Table 2. The range in the calculated values of AUC is similar to that of the McFadden’s pseudo r2, therefore our discussion focuses on the results of the McFadden’s pseudo r2.
Conclusions
Much attention has been focused on defining centers of excellence. To date, the role of hospital volume has been emphasized. Using the NIS dataset, we examined the relationship between surgical volume and mortality. We found this well-established inverse relationship to persist in the NIS dataset. This is demonstrated in Figure 1, where a clear trend towards diminishing unadjusted annual in-hospital mortality is present.
Given the well-established inverse relationship between esophageal resection volume and in-hospital mortality, we sought to use statistical modeling to define a single value cutoff at which there is significantly reduced mortality. This would allow us to better determine hospital operative volumes required for improved outcomes for esophageal resection for cancer.
On analysis of dichotomous volume cutoff modeling, we found a statistically significant difference between mortality rates at hospitals with esophagectomy volumes above the volume threshold in comparison to mortality rates of hospitals with esophagectomy volumes below the volume threshold, irrespective of annual hospital resection volume cutoff, as shown in Figure 2. For example, defining high volume at 13 or more, as suggested by the Leapfrog Group,(5) the resulting high volume hospitals have a mortality rate of 5.39% in comparison to 10.26% at low volume hospitals (P<0.001). However, even defining the high volume threshold at a volume of two resections per year produces significant differences in mortality rates between hospitals with esophagectomy volumes above and below that threshold. Our study confirms previous findings by Christian et al., who have also shown that the Leapfrog standards may not have been optimal for other surgical procedures; for example, they empirically found very different thresholds for coronary artery bypass graft, abdominal aortic aneurysm, and esophagectomies compared to the Leapfrog standards; moreover, in contrast to Leapfrog, they found no good empirical threshold for carotid endarterectomies. (18)
This finding reveals the true conundrum of volume modeling: no matter what the volume cutoff is set at, the mortality rates above and below it are almost always significantly different. Therefore, in order to determine the best model for high-volume centers, we examined goodness-of-fit of the model to the data, instead of differences in mortality.
When multiple logistic regression of in-hospital death following esophageal resection includes the variables of patient age, gender, race and Charlson Index of comorbidities and calendar year, but not resection volume, the resulting model explains 3.23% of the variance in the data. Adding hospital volume as a dichotomous variable, ranging from 2 to 34 resections per year, improves the explanatory power of the model, with pseudo r2 ranging between 3.35% and 3.87%. Using these criteria, the best model is one that defines a “high volume” cutoff as 15 or more esophageal resections per hospital per year, as this has the highest McFadden’s pseudo r2 value, and accounts for the most variability in the data. It is interesting to note that the inclusion of volume into the multivariable model only accounts for a maximum of 0.64% of the variability in the data. Therefore, varying the volume threshold did not change the explanatory power of the different dichotomous volume models for defining high volume centers for esophageal resection substantially. This is noteworthy given the attention that resection volume for esophageal surgery, among other procedures, has been afforded in the literature.
While there is an overall trend of increased operative volume associated with decreased post-operative mortality, a curious finding is present in Table 2, where the mortality rate at centers with annual resection volumes equal to, or greater than, the volume threshold tested do not necessarily have continuously diminishing values. The mortality rates given in Table 2 are calculated by averaging the mortality rates of every hospital which perform esophagectomies above or below the volume threshold. As can be seen, increased volume does not strictly correlate with decreased postoperative, inhospital mortality. Therefore, factors other than annual hospital volume must certainly contribute to mortality rate.
The NIS database was chosen over other available databases due to the extensive nature of its records and the ability to provide a large sample size with which to compare outcomes across the United States. Like analysis of all administrative databases, the current analysis has several limitations. They include the retrospective database design and the associated constraints at the level of the data used for analysis, the inability to account for surgeon experience, the difficulty in examining other postoperative outcomes such as cause of death, and the inability to measure 30-day mortality, as opposed to inhospital death. In examining the NIS database, we are unable to check the accuracy of the diagnostic and procedure coding. While the validity of the coding may be verified, the appropriateness of the coding used for diagnosis and procedures may not. However, we assume that this type of error would be equally distributed across all groups of interest. The overall in-hospital mortality rate of 9.49% is consistent with reported mortality rates of other large series using 30-day mortality(19), adding validity to the data reported in the NIS database, and our use of in-hospital mortality as an outcome. In addition, it has been argued that for complex operations, in-hospital mortality may be a better measure of postoperative mortality than 30-day mortality, due to improved capabilities of intensive care management to rescue critically ill patients. (11)
Other outcomes, such as complications associated with surgery or perioperative care, and post-discharge outcomes, including deaths occurring outside of the surgical hospitalization, are not ascertainable from this database. Complications occurring after surgery can not be differentiated from comorbidities existing preoperatively. This prevents us from examining and comparing postoperative complications. In addition, as these patients have undergone esophagectomy for cancer, it would be meaningful to measure disease-free and overall survival. When calculating the Charlson Index we assume that preexisting conditions and those same conditions arising after surgery have the same impact on patient outcomes. Proxies of non-death hospital outcome, including need for postoperative procedural intervention and length of hospital stay, have been utilized by others studying different databases. (20,21)
There has been much recent postulation as to factors which influence postoperative outcomes at the hospital-level. These focus on processes of care, which may be associated with improved outcome after surgery. Billingsley, et al, (21) have correlated improved outcomes after surgery for colon cancer with the presence of solid organ transplantation teams, as a proxy for patient care indices associated with improved postoperative outcomes. Other processes of care studied and correlated to improved outcomes include dedicated surgical intensive care units managed by dedicated intensive care specialists,(3, 22) patient safety initiatives,(23) and the use of multidisciplinary teams and standardized clinical care pathways at high volume centers for example. (24) We believe it likely that these hospital-level processes of care are more readily available at high-volume centers, and as such, high-volume status may serve as a proxy for them in large administrative databases such as the NIS.
We show that, although there is a trend towards an inverse relationship between volume and mortality, volume is not sufficient for defining centers of excellence. Volume appears to function as an imperfect surrogate for other variables, which may better define centers of excellence, such as quality of dedicated intensive care, postoperative monitoring, clinical care pathways, and other processes of care. (20, 21, 25, 26) Additional work is needed to identify those variables associated with improved outcome after esophageal resection.
In addition, using a comparison of mortality rates of, and goodness-of-fit of different volume thresholds, we were unable to identify a clear, optimal volume threshold for improved outcomes after esophagectomy for esophageal cancer. We conclude that the use of volume thresholds alone for determining centers of excellence does not appropriately represent the variance in the data, and does not necessarily guide appropriate decision making and should be avoided.
Acknowledgments
Dr. Robert A. Meguid and Dr. Eric S. Weiss were supported on the Ruth L. Kirschstein National Research Service Award (T32DK007713) while undertaking this study. In addition, Dr. Eric S. Weiss is Irene Piccinini Investigator in Cardiac Surgery. The authors would like to thank Nita Ahuja, MD, for her critical review of the methods employed in this study.
Biography

Footnotes
Publisher's Disclaimer: This is a PDF file of an unedited manuscript that has been accepted for publication. As a service to our customers we are providing this early version of the manuscript. The manuscript will undergo copyediting, typesetting, and review of the resulting proof before it is published in its final citable form. Please note that during the production process errors may be discovered which could affect the content, and all legal disclaimers that apply to the journal pertain.
References
- 1.Luft HS, Bunker JP, Enthoven AC. Should operations be regionalized? The empirical relation between surgical volume and mortality. N Engl J Med. 1979;301:1364–1369. doi: 10.1056/NEJM197912203012503. [DOI] [PubMed] [Google Scholar]
- 2.Begg CB, Cramer LD, Hoskins WJ, Brennan MF. Impact of hospital volume on operative mortality for major cancer surgery. Jama. 1998;280:1747–1751. doi: 10.1001/jama.280.20.1747. [DOI] [PubMed] [Google Scholar]
- 3.Dimick JB, Cattaneo SM, Lipsett PA, Pronovost PJ, Heitmiller RF. Hospital volume is related to clinical and economic outcomes of esophageal resection in Maryland. Ann Thorac Surg. 2001;72:334–339. doi: 10.1016/s0003-4975(01)02781-3. discussion 339-341. [DOI] [PubMed] [Google Scholar]
- 4.Kuo EY, Chang Y, Wright CD. Impact of hospital volume on clinical and economic outcomes for esophagectomy. Ann Thorac Surg. 2001;72:1118–1124. doi: 10.1016/s0003-4975(01)02962-9. [DOI] [PubMed] [Google Scholar]
- 5.Leapfrog Group “Evidence-based hospital referral” for esophageal cancer. 2003: leapfroggroup.org, accessioned Nov 21, 2006.
- 6.Chang AC, Birkmeyer JD. The volume-performance relationship in esophagectomy. Thorac Surg Clin. 2006;16:87–94. doi: 10.1016/j.thorsurg.2006.01.008. [DOI] [PubMed] [Google Scholar]
- 7.Milstein A, Galvin RS, Delbanco SF, Salber P, Buck CR., Jr Improving the safety of health care: the leapfrog initiative. Eff Clin Pract. 2000;3:313–316. [PubMed] [Google Scholar]
- 8.Healthcare Cost and Utilization Project (HCUP) Nationwide Inpatient Sample. Rockville, MD: Agency for Healthcare Research and Quality; 2005. [PubMed] [Google Scholar]
- 9.Ahuja N, Chang D, Gearhart SL. Disparities in Colon Cancer Presentation and In-Hospital Mortality in Maryland: A Ten-Year Review. Ann Surg Oncol. 2007;14:411–416. doi: 10.1245/s10434-006-9130-9. [DOI] [PubMed] [Google Scholar]
- 10.International Classification of Diseases, Ninth Revision. 9. Washington, DC: Public Health Service, US Department of Health and Human Services; 1988. [Google Scholar]
- 11.Casson AG, van Lanschot JJ. Improving outcomes after esophagectomy: the impact of operative volume. J Surg Oncol. 2005;92:262–266. doi: 10.1002/jso.20368. [DOI] [PubMed] [Google Scholar]
- 12.Charlson ME, Pompei P, Ales KL, MacKenzie CR. A new method of classifying prognostic comorbidity in longitudinal studies: development and validation. J Chronic Dis. 1987;40:373–383. doi: 10.1016/0021-9681(87)90171-8. [DOI] [PubMed] [Google Scholar]
- 13.Deyo RA, Cherkin DC, Ciol MA. Adapting a clinical comorbidity index for use with ICD-9-CM administrative databases. J Clin Epidemiol. 1992;45:613–619. doi: 10.1016/0895-4356(92)90133-8. [DOI] [PubMed] [Google Scholar]
- 14.Romano PS, Roos LL, Jollis JG. Adapting a clinical comorbidity index for use with ICD-9-CM administrative data: differing perspectives. J Clin Epidemiol. 1993;46:1075–1079. doi: 10.1016/0895-4356(93)90103-8. discussion 1081-1090. [DOI] [PubMed] [Google Scholar]
- 15.Allison PD. Comparing logit and probit coefficients across groups. Sociological Methods and Research. 1999;28:186–208. [Google Scholar]
- 16.Long JS, Freese J. Regression Models for Categorical Dependent Variables Using Stata. 2. College Station TX: Stata Press; 2006. [Google Scholar]
- 17.Long JS. Regression Models for Categorical and Limited Dependent Variables. Thousand Oaks, CA: Sage Publications; 1997. [Google Scholar]
- 18.Christian CK, Gustafson ML, Betensky RA, Daley J, Zinner MJ. The Leapfrog volume criteria may fall short in identifying high-quality surgical centers. Ann Surg. 2003;238:447–455. doi: 10.1097/01.sla.0000089850.27592.eb. discussion 455-7. [DOI] [PMC free article] [PubMed] [Google Scholar]
- 19.Bailey SH, Bull DA, Harpole DH, Rentz JJ, Neumayer LA, Pappas TN, Daley J, Henderson WG, Krasnicka B, Khuri SF. Outcomes after esophagectomy: a ten-year prospective cohort. Ann Thorac Surg. 2003;75:217–222. doi: 10.1016/s0003-4975(02)04368-0. discussion 222. [DOI] [PubMed] [Google Scholar]
- 20.Birkmeyer JD, Dimick JB. Potential benefits of the new Leapfrog standards: effect of process and outcomes measures. Surgery. 2004;135:569–575. doi: 10.1016/j.surg.2004.03.004. [DOI] [PubMed] [Google Scholar]
- 21.Billingsley KG, Morris AM, Dominitz JA, Matthews B, Dobie S, Barlow W, Wright GE, Baldwin LM. Surgeon and hospital characteristics as predictors of major adverse outcomes following colon cancer surgery: understanding the volume-outcome relationship. Arch Surg. 2007;142:23–31. doi: 10.1001/archsurg.142.1.23. discussion 32. [DOI] [PubMed] [Google Scholar]
- 22.Angus DC, Shorr AF, White A, Dremsizov TT, Schmitz RJ, Kelley MA. Critical care delivery in the United States: distribution of services and compliance with Leapfrog recommendations. Crit Care Med. 2006;34:1016–1024. doi: 10.1097/01.CCM.0000206105.05626.15. [DOI] [PubMed] [Google Scholar]
- 23.Makary MA, Sexton JB, Freischlag JA, Millman EA, Pryor D, Holzmueller C, Pronovost PJ. Patient safety in surgery. Ann Surg. 2006;243:628–632. doi: 10.1097/01.sla.0000216410.74062.0f. discussion 632-625. [DOI] [PMC free article] [PubMed] [Google Scholar]
- 24.Zehr KJ, Dawson PB, Yang SC, Heitmiller RF. Standardized clinical care pathways for major thoracic cases reduce hospital costs. Ann Thorac Surg. 1998;66:914–919. doi: 10.1016/s0003-4975(98)00662-6. [DOI] [PubMed] [Google Scholar]
- 25.Birkmeyer JD, Sun Y, Goldfaden A, Birkmeyer NJ, Stukel TA. Volume and process of care in high-risk cancer surgery. Cancer. 2006;106:2476–2481. doi: 10.1002/cncr.21888. [DOI] [PubMed] [Google Scholar]
- 26.Hannan EL, Popp AJ, Feustel P, Halm E, Bernardini G, Waldman J, Shah D, Chassin MR. Association of surgical specialty and processes of care with patient outcomes for carotid endarterectomy. Stroke. 2001;32:2890–2897. doi: 10.1161/hs1201.099637. [DOI] [PubMed] [Google Scholar]