Abstract
The pro-arrhythmic Long QT syndrome (LQT) is linked to 10 different genes (LQT1–10). Approximately 40% of genotype-positive LQT patients have LQT2, which is characterized by mutations in the human ether-a-go-go related gene (hERG). hERG encodes the voltage-gated K+ channel α-subunits that form the pore of the rapidly activating delayed rectifier K+ current in the heart. The purpose of this study was to elucidate the mechanisms that regulate the intracellular transport or trafficking of hERG, because trafficking is impaired for about 90% of LQT2 missense mutations. Protein trafficking is regulated by small GTPases. To identify the small GTPases that are critical for hERG trafficking, we coexpressed hERG and dominant negative (DN) GTPase mutations in HEK293 cells. The GTPases Sar1 and ARF1 regulate the endoplasmic reticulum (ER) export of proteins in COPII and COPI vesicles, respectively. Expression of DN Sar1 inhibited the Golgi processing of hERG, decreased hERG current (IhERG) by 85% (n ≥ 8 cells per group, *, p < 0.01), and reduced the plasmalemmal staining of hERG. The coexpression of DN ARF1 had relatively small effects on hERG trafficking. Surprisingly, the coexpression of DN Rab11B, which regulates the endosomal recycling, inhibited the Golgi processing of hERG, decreased IhERG by 79% (n ≥ 8 cells per group; *, p < 0.01), and reduced the plasmalemmal staining of hERG. These data suggest that hERG undergoes ER export in COPII vesicles and endosomal recycling prior to being processed in the Golgi. We conclude that hERG trafficking involves a pathway between the ER and endosomal compartments that influences expression in the plasmalemma.
The human KCNH2 or ether-a-go-go related gene (hERG)3 encodes the voltage-gated K+ channel α-subunits that oligomerize to form the pore of the rapidly activating delayed rectifier K+ current (IKr) in cardiac myocytes (1–3). Hundreds of hERG mutations are linked to the congenital pro-arrhythmic Type 2 Long QT syndrome (LQT2) and functional studies suggest that these mutations result in a loss of normal hERG K+ channel (hERG) function (4, 5). In LQT2, missense mutations are the dominant abnormality and many LQT2 missense mutations reduce hERG K+ current (IhERG) by decreasing the intracellular transport or trafficking of hERG to the Golgi apparatus (Golgi) and the cell surface membrane (plasmalemma) (6). Therefore, disruption of hERG K+ channel trafficking appears to be a principal mechanism for disease.
Movement of proteins between membrane-bound intracellular compartments is mediated by small transport vesicles, which bud from a donor compartment to fuse with an appropriate acceptor compartment. The trafficking of many transmembrane and secretory proteins between the ER and Golgi compartments is dependent on the small GTPases ADP-ribosylation factor 1 (ARF1) and Sar1, which regulate the formation of coat-associated protein complex I (COPI) and II (COPII) vesicles, respectively (7–19). These small GTPases facilitate the polymerization of transport vesicle protein coats on the donor membrane. Vesicular cargo selection, docking, and fusion to the target membrane are regulated by adaptor proteins, SNARE proteins, and Rab GTPases. To rationally develop novel therapeutic targets that may increase the expression of trafficking-deficient LQT2 mutant channels, the molecular mechanisms that regulate the trafficking of hERG need to be explored. The purpose of this study is to identify transport proteins that regulate the trafficking of wild type (WT) hERG. We used a strategy of testing specific WT GTPases or ones containing dominant negative (DN) mutations to interfere with their function.
EXPERIMENTAL PROCEDURES
Human Heart cDNA Library and Cloning—Polymerase chain reaction primers were designed to clone Sar1, ARF1, Rab6A, and Rab6B based on the published cDNA (NCBI accession NM_020150, NM_001024227, and NM_002869). Oligonucleotide primers were synthesized by Integrated DNA Technologies (IDT, Coralville, IA). Polymerase chain reactions contained 5.0 μl of total DNA from the reverse transcription reaction of human heart as template, 20 mm Tris-HCl, pH 8.8, 10 mm KCl, 10 mm (NH4)2SO4, 2.0 mm MgSO4, 0.1% Triton X-100, 0.1 mg/ml bovine serum albumin, 2.0 μm each dATP, dCTP, dGTP, dTTP, 75 pmol of each primer, 5 units of Taq Extender Additive (Stratagene, La Jolla, CA), 25 units of TaqDNA Polymerase (Fisher Scientific). PCR reactions were initially denatured at 94 °C for 3 min, they were cycled at 94 °C for 45 s, 55 °C for 45 s, and 72 °C for 2 min 45 times, followed by 72 °C for 7 min. Amplified cDNA fragments were analyzed by 0.75–1.5% agarose gel electrophoresis and visualized by ethidium bromide staining under UV light. Each fragment was purified from the agarose gel using the QIAquick Gel Extraction kit (Qiagen, Valencia, CA). cDNA fragments were cloned into pcDNA 3.1-V5-polyhistidine vectors using the TOPO TA Cloning method (Invitrogen) as previously described (20). Cloned RT-PCR fragments were sequenced and analyzed by the University of Wisconsin Biotechnology Center, Madison, WI. Other Rab transcripts were purchased from Origene (Rockville, MD) or GeneCopoeia, Inc. (Germantown, MD). These cDNAs were sequenced and subcloned into the pcDNA 3.1-V5-polyhistidine expression vectors. The Rab11B green fluorescent protein (GFP) fusion proteins were kindly provided by Dr. Beate Schlierf (Institut für Biochemie, Universität Erlangen-Nürnberg, Erlangen, Germany) (21).
Site-directed Mutagenesis—The appropriate nucleotide changes to generate the dominant negative mutations: H79G-Sar1, Q71L-ARF1, Q72L-Rab6A, Q72L-Rab6B, N124I-Rab11A, and N124-Rab11B were engineered in WT Sar1, ARF1, Rab6A, Rab6B, Rab11A, and Rab11B cDNA using the QuikChange Site-directed Mutagenesis kit (Stratagene) (17, 22–27). The Sar1 and H79G-Sar1 clones were modified to include the polyhistidine tag –ASHHHHHH (WT-Sar1-His and H79G-Sar1-His) at the C terminus of the translated protein. The addition of the polyhistidine tag did not alter the effect of coexpressing Sar1 or H79G-Sar1 (data not shown). The integrity of all the constructs was verified by DNA sequencing (University of Wisconsin-Madison, Biotechnology Center).
Cell Lines and Drug Exposure—Expression of hERG and the WT or mutant Sar1, ARF1, Rab6A, Rab6B, Rab11A, or Rab11B constructs was performed by transiently transfecting 1.5 μgof hERG cDNA and 1.5 μg of Sar1, ARF1, Rab6A, Rab6B, Rab11A, or Rab11B cDNA using Superfect (Qiagen, Valencia, CA). For control conditions, cells were transfected with 1.5 μg of hERG cDNA and 1.5 μg of the pcDNA3 vector without cDNA subcloned into the vector (blank vector). The cells were cultured in MEM (with 10% fetal bovine serum) at 37 °C and analyzed 48 h after transfection. In some experiments, cells were also transfected with cDNA encoding Kir2.1 (kindly provided by Dr. Jonathan Makielski, University of Wisconsin-Madison) or vesicular stomatitis virus ts045 G (VSVG) protein fused to GFP (VSVG-GFP, kindly provided by Dr. Jennifer Lippincott-Schwartz from the National Institutes of Health) (28, 29). For VSVG-GFP experiments 1 μg of hERG, 1 μg of ARF1, or Q71L-ARF1, and 1 μg of VSVG-GFP cDNA were transiently transfected using Superfect. VSVG is a transmembrane glycoprotein that is often used to study protein trafficking. The trafficking of VSVG is temperature-sensitive, so to facilitate the trafficking of VSVG-GFP out of the ER the cells were cultured in MEM at 32 °C for 12 h prior to analyses.
Electrophysiology—IhERG or Kir2.1 current (IKir2.1) were measured using the whole-cell patch clamp technique as described previously (30, 31). The extracellular (bath) solution contained (in mm) 137 NaCl, 4 KCl, 1.8 CaCl2, 1 MgCl2,10 glucose, and 10 HEPES (pH 7.4 with NaOH), and the intracellular pipette solution contained (in mm) 130 KCl, 1 MgCl2,5 EGTA, 5 MgATP, and 10 HEPES (pH 7.2 with KOH). For experiments using hERG expression, the holding potential was –80 mV, and the baseline (zero current) is indicated as a dotted line in the figures. The cells were depolarized to 50 mV for 3 s to maximally activate IhERG, followed by a test-pulse to –120 mV for 3 s to measure the peak tail IhERG. For experiments using Kir2.1 expression, the holding potential was –60 mV, and cells were pulsed from –120 mV to 50 mV for 1 s in 10-mV increments. All voltage clamp experiments were performed at 22–23 °C within 1–2 h after removing the cells from their culture conditions. IhERG and IKir2.1 were normalized to cellular capacitance. The relative IhERG was calculated by dividing IhERG and the corresponding standard error (S.E.) with the mean IhERG in control conditions. The relative IKir2.1 was calculated similarly by using the mean IKir2.1 measured at –120 mV in control conditions. Voltage protocols and data analyses were done using the pCLAMP 8.0 (Axon Instruments, Union City, CA) and Origin (6.0 and 7.5, Microcal, North Hampton, MA) computer software.
Western Blot—The Western blot procedure for hERG was previously described (30), and the procedure that was used for Western analyses of polyhistidine-tagged Sar1 proteins was done similarly. Briefly, whole cell lysates of similarly confluent cultures were generated by solubilizing cells in Nonidet P-40 lysis buffer (1% Nonidet P-40, 150 mm NaCl, 10% glycerol, 5 mm EDTA, and 50 mm Tris-HCl, pH 7.4). Equal amounts of protein and Laemmli buffer with a final [DTT] of 100 mm were mixed and heated for 10 min at 60 °C and subjected to 6.5% or 10% SDS-polyacrylamide gel electrophoresis, followed by electrophoretic transfer onto nitrocellulose membranes. Nitrocellulose membranes were incubated overnight with an anti-hERG antibody directed against the C terminus (31) or an anti-polyhistidine antibody (Invitrogen). After washing off the anti-hERG or anti-polyhistidine antibodies the membranes were then incubated in anti-rabbit IgG horseradish peroxidase-linked antibody (Amersham Biosciences) or anti-mouse IgG horseradish peroxidase-linked antibody (Bio-Rad). The horseradish peroxidase-linked antibodies were detected using the ECL detection kit (Amersham Biosciences).
Immunocytochemistry and Confocal Imaging—The labeling of hERG for single labeling experiments was performed as described previously (32). For double labeling experiments HEK293 cells were plated in 35-mm Petri dishes containing collagen-coated coverslips. Cells were fixed with 4% buffered paraformaldehyde for 10 min, permeabilized with Triton X-100 (0.1%) for 10 min, and rinsed in 0.75% glycine buffer for 10 min to quench residual background aldehyde signal. Cells were then incubated with 2 ml of blocking solution (10% goat serum, 0.05% NaN3 in PBS) for 1 h to block nonspecific binding sites, and the cells were subsequently incubated with the anti-hERG and anti-polyhistidine (Invitrogen) antibodies in 10% goat serum (Invitrogen) in PBS at room temperature. Excess antibody was washed off with three 10-min long rinses of blocking solution. The cells were then incubated with Highly Cross-absorbed Alexa Fluor 568 Goat Anti-rabbit IgG (H+L) antibody (1:5000; Inc. 2 mg/ml) (Invitrogen) and the Highly Cross absorbed Alexa Fluor 488 Goat Anti-mouse IgG (H+L) antibody (1:500, 2 mg/ml) (Invitrogen) in the blocking solution. The cells were washed for four 10-min-long treatments with blocking solution alone. After the final wash, the coverslips bearing the stained cells were mounted on slides in 50% glycerol in PBS. Imaging was performed with a Bio-Rad MRC 1024 laser scanning confocal microscope equipped with a mixed gas (Ar/Kr) laser operated by 24-bit Lasersharp software. Z-scan sections were taken at 0.5 μm. Data are shown as a single z-scan image or as a series of stacked z-scan images (20–25 sections) to yield three-dimensional images.
Live Cell Western Technique—Nontransfected HEK293 cells or cells expressing hERG and WT or mutant small GTPases (H79G-Sar1, Q71L-ARF1, N124I-Rab11A, or N124I-Rab11B) were plated into collagen-coated 24-well tissue culture plates and cultured overnight. For imaging, the cell culture media (MEM with 10% fetal bovine serum) was supplemented for 1 h with a primary hERG antibody (Alomone Labs, Jerusalem, Israel) that recognizes an extracellular epitope in S1-S2 (1:100) at 37 °C in 5% CO2. The cells were washed for 10 min three times with cell culture media at 37 °C in 5% CO2. The cells were then cultured for 1 h in the secondary antibody IRDye 680 Goat Anti-Rabbit (1:10000) (Li-cor Biosciences, Lincoln, NE) at 37 °C in 5% CO2. Cells were then washed once in PBS for 10 min. The cells were imaged using the Li-cor Odyssey infrared imaging system (Li-cor Biosciences, Lincoln, NE) and the intensity of the 700-nm infrared signal for each well was quantified using the Li-cor Odyssey infrared imaging system software. The mean intensity of the wells that contain untransfected cells was subtracted from the intensity of cells expressing hERG K+ in control or with WT or DN GTPases to correct for any background signal not related to hERG staining.
Statistics—Initially an ANOVA was performed on data sets (p < 0.05 was considered significant). In order to identify whether an experimental group(s) differed from control, we performed a Student's t-tests (p < 0.01 was considered significant).
RESULTS
Sar1 Regulates the ER Export of hERG—The small GTPase Sar1 regulates the ER export of many transmembrane and secretory proteins in COPII vesicles. We tested the hypothesis that the trafficking of hERG is regulated by Sar1. We coexpressed hERG with WT or the DN Sar1 mutation, H79G, in HEK293 cells. The trafficking of hERG to the Golgi can be detected using Western blot because hERG is a glycoprotein; hERG subunits are synthesized as immature, core-glycosylated 135-kDa proteins in the ER, and undergo glycosylation in the Golgi (Golgi processing), which increases their MW to the mature, complexly glycosylated 155-kDa protein (4, 30, 31). The mature subunits are predominately expressed at the plasmalemma, because the 155-kDa protein band visualized on Western blot is degraded by the extracellular application of serine proteases to intact cells (33).
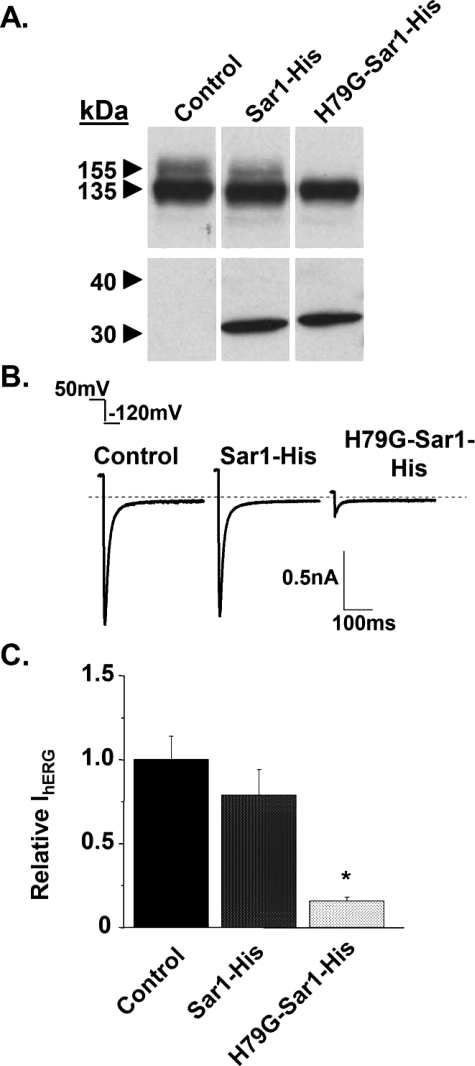
Fig. 1A shows representative Western blot analysis of lysates from cells transiently expressing hERG in control conditions, with Sar1-His, or with H79G-Sar1-His (n = 4). For control conditions, cells were transfected with 1.5 μg of hERG cDNA and 1.5 μg of the blank vector. Expression of hERG and WT or mutant Sar1, was performed by transiently transfecting 1.5 μg of hERG cDNA and 1.5 μg of Sar1-His or H79G-Sar1-His cDNA. In control lysates and lysates isolated from cells expressing Sar1-His, the immature (135 kDa) and mature (155 kDa) hERG subunit bands are present (top blot). Cells expressing H79G-Sar1-His lack the mature hERG subunit band, suggesting that the expression of H79G-Sar1-His prevents the trafficking of hERG to the Golgi. Fig. 1A also shows the corresponding Sar1-His or H79G-Sar1-His protein bands that were detected using an anti-polyhistidine antibody (bottom blot).
FIGURE 1.
H79G-Sar1-His inhibits the trafficking of hERG. A, Western blot analysis of HEK293 cells transiently expressing hERG without (control) or with Sar1-His or H79G-Sar1-His. The top row shows the immunoblot probed with the anti-hERG antibody. The bottom row shows the immunoblot probed with the anti-polyhistidine antibody. B, representative tail IhERG measured from control cells and cells coexpressing Sar1-His or H79G-Sar1-His. C, the relative mean peak tail IhERG calculated from the same groups of cells.
We measured the expression of hERG at the plasmalemma using the whole cell patch clamp technique to record IhERG. Cells were pre-pulsed from a holding potential of –80 mV to 50 mV for 3 s to maximally activate hERG and then we applied a test pulse to –120 mV to measure the corresponding inward tail IhERG (32). Fig. 1B shows representative IhERG measurements from cells expressing hERG in control conditions and from cells expressing Sar1-His or H79G-Sar1-His. The graph in Fig. 1C shows the IhERG normalized to the mean peak tail IhERG calculated from control cells (relative IhERG). Expression of H79G-Sar1-His caused an 85% reduction in the peak tail IhERG (n ≥ 8 cells per group; *, p < 0.01). These data demonstrate that H79G-Sar1-His inhibits the functional expression of WT hERG.
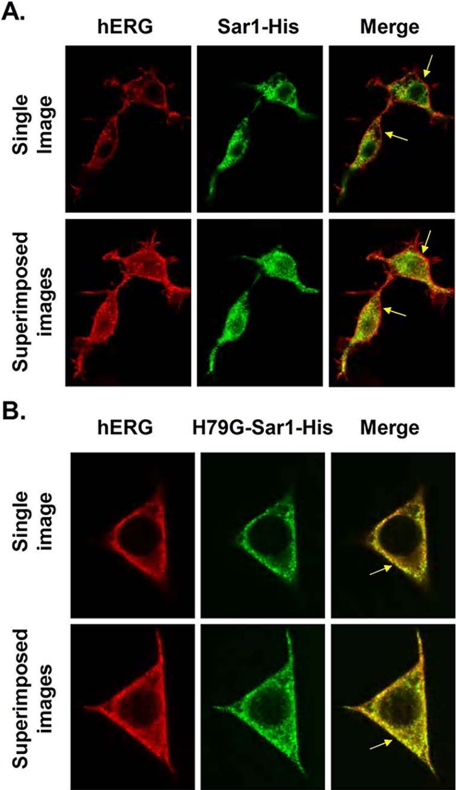
To further explore the effect that H79G-Sar1-His has on hERG trafficking we used confocal microscopy to image cells transiently expressing hERG and Sar1-His (Fig. 2A) or H79G-Sar1-His (Fig. 2B). The top rows in Fig. 2, A and B show representative Z-scan confocal images through the middle of cells, and the bottom rows in Fig. 2, A and B show the corresponding series of superimposed Z-scan images taken from the top to the bottom of cells at 0.5-μm sections (n > 8 cells per group) to generate a pseudo three-dimensional image. The first column shows cells stained using the anti-hERG antibody (red), the second column shows the same cells stained using the anti-polyhistidine antibody (green) to label the tagged Sar1 proteins, and the third column shows the merged images (yellow demonstrates overlapped staining). Cells expressing hERG plus Sar1-His show hERG staining on the peripheral border of the cells, whereas cells expressing H79G-Sar1-His decreased hERG staining at the cell periphery and increased staining inside the cell. These data suggest that DN Sar1 inhibits the trafficking of hERG, and they are consistent with the hypothesis that the ER export of hERG is dependent on Sar1/COPII vesicular transport.
FIGURE 2.
H79G-Sar1-His alters the cellular localization of hERG. HEK293 cells were transiently transfected with hERG and Sar1-His (A) or hERG and H79G-Sar1-His (B). The first column shows the staining using the anti-hERG antibody (red), the second row shows staining of the anti-polyhistidine antibody (green), and the third column shows the merged images. The yellow arrows in the third column highlight the plasmalemma.
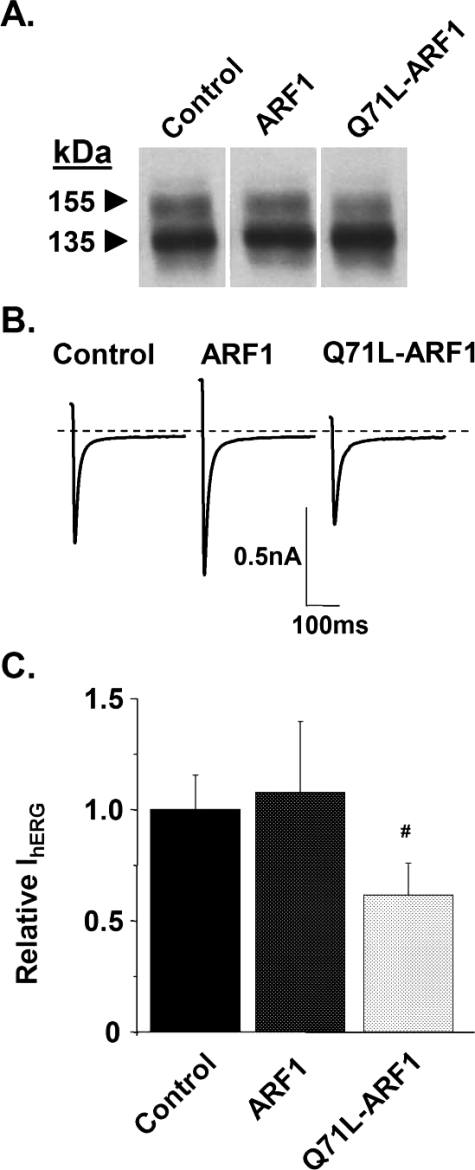
DN ARF1 Has Small Effects on hERG Trafficking—Simplified models of protein trafficking suggest that proteins that undergo ER export are transported to pre-Golgi compartments in COPII vesicles and then are transported to the Golgi in COPI vesicles. The small GTPase ARF1 regulates the trafficking of COPI vesicles and DN ARF1 inhibits the transport of proteins in COPI vesicles. We tested the hypothesis that the trafficking of hERG is dependent on ARF1. Fig. 3A shows representative Western blot analysis (n = 4) of hERG from control cells or from cells cotransfected with DN Q71L-ARF1. Immunoblots of the cell lysates demonstrate the presence of both the immature and mature hERG subunit bands, suggesting that Q71L-ARF1 does not completely disrupt Golgi processing of hERG. Fig. 3B shows representative whole-cell tail IhERG traces recorded from control cells or from cells coexpressing ARF1 or Q71L-ARF1 measured using the same protocol as in Fig. 1. Fig. 3C shows that there was a 40% decrease in the relative IhERG measured from cells expressing Q71L-ARF1 (n = 6–14 cells per group; #, p = 0.05).
FIGURE 3.
Q71L-ARF1 has a small effect on hERG trafficking. A, Western blot analysis of HEK293 cells transiently expressing hERG without (control) or with ARF1 or Q71L-ARF1. B, representative tail IhERG measured from control cells and cells coexpressing ARF1 or Q71L-ARF1. C, mean peak tail IhERG calculated from the same groups of cells.
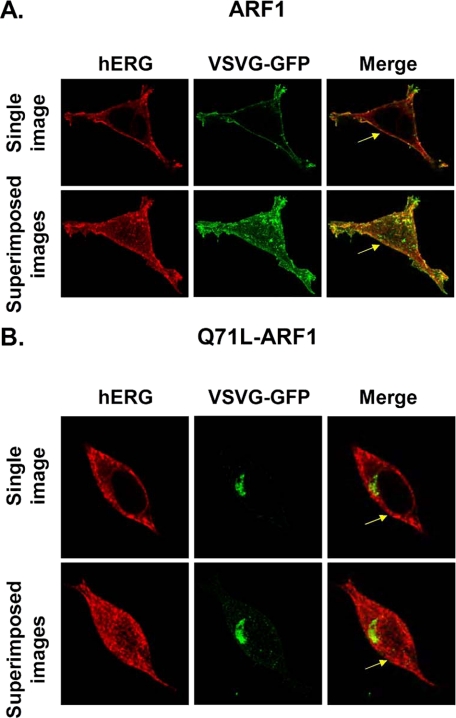
The results in Fig. 3 show that the effect of coexpressing DN Q71L-ARF1 is relatively small when compared with DN Sar1 (Fig. 1). This may be due to a weak DN effect by Q71L-ARF1. We tested whether Q71L-ARF1 altered the subcellular localization of VSVG protein. Dascher and Balch (23) previously demonstrated that coexpression of Q71L-ARF1 causes VSVG to distribute in a perinuclear region. Fig. 4A shows confocal data of a representative cell expressing hERG and VSVG-GFP with ARF1, and Fig. 4B shows a representative cell expressing hERG and VSVG-GFP with Q71L-ARF1. The top rows in Fig. 4, A and B show representative Z-scan images through the middle of the cells, and the corresponding bottom rows in Fig. 4, A and B show the series of superimposed Z-scan images taken from the top to the bottom of cells at 0.5-μm sections. The first column shows anti-hERG staining in red, the second column shows VSVG-GFP fluorescence in green, and the third column shows the merged images of hERG staining and VSVG-GFP fluorescence with overlap shown in yellow. Expression of Q71L-ARF1 caused VSVG-GFP to distribute in a restricted perinuclear region similar to that previously reported (23). The intracellular staining of the hERG also appeared to slightly increase, but the relative effect that Q71L-ARF1 had on the subcellular localization of hERG staining was less dramatic than VSVG-GFP. We conclude that hERG trafficking may be weakly regulated by ARF1, and ARF1 differentially regulates the trafficking of hERG and VSVG-GFP proteins.
FIGURE 4.
Q71L-ARF1 selectively alters the cellular localization of VSVG-GFP. HEK293 cells were transiently transfected with hERG and VSVG-GFP along with ARF1 (A) or Q71L-ARF1 (B). The first column shows the staining of hERG using the anti-hERG antibody (red), the second column shows fluorescence of VSVG-GFP (green), and the third column shows merged images with yellow indicating colocalization. The yellow arrows in the third column highlight the plasmalemma.
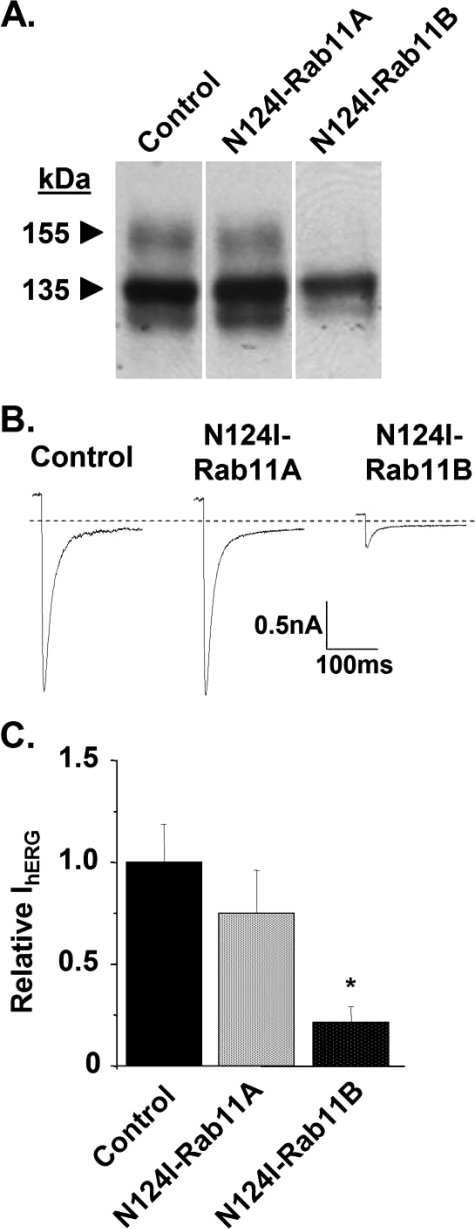
Rab11B Regulates the Trafficking of hERG to the Golgi and Plasmalemma—The results in Figs. 1 and 3 are qualitatively similar to previous findings for the Cystic Fibrosis Transmembrane Conductance Regulator (CFTR) Cl– channel (27). These data suggested that the Golgi processing of CFTR Cl– channels is more sensitive to DN Sar1 compared with DN ARF1. Yoo et al. found that the Golgi processing of CFTR Cl– channels is inhibited by a DN Rab that regulates endosomal recycling. Their results are surprising because they suggest that CFTR may traffic to endosomes prior to their processing in the Golgi. This contradicts conventional models of membrane protein trafficking, whereby proteins traffic from the ER, to the Pre-Golgi/Golgi, and ultimately the plasmalemma. Because the relatively small effect of DN ARF1 on CFTR Cl– channels and hERG is similar, we speculated that the trafficking of hERG may also depend on Rabs that regulate endosomal trafficking/recycling. Both Rab6 and Rab11 regulate endosomal recycling (34–36). There are two isoforms of Rab 6 (Rab6A and Rab6B) and two isoforms of Rab11 (Rab11A and Rab11B). The coexpression of WT or the DN mutations Q72L-Rab6A or the Q72L-Rab6B did not alter the Golgi processing of hERG subunits or the functional expression of hERG compared with control (Western blot and IhERG, data not shown). Similarly, expression of hERG with WT Rab11A or Rab11B did not alter the Golgi processing of hERG subunits or the functional expression of hERG compared with control (Western blot and IhERG, data not shown). However, DN Rab11B inhibited hERG trafficking. Fig. 5A shows representative Western blot analysis (n = 4) from cells transiently expressing WT hERG in control conditions, and coexpressing with the DN mutations N124I-Rab11A or N124I-Rab11B. Cells expressing N124I-Rab11B, but not N124I-Rab11A, inhibited formation of the mature hERG subunit band. Fig. 5B shows representative whole-cell IhERG traces from control cells or from cells expressing N124I-Rab11A or N124I-Rab11B. Fig. 5C shows the relative IhERG measured from control cells or cells expressing N124I-Rab11A or N124I-Rab11B. Expression of N124I-Rab11B caused a 79% reduction in the mean peak tail IhERG compared with control cells (n ≥ 6 cells per group; *, p < 0.01). The mean peak tail IhERG measurements for cells expressing N124I-Rab11A were not different from control (p > 0.01). Our results suggest that Rab11B, but not Rab11A, regulates the trafficking of hERG to the Golgi and plasmalemma.
FIGURE 5.
Dominant negative Rab11B selectively inhibits the trafficking of hERG. A, Western blot analysis of control cells or cells coexpressing N124I-Rab11A or N124I-Rab11B. B, representative tail IhERG traces for cells expressing hERG in control conditions, or hERG plus N124I-Rab11A or N124I-Rab11B. C, graph of the relative mean peak tail IhERG.
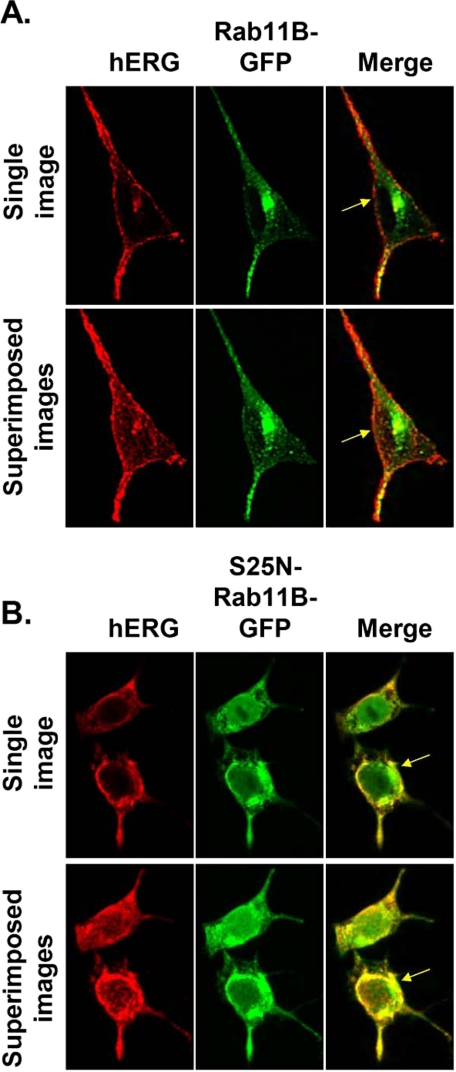
We further explored the effect that Rab11B had on the trafficking of hERG by coexpressing a different DN Rab11B mutation, S25N, which was modified to contain GFP at its N terminus (S25N-Rab11B-GFP) (31). This fusion protein was previously shown to inhibit the recycling of transferrin to the plasma membrane. Similar to N124I-Rab11B, the coexpression of S25N-Rab11B-GFP inhibited the formation of mature hERG subunit band on Western blot and reduced IhERG compared control (data not shown). Fig. 6 shows representative images of cells that were expressing hERG and Rab11B-GFP or S25N-Rab11-GFP. The top rows in Fig. 6, A and B show representative Z-scan confocal images through the middle of cells and the bottom rows show the corresponding series of superimposed Z-scan images taken from the top to the bottom of cells at 0.5-μm sections (n > 4 cells per group). The first column shows anti-hERG staining in red, the second column shows the Rab11-GFP staining in green, and the third column shows the merged images where overlapping hERG and Rab11B signals are shown in yellow. Cells expressing hERG plus Rab11B-GFP show hERG staining on the cell periphery, whereas cells coexpressing S25N-Rab11B-GFP appears to decrease hERG staining at the cell periphery and increased staining inside the cell. These data provide further support that Rab11B is important for the trafficking of hERG to the plasmalemma.
FIGURE 6.
Dominant negative Rab11B selectively inhibits the trafficking of hERG. Shown are representative images from cells expressing hERG plus (A) Rab11B-GFP or (B) hERG plus S25N-Rab11B-GFP. The first column shows staining of hERG (red) and the second column shows the fluorescence of Rab11B-GFP or S25N-Rab11B-GFP (green). The third column shows merged images. The yellow arrows in the third column highlight the plasmalemma.
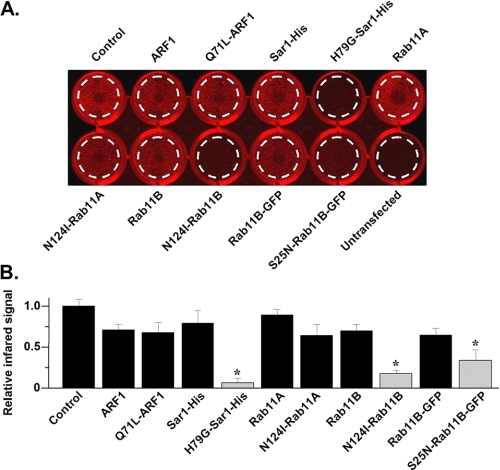
Plasmalemmal Expression of hERG Can Be Measured using the Live Cell Western Technique—Visualizing the plasmalemmal expression of hERG using confocal microscopy suffers from limited spatial resolution to distinguish plasmalemma from sub-plasmalemma localization. Therefore, we developed a live cell Western technique that quantitatively measures plasmalemmal expression of hERG by imaging living cells on tissue culture plates. This technique employs an antibody directed against an extracellular epitope in the hERG S1-S2 linker which is then detected by a secondary antibody labeled with an infrared dye, studied on an infrared imaging system. Fig. 7A shows the red-scale infrared signal at 700 nm measured using an infrared imaging system from twelve wells of a 24-well tissue culture plate. Each well has a nearly confluent layer of HEK293 cells. The well on the lower right corner contains untransfected HEK293 cells, whereas, the other 11 wells contain cells expressing hERG in control conditions (WT hERG plus blank vector), or with the different GTPases used in this study. The infrared imaging analysis software quantifies the infrared signal (pixels count) within a predefined area (mm2, dashed circle, drawn to exclude cells that may adhere to the sides of each well) of each well. To correct for nonspecific or background infrared signal not associated with hERG staining, we subtracted the infrared signal of untransfected cells from the individual infrared signals measured from wells expressing hERG in control or coexpressing the different GTPases. Fig. 7B shows the relative mean infrared signal intensities (normalized to control). The coexpression of H79G-Sar1, N124I-Rab11B, and S27N-Rab11B-GFP decreased infrared signal intensity of hERG staining (n = 4 experiments for each; *, p < 0.01). These data demonstrate that the live cell Western technique recapitulates the findings from the Western blot, whole cell patch clamp, and immunocytochemical analyses. The data further support the hypothesis that Sar1 and Rab11B are important determinants for hERG trafficking.
FIGURE 7.
Live cell Western recapitulates Western blot electrophysiological, and imaging data. A, representative image of the infrared signal emission signal from a 24-well tissue culture plate. Shown are twelve wells of confluent cells in control conditions, expressing WT or DN small GTPases, or untransfected cells. B, the relative mean infrared intensity for the live cell Western analyses is shown. The black bars represent control, or GTPases that did not significantly alter IhERG compared with control, whereas the shaded bars represent DN GTPases that significantly inhibited IhERG.
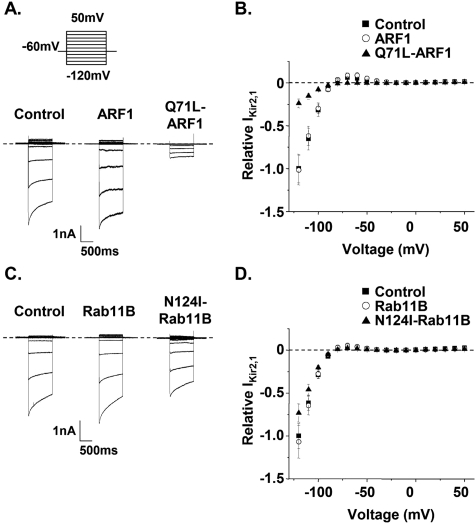
Different Sensitivity of Kir2.1 to DN ARF1 and Rab11B—Interestingly, this study shows that expression of Q71L-ARF1 caused a relatively small decrease in IhERG, whereas the expression of N124I-Rab11B caused a large decrease of IhERG. We wanted to determine if these DN small GTPases affected the other K+ channels similarly. Therefore we determined whether Q71L-ARF1 or N124I-Rab11B alter the functional expression of the inward rectifier K+ channel, Kir2.1. KNCJ2 encodes Kir2.1 α-subunits that oligomerize to form the channel that underlies IK1 in the heart, and, although rare, mutations in KCNJ2 have been linked to LQT (LQT7). Fig. 8A shows representative IKir2.1 traces from cells in control conditions and from cells expressing ARF1 or Q71L-ARF1. IKir2.1 was measured from a holding potential of –60 mV, and cells were pulsed from –120 mV to 50 mV for 1 s in 10-mV increments. Fig. 8B shows the relative amplitude of IKir2.1 measured at the end of the test-pulse plotted as a function of the test voltage. Compared with control cells, Q71L-ARF1 reduced IKir2.1 by 76% at –120 mV (n = 8–10 cells per group, p < 0.01). This reduction was much more pronounced compared with IhERG (Fig. 3). Fig. 8C shows representative IKir2.1 traces measured from cells expressing Kir2.1 in control conditions, and from cells expressing Rab11B or N124I-Rab11B. Fig. 8D shows the relative amplitude of IKir2.1 measured at the end of the test-pulse as a function of voltage. Compared with control cells, N124I-Rab11B reduced IKir2.1 by 26% at –120 mV (n = 8–10 cells per group, p < 0.01). This effect was much smaller compared with IhERG (Fig. 5C). Given the relative differences that DN ARF1 or Rab11B had on IKir2.1 and IhERG, these data suggest ARF1 and Rab11B differentially regulate the functional expression of hERG and Kir2.1.
FIGURE 8.
The functional expression of Kir2.1 exhibits different sensitivities to DN ARF1 or Rab11B. A, Representative families of IKir2.1 measured from cells expressing Kir2.1 and control DNA, ARF1, or Q71L-ARF1. IKir2.1 was measured from a holding potential of –60 mV and a series of test pulses to –120 mV to 60 mV in 10-mV increments for 1 s. B, the relative mean peak IKir2.1 was calculated by normalizing the steady-state IKir2.1 amplitude recorded at the end of the test-pulse to control. The values are plotted as a function of the test-pulse for cells expressing Kir2.1 and control (▪), ARF1 (○), or Q71L-ARF1 (▵). C, representative families of IKir2.1 measured from cells expressing Kir2.1 and control DNA, Rab11B, or N124I-Rab11B. D, the relative mean peak IKir2.1 values are plotted as a function of the test-pulse for cells expressing Kir2.1 and control (▪), Rab11B (○), or N124I-Rab11B (▵).
DISCUSSION
The antegrade transport, or trafficking, of membrane proteins is often modeled linearly, where proteins are exported from the ER and trafficked to pre-Golgi compartments, the Golgi, and ultimately the plasmalemma. Plasmalemmal proteins then undergo internalization in endosomes and are recycled back to the plasmalemma or degraded. The ER export of many proteins is regulated by Sar1, the trafficking of proteins to the Golgi is regulated by ARF1, and the recycling of proteins from the endosome to the plasmalemma is regulated by Rab6 and Rab11. DN Sar1 blocks ER export, DN ARF1 blocks trafficking to the Golgi, and DN Rab6 or Rab11 can prevent the reexpression of proteins at the plasmalemma after they have been internalized.
Our data suggest that Sar1 regulates the ER export of hERG, because coexpression of DN Sar1 inhibited the Golgi processing of hERG subunits and the plasmalemmal expression of hERG (Figs. 1 and 2). Our data also show that DN ARF1 had small effects on hERG trafficking compared with DN Sar1 (Figs. 3 and 4). The lack of a strong inhibitory effect by coexpression of DN ARF1 may be due to an incomplete or a weak DN effect. Interestingly, the coexpression of DN ARF1 had a pronounced effect on the subcellular localization of VSVG-GFP (Fig. 4) and resulted in a large decrease in the functional expression of Kir2.1 (Fig. 8A). These data suggest that ARF1 may differentially regulate the trafficking of hERG and VSVG-GFP or Kir2.1.
An exciting finding is that DN Rab11B decreased the Golgi processing and plasmalemmal expression of hERG. This result is surprising, because in a conventional model of membrane protein trafficking Rab11B regulates trafficking events that occur after proteins transport through the Golgi. One possibility for this result is that hERG channels do not follow a conventional model of membrane protein trafficking. Precedence for this is provided by Yoo et al. (27) who found that the Golgi processing of CFTR Cl– channels was blocked by DN Sar1 but not DN ARF1. They also found that DN Rab6, which also regulates the recycling of proteins out of endosomes, inhibited the Golgi processing of CFTR Cl– channels. Although we did not see an effect of the same DN Rab6 in our study, our data suggest that CFTR Cl– channels and hERG may traffic in a similar non-conventional pathway, where immature proteins traffic to endosomes prior to their processing in the Golgi. The purpose of such an unusual trafficking pathway is not entirely clear. Although speculative, one possibility is that proteins may utilize an alternate or non-conventional pathway to prevent the aggregation of misfolded proteins in the Golgi or other intracellular organelles, which may negatively affect cell function (27). For example, the aggregation and deposition of misfolded proteins is of critical importance in many degenerative diseases to cause cellular dysfunction and damage (for review, see Ref. 38). Intriguingly, while most LQT2 mutations appear to increase hERG channel misfolding to disrupt their normal trafficking, even the overexpression LQT2 mutations in heterologous models does not cause protein aggregates or cell death (6), and protein aggregates in cardiac myocytes have not been reported in patients with LQT2. Thus, it is possible that the pathway for cellular processing of a protein might impact on how it is handled by cellular quality control mechanisms.
Alternatively, Rab11B may have a previously unidentified role in the regulation of protein trafficking in Pre-Golgi/Golgi compartments. For example, Rab11B may regulate the trafficking of proteins in the vesicular tubular cluster, the ER to Golgi Intermediate Complex, or within the Golgi cisternae, and the effects we observe may be independent of Rab11B regulation of endosomal trafficking. We cannot exclude this possibility, but our data show that Rab11B is not critical for the functional expression of all channels, since the expression of DN Rab11B had a relatively small effect on the functional expression of Kir2.1 (Fig. 8B).
Given the differences in the sensitivity of DN ARF1 and Rab11B on hERG and Kir2.1, the data suggest that the trafficking of these K+ channels is not regulated by the same vesicular transport proteins, and hERG and Kir2.1 may traffic in different intracellular pathways to the plasmalemma. Intriguingly, the vesicular transport properties of the A-type voltage-gated K+ channel subunits, Kv4.2 and K+ channel Interacting Protein 1 (KChIP1) (37) are very different to what we found with hERG. The plasmalemmal expression of Kv4.2/KChIP1 is inhibited by the expression DN ARF1 but not DN Sar1. Therefore unlike hERG, these results suggest that the trafficking of Kv4.2/KChIP1 is primarily dependent on ARF1-mediated transport. The purpose of unique trafficking pathways for different K+ channels is not entirely clear. However, one can speculate that this may represent a regulatory mechanism for the plasmalemmal expression of K+ channels at the level of ER export. Further work that delineates the trafficking pathways for different K+ channels may be useful in understanding the cellular mechanisms that regulate their functional expression.
There are limitations to this study. Although these results are robust, they were obtained utilizing a widely used heterologous overexpression system and results could differ in native cardiac myocytes. Secondly, overexpression of hERG channels and DN small GTPases may cause unintended cytotoxic effects and/or temporal differences that may account for some of these findings. Although cytotoxicity is not sufficient to alter hERG channel trafficking (39), some of the effects resulting from this cannot be excluded.
Most LQT2 missense mutations fail to undergo Golgi processing and plasmalemmal expression, and thus are trafficking-deficient. Many studies suggest that LQT2 mutations result in protein misfolding and that cellular quality control mechanisms prevent their ER export and expression at the plasmalemma (39–42). We previously showed that LQT2 missense mutations often undergo correction of their trafficking-deficient phenotype, and that different “patterns” of correction exist (6). We speculated that these patterns might be linked to the disruption of discrete steps in hERG channel biogenesis by different LQT2 mutations. The present study is the first to demonstrate that the expression of two different DN vesicular transport proteins, Sar1 and Rab11B, mimics the trafficking-deficient LQT2 phenotype in cells expressing WT hERG. Because Sar1 and Rab11B regulate different steps in the trafficking of proteins, this study raises the intriguing possibility that some trafficking-deficient LQT2 mutations fail at different trafficking steps prior to their processing in the Golgi, which might also explain the different patterns of correction. Identifying which step(s) particular trafficking-deficient LQT2 mutations fail may identify novel therapeutic targets that increase their functional expression.
Acknowledgments
We thank Dr. Jennifer Lippincott-Schwartz for supplying the VSVG-GFP construct, Dr. Beate Schlierf (Institut für Biochemie, Universität Erlangen-Nürnberg, Erlangen, Germany) for supplying the Rab11B-GFP constructs, Dr. Jonathan Makielski for supplying the Kir2.1 construct, and Thankful Sanftleben for manuscript preparation.
This work was supported, in whole or in part, by NHLBI, National Institutes of Health Grant R01 HL087039 (to B. P. D.) and Grant R01 HL60723 (to C. T. J.). This work was also supported by the Scientist Development Grants 0535068N and 0730010N from the American Heart Association (to B. P. D. and to R. C. B., respectively) and the Mabel Lent Foundation (to C. T. J.). The costs of publication of this article were defrayed in part by the payment of page charges. This article must therefore be hereby marked “advertisement” in accordance with 18 U.S.C. Section 1734 solely to indicate this fact.
Footnotes
The abbreviations used are: hERG, human ether-a-go-go related gene; IKr, rapidly activating delayed rectifier K+ current; LQT, Long QT syndrome; LQT2, Type 2 Long QT; ER, endoplasmic reticulum; DN, dominant negative; COPII, coat-associated protein complex II; COPI, coat-associated protein complex I; ARF1, ADP-ribosylation factor 1; HEK, human embryonic kidney; VSVG-GFP, vesicular stomatitis virus ts045 G protein fused to green fluorescent protein; VSV, vesicular stomatitis virus; CFTR, cystic fibrosis transmembrane conductance regulator; KChIP1, K+ channel-interacting protein 1; WT, wild type; PBS, phosphate-buffered saline.
References
- 1.Warmke, J. W., and Ganetzky, B. (1994) Proc. Natl. Acad. Sci. U. S. A. 91 3438–3442 [DOI] [PMC free article] [PubMed] [Google Scholar]
- 2.Sanguinetti, M. C., Curran, M. E., Zou, A., Shen, J., Spector, P. S., Atkinson, D. L., and Keating, M. T. (1996) Nature 384 80–83 [DOI] [PubMed] [Google Scholar]
- 3.Trudeau, M. C., Warmke, J. W., Ganetzky, B., and Robertson, G. A. (1996) Science 272 1087. [PubMed] [Google Scholar]
- 4.Zhou, Z., Gong, Q., Epstein, M. L., and January, C. T. (1998) J. Biol. Chem. 273 21061–21066 [DOI] [PubMed] [Google Scholar]
- 5.Delisle, B. P., Anson, B. D., Rajamani, S., and January, C. T. (2004) Circ. Res. 94 1418–1428 [DOI] [PubMed] [Google Scholar]
- 6.Anderson, C. L., Delisle, B. P., Anson, B. D., Kilby, J. A., Will, M. L., Tester, D. J., Gong, Q., Zhou, Z., Ackerman, M. J., and January, C. T. (2006) Circulation 113 365–373 [DOI] [PubMed] [Google Scholar]
- 7.Barlowe, C., d'Enfert, C., and Schekman, R. (1993) J. Biol. Chem. 268 873–879 [PubMed] [Google Scholar]
- 8.Barlowe, C., Orci, L., Yeung, T., Hosobuchi, M., Hamamoto, S., Salama, N., Rexach, M. F., Ravazzola, M., Amherdt, M., and Schekman, R. (1994) Cell 77 895–907 [DOI] [PubMed] [Google Scholar]
- 9.Barlowe, C. (2002) Curr. Opin. Cell Biol. 14 417–422 [DOI] [PubMed] [Google Scholar]
- 10.Kuge, O. (1994) J. Cell Biol. 125 51–65 [DOI] [PMC free article] [PubMed] [Google Scholar]
- 11.Rowe, T., Aridor, M., McCaffery, J. M., Plutner, H., Nuoffer, C., and Balch, W. E. (1996) J. Cell Biol. 135 895–911 [DOI] [PMC free article] [PubMed] [Google Scholar]
- 12.Hosobuchi, M., Kreis, T., and Schekman, R. (1992) Nature 360 603–605 [DOI] [PubMed] [Google Scholar]
- 13.Pepperkok, R., Scheel, J., Horstmann, H., Hauri, H. P., Griffiths, G., and Kreis, T. E. (1993) Cell 74 71–82 [DOI] [PubMed] [Google Scholar]
- 14.Peter, F., Plutner, H., Zhu, H., Kreis, T. E., and Balch, W. E. (1993) J. Cell Biol. 122 1155–1167 [DOI] [PMC free article] [PubMed] [Google Scholar]
- 15.Letourneur, F., Gaynor, E. C., Hennecke, S., Demolliere, C., Duden, R., Emr, S. D., Riezman, H., and Cosson, P. (1994) Cell 79 1199–1207 [DOI] [PubMed] [Google Scholar]
- 16.Griffiths, G., Pepperkok, R., Locker, J. K., and Kreis, T. E. (1995) J. Cell Sci. 108 2839–2856 [DOI] [PubMed] [Google Scholar]
- 17.Aridor, M., Bannykh, S. I., Rowe, T., and Balch, W. E. (1995) J. Cell Biol. 131 875–893 [DOI] [PMC free article] [PubMed] [Google Scholar]
- 18.Bednarek, S. Y., Ravazzola, M., Hosobuchi, M., Amherdt, M., Perrelet, A., Schekman, R., and Orci, L. (1995) Cell 83 1183–1196 [DOI] [PubMed] [Google Scholar]
- 19.Orci, L., Stamnes, M., Ravazzola, M., Amherdt, M., Perrelet, A., Sollner, T. H., and Rothman, J. E. (1997) Cell 90 335–349 [DOI] [PubMed] [Google Scholar]
- 20.Foell, J. D., Balijepalli, R. C., Delisle, B. P., Yunker, A. M., Robia, S. L., Walker, J. W., McEnery, M. W., January, C. T., and Kamp, T. J. (2004) Physiol. Genomics 17 183–200 [DOI] [PubMed] [Google Scholar]
- 21.Schlierf, B., Fey, G. H., Hauber, J., Hocke, G. M., and Rosorius, O. (2000) Exp. Cell Res. 259 257–265 [DOI] [PubMed] [Google Scholar]
- 22.Tisdale, E. J., Bourne, J. R., Khosravi-Far, R., Der, C. J., and Balch, W. E. (1992) J. Cell Biol. 119 749–761 [DOI] [PMC free article] [PubMed] [Google Scholar]
- 23.Dascher, C., and Balch, W. E. (1994) J. Biol. Chem. 269 1437–1448 [PubMed] [Google Scholar]
- 24.Martinez, O., Schmidt, A., Salamero, J., Hoflack, B., Roa, M., and Goud, B. (1994) J. Cell Biol. 127 1575–1588 [DOI] [PMC free article] [PubMed] [Google Scholar]
- 25.White, J., Johannes, L., Mallard, F., Girod, A., Grill, S., Reinsch, S., Keller, P., Tzschaschel, B., Echard, A., Goud, B., and Stelzer, E. H. (1999) J. Cell Biol. 147 743–760 [DOI] [PMC free article] [PubMed] [Google Scholar]
- 26.Echard, A., Opdam, F. J., de Leeuw, H. J., Jollivet, F., Savelkoul, P., Hendriks, W., Voorberg, J., Goud, B., and Fransen, J. A. (2000) Mol. Biol. Cell 11 3819–3833 [DOI] [PMC free article] [PubMed] [Google Scholar]
- 27.Yoo, J. S., Moyer, B. D., Bannykh, S., Yoo, H. M., Riordan, J. R., and Balch, W. E. (2002) J. Biol. Chem. 277 11401–11409 [DOI] [PubMed] [Google Scholar]
- 28.Eckhardt, L. L., Farley, A. L., Rodriguez, E., Ruwaldt, K., Hammill, D., Tester, D. J., Ackerman, M. J., and Makielski, J. C. (2007) Heart Rhythm 4 323–329 [DOI] [PMC free article] [PubMed] [Google Scholar]
- 29.Presley, J. F., Cole, N. B., Schroer, T. A., Hirschberg, K., Zaal, K. J., and Lippincott-Schwartz, J. (1997) Nature 389 81–85 [DOI] [PubMed] [Google Scholar]
- 30.Zhou, Z., Gong, Q., Ye, B., Fan, Z., Makielski, J. C., Robertson, G. A., and January, C. T. (1998) Biophys. J. 74 230–241 [DOI] [PMC free article] [PubMed] [Google Scholar]
- 31.Zhou, Z., Gong, Q., and January, C. T. (1999) J. Biol. Chem. 274 31123–31126 [DOI] [PubMed] [Google Scholar]
- 32.Delisle, B. P., Anderson, C. L., Balijepalli, R. C., Anson, B. D., Kamp, T. J., and January, C. T. (2003) J. Biol. Chem. 278 35749–35754 [DOI] [PubMed] [Google Scholar]
- 33.Rajamani, S., Anderson, C. L., Valdivia, C. R., Eckhardt, L. L., Foell, J. D., Robertson, G. A., Kamp, T. J., Makielski, J. C., Anson, B. D., and January, C. T. (2006) Am. J. Physiol. Heart Circ Physiol 290 H1278–H1288 [DOI] [PubMed] [Google Scholar]
- 34.Goud, B., Yang, C., Roa, M., Martinez, O., and Mayau, V. (1994) Ann. N. Y. Acad. Sci. 710 192–195 [DOI] [PubMed] [Google Scholar]
- 35.Ullrich, O., Reinsch, S., Urbe, S., Zerial, M., and Parton, R. G. (1996) J. Cell Biol. 135 913–924 [DOI] [PMC free article] [PubMed] [Google Scholar]
- 36.Casanova, J. E., Wang, X., Kumar, R., Bhartur, S. G., Navarre, J., Woodrum, J. E., Altschuler, Y., Ray, G. S., and Goldenring, J. R. (1999) Mol. Biol. Cell 10 47–61 [DOI] [PMC free article] [PubMed] [Google Scholar]
- 37.Hasdemir, B., Fitzgerald, D. J., Prior, I. A., Tepikin, A. V., and Burgoyne, R. D. (2005) J. Cell Biol. 171 459–469 [DOI] [PMC free article] [PubMed] [Google Scholar]
- 38.Kaganovich, D., Kopito, R., and Frydman, J. (2008) Nature 454 1088–1095 [DOI] [PMC free article] [PubMed] [Google Scholar]
- 39.Ficker, E., Dennis, A. T., Wang, L., and Brown, A. M. (2003) Circ. Res. 92 87–100 [DOI] [PubMed] [Google Scholar]
- 40.Delisle, B. P., Slind, J. K., Kilby, J. A., Anderson, C. L., Anson, B. D., Balijepalli, R. C., Tester, D. J., Ackerman, M. J., Kamp, T. J., and January, C. T. (2005) Mol. Pharmacol. 68 233–240 [DOI] [PubMed] [Google Scholar]
- 41.Gong, Q., Keeney, D. R., Molinari, M., and Zhou, Z. (2005) J. Biol. Chem. 280 19419–19425 [DOI] [PubMed] [Google Scholar]
- 42.Gong, Q., Jones, M. A., and Zhou, Z. (2006) J. Biol. Chem. 281 4069–4074 [DOI] [PMC free article] [PubMed] [Google Scholar]


