Abstract
Cationic amphipathic drugs, such as amiodarone, interact preferentially with lipid membranes to exert their biological effect. In the yeast Saccharomyces cerevisiae, toxic levels of amiodarone trigger a rapid influx of Ca2+ that can overwhelm cellular homeostasis and lead to cell death. To better understand the mechanistic basis of antifungal activity, we assessed the effect of the drug on membrane potential. We show that low concentrations of amiodarone (0.1–2 μm) elicit an immediate, dose-dependent hyperpolarization of the membrane. At higher doses (>3 μm), hyperpolarization is transient and is followed by depolarization, coincident with influx of Ca2+ and H+ and loss in cell viability. Proton and alkali metal cation transporters play reciprocal roles in membrane polarization, depending on the availability of glucose. Diminishment of membrane potential by glucose removal or addition of salts or in pma1, tok1Δ, ena1-4Δ, or nha1Δ mutants protected against drug toxicity, suggesting that initial hyperpolarization was important in the mechanism of antifungal activity. Furthermore, we show that the link between membrane hyperpolarization and drug toxicity is pH-dependent. We propose the existence of pH- and hyperpolarization-activated Ca2+ channels in yeast, similar to those described in plant root hair and pollen tubes that are critical for cell elongation and growth. Our findings illustrate how membrane-active compounds can be effective microbicidals and may pave the way to developing membrane-selective agents.
Antifungal drugs such as polyenes, azoles, allylamines, and morpholines target differences between fungal and animal membranes. For example, azoles provide safe and effective fungistatic action by inhibiting the biogenesis of the fungal specific sterol, ergosterol. However, the development of secondary resistance to these drugs in the course of long term therapy and the rising number of immunocompromised patients who fail to clear the trailing ends of fungal infection have driven the search for new drugs that can augment the arsenal of antimycotics. Courchesne (1) reported that amiodarone, an ion channel blocker in clinical use as an antiarrhythmic agent, exhibited broad range fungicidal effects at concentrations ranging from 5 to 15 μm. Gupta et al. (2) first demonstrated that the combination of 2–4 μm concentrations of amiodarone and azole drugs had a synergistic effect against in vitro growth of Cryptococcus neoformans and Candida albicans strains. Interestingly, azole-resistant mutants in the ergosterol biosynthesis pathway of Saccharomyces cerevisiae (erg3Δ, erg6Δ, and erg24Δ) exhibited hypersensitivity to amiodarone, suggesting that the drug may be particularly effective for treatment against azole-resistant fungal strains (2). This has been borne out by recent in vitro data of synergistic killing of azole-resistant clinical isolates of C. albicans by amiodarone (3, 4). In light of these promising developments, we sought to understand the mechanistic basis for the fungicidal activity of amiodarone.
Multiple lines of evidence point to a role for drug-induced calcium influx in mediating amiodarone toxicity. First, amiodarone was shown to trigger a rapid, dose-dependent calcium burst in yeast (2, 5), preceding mitochondrial fragmentation and cell death (6). A genome-wide screen of yeast mutants revealed a correlation between some hypersensitive strains and defects in calcium handling (2); this included null alleles of Ca2+-calmodulin-regulated phosphatase calcineurin (cnb1Δ), Golgi/secretory pathway Ca2+-ATPase (pmr1Δ), and vacuolar H+ pump (e.g. vma1Δ) that provides the driving force for vacuolar Ca2+ sequestration. Transcriptional profiling of genes differentially regulated by amiodarone largely recapitulated the effects of calcium toxicity (7). Finally, modulation of the size and temporal kinetics of amiodarone-induced calcium transients, by altering metabolic status or extracellular calcium levels, elicited corresponding downstream effects in drug toxicity (8). Thus, chelation of extracellular Ca2+ with EGTA abolished the Ca2+ transient and protected against cell death; conversely, reintroduction of micromolar levels of Ca2+ to the depleted medium restored both calcium burst and amiodarone toxicity. Although these studies established a significant and causal role for Ca2+ influx in mediating drug toxicity, the mechanistic link between amiodarone and Ca2+ influx remained to be determined.
A starting point for the studies described herein was the observation that removal of glucose from actively growing cells had the immediate effect of attenuating amiodarone-induced Ca2+ burst, thus protecting against drug toxicity (8). It is well known that H+ pump activity of the yeast plasma membrane ATPase, Pma1, is immediately down-regulated upon glucose removal (9), thereby coupling the electrochemical gradient across the membrane to energy levels in the cell. We hypothesized that the membrane potential may play a role in mediating the opening of Ca2+ channels and therefore fungicidal activity of amiodarone. Furthermore, depolarization of the membrane upon drug-induced influx of Ca2+ and possibly other cations might contribute to cell death. Therefore, we investigated the effect of low doses of amiodarone on plasma membrane potential in wild type yeast, and in mutants with known perturbations of membrane potential. We show that a polarized membrane is critical for drug toxicity; furthermore, the change in membrane potential precedes and is closely coupled to both cation influx and cell death. Our findings offer insights into manipulation of membrane potential by a range of amphiphilic compounds that may be useful as antimycotic adjuncts or agents.
EXPERIMENTAL PROCEDURES
Media, Reagents, Strains, and Growth—Yeast strains were grown at 30 °C in standard synthetic complete (SC) medium (Bio 101 Inc., Vista, CA) or YPD. Stock solutions of amiodarone (Sigma) were 5 or 20 mm in DMSO. Stock solution of 3,3′-dipropylthiacarbocyanine iodide (diS-C3(3))2 fluorescence probe (Molecular Probes) was 3 mm in ethanol. S. cerevisiae wild type strain BY4742 (MATα, his3Δ1 leu2Δ0 lys2Δ0 ura3Δ0) was purchased from Invitrogen. Plasmid pEVP11-Aeq89 has been described (10). Other strains included W303-1A (MATa ade2-1 can1-100 his3-11,15 leu2-3,112 trp1-1 ura3-1 mal10; Ref. 11), TOW (tok1Δ; Ref. 12), BW31 (ena1-4Δ nha1Δ; Ref.13), and TOB (ena1-4Δ nha1Δ tok1Δ; Ref.12). LMY69 (HO arg6 PMA1; Y55 306) and LMY65 (HO arg6 pma1-105; Y55 arg6; 14) were the kind gifts from the laboratory of Wylie Nichols, Emory University, Atlanta, GA. Growth curves were measured in Elx808 BioTek reader as described earlier (15). For the drop tests, cells at an initial concentration of 0.5 A600 nm ml–1 were serially diluted in 3-fold increments, and 2-μl aliquots were plated on YPD agar in Nunc omni trays. HP Scanjet 3570c was used to image the plates.
Monitoring of Membrane Potential Changes—The fluorescence assay for monitoring membrane potential changes was adapted from Denksteinova et al. (16) as follows: yeast cells were inoculated into liquid YPD medium to the initial cell density of about 104 cells ml–1 (A600 nm ∼ 0.001). The culture was cultivated for 8–15 h at 30 °C, until the cell culture reached exponential growth phase. The cells were harvested, washed twice with a citrate-phosphate (CP) buffer (10 mm Na2HPO4, citric acid to pH 6.0), and resuspended in the same buffer to A600 nm = 0.200 ± 5%. The diS-C3(3) fluorescence probe (0.1 mm working solution in ethanol) was added to 3 ml of yeast cell suspension to a final probe concentration of 0.2 μm. Salts (as indicated in the text) were dissolved in the CP buffer before addition of cells, and amiodarone (from stock solution in DMSO) was added to the cell suspension in CP immediately after the fluorescence probe just before fluorescence measurement. Fluorescence emission spectra were measured on an ISS PC1 spectrofluorometer. The excitation wavelength was 531 nm, and emission intensities were measured at 560 and 580 nm. The staining curves (i.e. the dependence of the emission intensity ratio (I580/I560) on the duration of staining t) were fitted as described (17), and the value of the intensity ratio at equilibrium was estimated.
Monitoring of Ca2+ Influx—The procedure was modified from Gupta et al. (2) as follows. 1 A600 nm of cells from overnight culture carrying pEVP11-Aeq-89 were spun down and resuspended in 50 μl of SC media containing 0.75 μg of coelenterazine (Invitrogen) and incubated in the dark at 25 °C for 0.5 h. The cells were washed twice with 2% glucose, resuspended in SC medium at 0.5 A600 nm ml–1, and incubated at room temperature for 2.5 h. 150 μl was placed in each well of white, opaque 96-well plates. Luminescence was recorded using a BMG FLUOStar OPTIMA™ plate reader (BMG Labtechnologies, Durham, NC). Total luminescence (Lmax) was determined following lysis with 4% Triton X-100 (Fisher) in 2 m CaCl2. Free Ca2+ concentrations (in μm) were calculated as described in Gupta et al. (2).
External pH Measurements—Cells were washed three times with sterile distilled water and concentrated to 20 A600 nm ml–1. 2 ml of concentrated cells were constantly stirred, and the pH was recorded on Microsoft Excel 2003 every 10 s using an AccuFast pH electrode (Fisher) connected to a PHM 92 Lab pH Meter from Radiometer Copenhagen (Brønshøj, Denmark). Glucose and amiodarone were manually injected to final concentrations specified in the figure legends.
Cytoplasmic pH Measurements—Cytoplasmic pH in yeast expressing pH-sensitive GFP, pHluorin, was determined by calculating the ratio of fluorescent intensity of emission at 520 nm with dual excitation at 410 and 485 nm, with calibration in media of defined pH, as described (18). Briefly, yeast cells transformed with plasmid pCB901YpHc (18) expressing cytoplasmic pHluorin were grown to late log phase (A600 nm ∼ 4) in SC-Leu drop-out medium. Cells (200 μl) were spun down and resuspended in standard SC medium for 30 min and then transferred to clear-bottom black 96-well plates. Amiodarone was injected to the desired concentration, and fluorescence was recorded on a BMG FLUOstar Optima multimode plate reader with accompanying BMG FLUOstar Optima version 1.20-0 software (BMG Labtechnologies, Durham, NC). Where specified, cells were resuspended in SC medium adjusted to the indicated pH with NaOH, or resuspended in SC medium lacking glucose before amiodarone injection and fluorescence measurement.
RESULTS
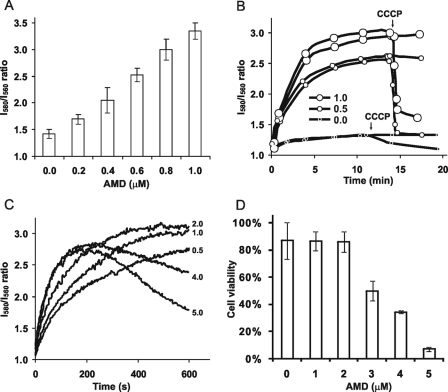
Amiodarone Elicits Hyperpolarization of the Plasma Membrane—Fungal cells, like all eukaryotes, maintain inside-negative resting membrane potentials. Using microelectrodes, these membrane potentials have been measured to reach values more negative than –180 mV in the filamentous fungus Neurospora crassa (19). Although measurement of absolute values of potential in smaller celled yeasts is more challenging and controversial (20), potentiometric probes provide reliable information on rapid changes in membrane potential (16). We used the potential sensitive fluorescence probe diS-C3(3) to monitor membrane potential changes in exponentially growing yeast cells, freshly resuspended in citrate phosphate buffer (pH 6.0). Low micromolar concentrations of amiodarone caused a dose-dependent increase in membrane potential, as seen by increased I580/I560 emission ratio (red shift) of diS-C3(3) fluorescence from base-line values (Fig. 1A). Fig. 1B shows that the time course of hyperpolarization occurs within minutes of amiodarone addition. Addition of the protonophore CCCP effectively reversed the increased emission ratio, consistent with a collapse of the membrane potential. The rate of hyperpolarization was also dose-dependent; however, hyperpolarization was transient at higher doses (Fig. 1C). Thus, at drug concentrations ≥4 μm, the I580/I560 emission ratio decreased after 200 s suggesting that the membrane becomes depolarized. This decrease was accelerated by addition of CCCP (not shown), confirming that the observed fluorescence changes were related to changes in plasma membrane potential.
FIGURE 1.
Amiodarone elicits dose-dependent hyperpolarization of the yeast plasma membrane. A, I580/I560 fluorescence emission ratio of diS-C3(3) was measured in W303-1A wild type yeast cells in CP buffer following addition of low doses of amiodarone (AMD). Each column is an average of three independent experiments. B, fluorescence ratio was monitored in duplicate samples as in A following addition of the indicated doses of amiodarone (0, 0.5, and 1 μm). The arrow indicates addition of protonophore (5 μm CCCP) to one sample of each duplicate pair. C, diS-C3(3) fluorescence ratio was monitored continuously following addition of the indicated concentrations of amiodarone (0.5–5 μm). Data are representative of three independent experiments. D, W303-1A cells exposed to the indicated concentrations of amiodarone in CP buffer for 10 min were diluted 100-fold and plated on YPD medium. Colonies were counted to determine viability, relative to the starting cell density (100%). Data are representative of two independent experiments; averages from triplicate colony counts are shown.
We investigated whether these changes in membrane potential were linked to drug toxicity. Yeast cells exposed to amiodarone under identical experimental conditions shown in Fig. 1, A–C, were plated and colonies counted to determine viability. Fig. 1D shows that amiodarone concentrations that caused membrane depolarization also caused cell death. Thus, although hyperpolarization per se was not toxic, the subsequent depolarization phase correlated with drug-induced loss of viability.
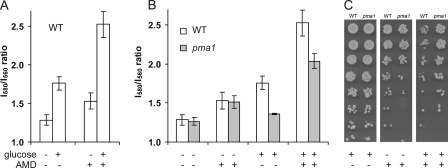
Role of Plasma Membrane H+-ATPase in Glucose Medium—Glucose is known to increase membrane potential by increasing H+ pumping activity of the plasma membrane ATPase, Pma1 (9). This is confirmed by a higher base-line I580/I560 fluorescence ratio of diS-C3(3) in cells resuspended in citrate phosphate buffer supplemented with 2% glucose. Addition of amiodarone elicited a further increase in the membrane potential in glucose-supplemented yeast cells (Fig. 2A). To investigate whether Pma1 activity contributed to drug-induced hyperpolarization, a previously characterized mutant strain, pma1-105 that has 65% reduction in activity (21), was compared with its isogenic wild type. In the absence of glucose, there was no difference in membrane potential between the mutant and wild type, both in the presence or absence of amiodarone (Fig. 2B). This suggests that Pma1 has minimal activity in the absence of glucose. In contrast, in the presence of glucose, pma1-105 was significantly depolarized relative to wild type, and amiodarone-induced hyperpolarization was also lower. We conclude that Pma1 activity contributes to plasma membrane hyperpolarization by amiodarone, but only in the presence of glucose.
FIGURE 2.
Amiodarone toxicity is linked to the membrane potential generated by Pma1 in glucose medium. A, I580/I560 emission ratio of diS-C3(3) in wild type LMY69 (WT) yeast resuspended in CP buffer in the presence (+) or absence (–) of 2% glucose and 0. 4 μm AMD. Each column is an average of three independent experiments. B, comparison of membrane potential in isogenic wild type (LMY69; WT) and pma1-105 mutant (LMY65; pma1) following treatment with 2% glucose and 0.4 μm AMD, as indicated. Each column is an average of three independent experiments. C, viability of WT and pma1 yeast (0.5 A600/ml) was assessed on YPD agar following incubation in CP buffer supplemented with 2% glucose (left panel, control), or after exposure to 40 μm AMD in the absence (middle panel), or presence of 2% glucose (right panel) for 10 min. 3-Fold serial dilutions from 1 of 2 independent experiments are shown.
The higher level of hyperpolarization elicited by amiodarone in the presence of glucose correlates well with our previous observation of increased calcium burst and drug toxicity observed in glucose medium (8). If membrane potential increases were a necessary prerequisite for subsequent cation influx, membrane depolarization, and drug toxicity, we would predict that pma1-105 yeast would be more resistant to amiodarone in the presence but not absence of glucose. In the absence of drug, both pma1 mutant and control strain show similar viability (Fig. 2C, left panel). When amiodarone was added to cells in glucose-containing medium for 10 min, pma1 mutants showed increased survival relative to control (Fig. 2C, right panel). This tolerance to drug was abolished when cells were incubated with amiodarone in the absence of glucose for 10 min, prior to glucose addition and plating (Fig. 2C, middle panel). The data of Fig. 2 suggest that amiodarone-induced hyperpolarization of the membrane is coupled to drug toxicity.
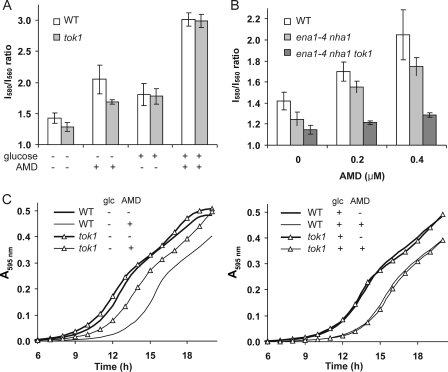
Role of Tok1 and Other Cation Transporters in the Absence of Glucose—Given the lack of effect of the pma1-105 mutation on diS-C3(3) fluorescence in the absence of glucose, we looked for other transport mechanisms that contributed to the observed drug-induced hyperpolarization. Tok1 is an outwardly rectifying K+ channel that has been implicated in maintaining membrane potential (12). We show a lower resting membrane potential in tok1Δ in the absence of glucose (Fig. 3A), as has been reported previously (12). Under these conditions, amiodarone-induced hyperpolarization was also reduced in the tok1 mutant. However, in glucose-containing buffer, there was no difference in membrane potential between tok1 mutant and its isogenic wild type strain (Fig. 3A), suggesting that Tok1 activity was reduced, absent, or masked by Pma1 activity in the presence of glucose. These observations reveal a role for Tok1 in maintaining membrane potential specifically in the absence of Pma1 function.
FIGURE 3.
Cation transporters maintain membrane potential in glucose-starved cells. A, I580/I560 emission ratio of diS-C3(3) in W303-1A WT and isogenic tok1Δ yeast in the presence (+) or absence (–) of 2% glucose and 0.4 μm AMD, as indicated. Each column is an average of three independent experiments. B, additive effect of gene deletions on membrane potential changes upon addition of AMD (0, 0.2, and 0.4 μm) in the absence of glucose. Isogenic WT, ena1-4Δ, nha1Δ, and tok1Δ strains are shown. C, outgrowth of WT and tok1Δ yeast in YPD medium following overnight incubation in CP buffer supplemented with 2% glucose and 8μm AMD as indicated. Following dilution of cells (1:20) into YPD, growth was measured periodically at A595 nm. Data are representative two independent experiments.
It is evident from Fig. 3A that in the absence of glucose, amiodarone can still elicit membrane hyperpolarization in the tok1 mutant, indicating the contribution of additional transporters. The yeast strain BW31 (13) lacks all four ENA genes encoding plasma membrane Na+ pumps, as well as NHA1, encoding the electrogenic plasma membrane alkali metal cation/H+ antiporter. In the absence of glucose, resting membrane potential in BW31 was reduced, relative to wild type, and hyperpolarization in response to amiodarone was modestly decreased (Fig. 3B). Deletion of TOK1 in this mutant background further reduced resting membrane potential and amiodarone-induced hyperpolarization (Fig. 3B). In the presence of glucose, however, none of these gene deletions altered membrane potential, either in the presence or absence of amiodarone (data not shown), as in the case of tok1Δ (Fig. 3A). We conclude that together, Tok1 and other cation transporters are important for maintaining membrane potential in the absence of Pma1 function.
Further evidence linking membrane hyperpolarization to amiodarone toxicity was obtained by evaluating cell viability in the tok1Δ strain relative to wild type. Initial experiments with short incubation times failed to reveal statistically significant differences in dose response to amiodarone toxicity (not shown); however, following longer (overnight) incubation with 8 μm amiodarone, tok1Δ mutants exhibited significantly reduced lag times (and hence, increased viability) in the absence but not the presence of glucose (Fig. 3C), consistent with results from drug-induced membrane polarization. In the absence of amiodarone, both tok1Δ and wild type cells displayed similar growth characteristics (Fig. 3C).
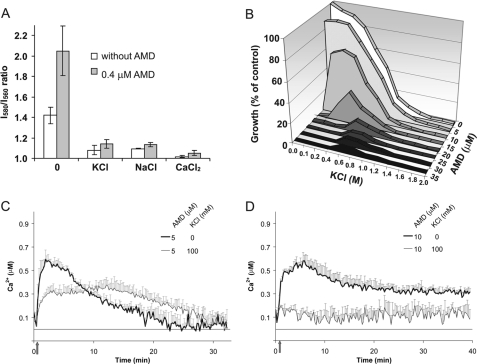
Depolarization by High Salt Blocks Amiodarone Toxicity—We have shown that single or multiple gene deletions that decrease membrane potential also have a protective effect against amiodarone toxicity. As an alternative approach to investigating the role of membrane potential in drug-induced calcium influx and cell death, we evaluated the effect of high concentrations of salts known to depolarize the membrane. In Fig. 4A, 100 mm concentrations of KCl, NaCl, or CaCl2 are shown to effectively reduce resting membrane potential. Under these conditions, amiodarone was unable to elicit significant hyperpolarization. Next, we evaluated the effect of high salt on amiodarone toxicity. Following 24 h of growth, the minimal inhibitory concentration of amiodarone was between 5 and 10 μm, as reported previously (2). When added to cultures, KCl had a protective effect in the range 0.1–1 m (Fig. 4B), with maximal protection observed close to the MIC. Thus, 100 mm KCl improved growth in 10 μm amiodarone from 5 to 60% of drug-free control. Previously, we showed that amiodarone toxicity is tightly coupled to calcium influx (8). We hypothesized that the increased viability seen in the presence of high salt was because of decreased calcium influx. Amiodarone-induced calcium influx was evaluated by aequorin luminescence. As reported previously (2), low doses of amiodarone elicit a burst of calcium within minutes (Fig. 4, C and D). In the presence of 100 mm KCl, the calcium burst was both reduced and delayed; more complete abrogation of the calcium burst (Fig. 4D) corresponded with increased protection from amiodarone toxicity (Fig. 4B). Similar results were observed with 100 mm NaCl (not shown) and 100 mm CaCl2 (8). We conclude that decreased resting membrane potential interferes with the ability of amiodarone to hyperpolarize the membrane, resulting in lower Ca2+ influx and, consequently, increased viability.
FIGURE 4.
Extracellular cations depolarize the membrane and diminish amiodarone toxicity. A, I580/I560 emission ratio of diS-C3(3) in WT (W303-1A) in CP buffer supplemented as indicated with 100 mm concentrations of KCl, NaCl, and CaCl2 and 0.4 μm AMD. B, growth was monitored in the presence of AMD and KCl as indicated. Control (100%) growth was in SC medium in the absence of added salt or drug. Data are representative of two independent experiments. C and D, aequorin-coelenterazine luminescence in WT (BY4742) yeast was measured following injection of AMD (5 or 10μm; arrow) in the presence or absence of 100 mm KCl. Data are average of triplicates and are representative of three independent experiments.
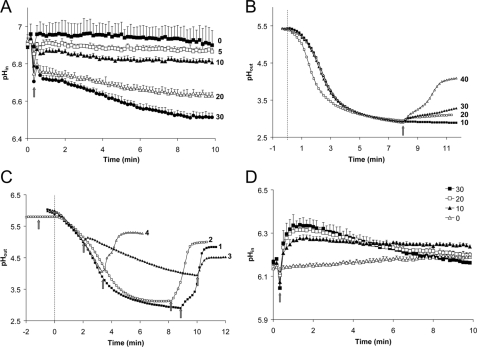
Toxic Levels of Amiodarone Trigger H+ Influx—Re-energization of yeast by glucose elicits a rapid and transient cytosolic acidification (22), followed by alkalinization upon activation of the plasma membrane H+ pump, Pma1 (23). Given the hyperpolarizing effect of both glucose and amiodarone, we investigated whether drug exposure also elicited cytoplasmic acidification. As seen in Fig. 5A, amiodarone caused an immediate and dose-dependent decrease in cytoplasmic pH, as measured by the ratiometric pH probe, pHluorin. Toxic levels of drug triggered significant (∼0.4 pH unit) acidification of pHin, which failed to recover to resting levels, consistent with loss of metabolic activity and cell death (8). Further evidence for drug-induced H+ influx came from monitoring medium pH. It is known that glucose activation of Pma1 results in H+ extrusion that can be monitored by decrease in pHout (Fig. 5B). Addition of toxic levels of amiodarone to glucose-activated cells caused a dose-dependent alkalinization of pHout (Fig. 5B), consistent with cytoplasmic acidification seen in Fig. 5A. The extent of medium alkalinization was proportional to the pH gradient across the cell membrane, with little or no alkalinization when the drug was added shortly after or before glucose addition. Thus, amiodarone elicited a large alkalinization of pHout when added after maximal pH gradient was established (Fig. 5C, trace 1). In contrast, the drug had no effect when added just before glucose (Fig. 5C, trace 2), although a second addition after pH gradient formation elicited large alkalinization of pHout. Addition of the drug at intermediate stages in pH gradient formation had intermediate effect (Fig. 5C, traces 3 and 4). Consistent with a diminished effect of amiodarone on de-energized cells, we also observed no cytoplasmic acidification in cells resuspended in medium lacking glucose (Fig. 5D).
FIGURE 5.
Amiodarone induces cytosolic proton influx and medium alkalinization. A, cytoplasmic pH was monitored using the fluorescent pH indicator, pHluorin, expressed in WT (BY4742) yeast. Fluorescence emissions (410/485 nm) ratios were measured in response to amiodarone addition (0–30 μm; arrow), and pH was calculated after calibration as described under “Experimental Procedures.” Data are averaged from three independent experiments. B, extracellular pH was monitored following addition of 2% glucose (gray line; time 0). The arrow shows addition of amiodarone (10, 20, 30, and 40 μm). Data are representative of two independent experiments. C, effect of a pH gradient on amiodarone-mediated alkalinization was monitored as in B. Glucose was injected at gray line (time 0); arrows indicate addition of amiodarone (10 μm). D, cytoplasmic pH derived from fluorescence emissions (410/485 nm) ratios as described in A were measured in response to amiodarone addition (0–30 μm; arrow) in the absence of glucose. Data are averaged from three independent experiments.
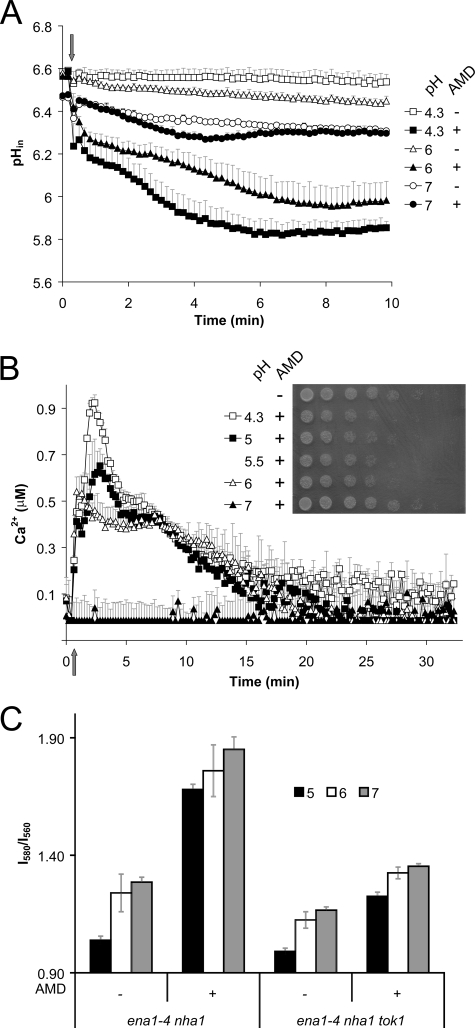
These observations prompted us to examine the role of external pH in the cellular response to amiodarone. Amiodarone elicited a robust influx of H+ (Fig. 6A) and Ca2+ (Fig. 6B) in SC medium (pH ∼4.3) and in medium adjusted to pH 5 (not shown). Further small increases in external pH to 5.5–6 significantly reduced the extent of cytoplasmic acidification and Ca2+ burst. Essentially, no cation influx was observed at pH ≥7. Concomitantly, cell viability was unaffected by drug at these alkaline pH values (Fig. 6B, inset). Together, these findings point to a role for both Ca2+ and H+ influx in mediating amiodarone toxicity. We note that the ability of drug to elicit membrane hyperpolarization was not diminished at higher external pH (Fig. 6C). Thus, although amiodarone can interact with the membrane independently of external pH, a pH-dependent step activates cation influx and is essential for ensuing drug toxicity.
FIGURE 6.
pH dependence of cation influx and amiodarone toxicity. A, cytoplasmic pH was monitored using pHluorin fluorescence as in Fig. 5A, in WT (BY4742) yeast resuspended in SC medium adjusted to the indicated pH. Amiodarone (30 μm) or H2O was injected into the cell suspension at the arrow. Data are the average of triplicate measurements. B, cytoplasmic Ca2+ was monitored using aequorin-coelenterazine luminescence in cells resuspended in SC medium adjusted to the indicated pH. Amiodarone (10 μm) was injected into the cell suspension at the arrow. Data are the average of triplicate measurements. Inset, viability was assessed in cultures (0.5 A600/ml) following incubation in SC medium adjusted to the indicated pH with amiodarone (40 μm) for 30 min, followed by serial 3-fold dilutions on YPD agar. C, membrane potential was measured using diS-C3(3) fluorescence as in Fig. 1A in CP buffer adjusted to the indicated pH and in the presence (+) or absence (–) or AMD (0.4 μm). Strains with deletions in the indicated genes were evaluated.
DISCUSSION
Reciprocal Roles of Proton and Alkali Metal Cation Transporters in Maintaining Membrane Potential—Although it is well known that the plasma membrane H+-ATPase, Pma1, is activated in glucose medium, our measurements of membrane potential reveal essentially no contribution by this ATP-driven H+ pump in the absence of glucose, as seen by a lack of effect of the pma1-105 mutation on both resting membrane potential and amiodarone-induced hyperpolarization. This tight regulation could be advantageous in conserving ATP in energy-starved conditions. Instead, we show that in the absence of glucose, the outwardly rectifying K+ channel Tok1 maintains the membrane potential (12), along with other cation transporters such as the Na+(K+)/H+ antiporter Nha1 and the Na+(K+)-ATPases encoded by the ENA genes. Conversely, we could not detect significant contribution of Tok1, Nha1, and Ena transport systems to the membrane potential in glucose medium (data not shown), suggesting a reciprocal role of these transporters in maintaining membrane potential. Electrophysiological recordings of Tok1 have shown outward K+ currents at depolarizing potentials, likely to ensue in the absence of glucose and Pma1 function (24, 25). Upon hyperpolarization, the channel occupies multiple closed states, with increasing negative potentials trapping the channel in deeper inactive states. We note that the additive effect of multiple gene deletions on amiodarone-mediated hyperpolarization is consistent with the absence of any specific protein target; rather, our data suggest a general membrane-mediated effect as discussed below.
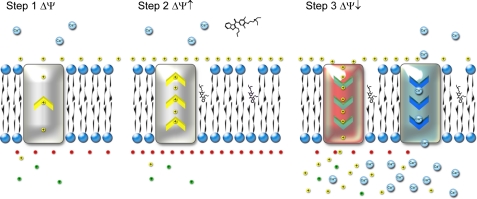
Cation Influx Channels Open upon Membrane Hyperpolarization—We show that membrane hyperpolarization by amiodarone correlates directly with drug toxicity. Thus, (i) increased hyperpolarization in glucose medium correlates with increased drug toxicity; (ii) attenuation of hyperpolarization by pma1-105 mutation, or by tok1Δ and other gene deletions, diminishes drug toxicity; and (iii) membrane depolarization by salts (KCl, NaCl, or CaCl2) also confers protection against amiodarone. Furthermore, we show that hyperpolarization is linked to, and likely precedes, calcium influx. Low (<1 μm) concentrations of amiodarone cause membrane hyperpolarization in the absence of detectable levels of calcium or proton influx. Around 4 μm and higher drug concentrations, hyperpolarization is transient and rapidly reversed (Fig. 1C), consistent with cation influx observed at these concentrations (2) (Fig. 4). These observations are reminiscent of earlier studies by Eilam and Chernichovsky (26) who monitored Ca2+ uptake in yeast as a function of increasing ΔΨ. Artificial increases of membrane potential, even in the absence of glucose, was seen to drive Ca2+ uptake suggesting that Ca2+ influx was mediated by channels that opened when ΔΨ hyperpolarized to values more negative than a certain threshold. They further demonstrated that glucose addition to de-energized yeast caused transient cytoplasmic acidification, increased cAMP levels, and Ca2+ influx (27, 28). Taken together with our observations, we suggest that amiodarone elicits membrane hyperpolarization that drives cation influx. In this model, at amiodarone concentrations corresponding with growth toxicity, the resulting calcium and proton transients can overwhelm homeostatic mechanisms and lead to cell death (Fig. 7). Hyperpolarization-activated and low extracellular pH-dependent Ca2+-permeable ion channels have been described, although not yet cloned, in plant root hairs, pollen grains, and tubes, where they are important in cell expansion and elongation (29, 30). Our studies predict the existence of similar channels in yeast, distinct from depolarization-activated ion channels, which could be potential drug targets.
FIGURE 7.
Proposed mechanism of amiodarone toxicity. When added to cells maintained at resting membrane potential (Step 1), amiodarone intercalates into the bilayer (35) and may alter lipid fluidity (33), resulting in membrane hyperpolarization (Step 2). At higher doses, the membrane depolarizes as calcium and protons rush into the cytosol (Step 3), disrupting ion homeostasis and leading to cell death.
Membrane Active Compounds Are Effective Antifungals—As a cationic amphiphilic compound, amiodarone exhibits a very high partition coefficient (>10,000; Ref. 31) for lipid membranes, and has been reported to have an ordering effect on the fluid state of polar lipids (32, 33). It is well known that the physico-chemical composition of lipids modulates activity of membrane proteins, including pumps, channels, and transporters, which could lead to the membrane potential changes and alterations in ion permeability described here. Alternatively, passive leak rates may be reduced by membrane ordering effects of the drug. Future experiments could address the hypothesis that the microbicidal effects of amiodarone are mediated by its influence on the membrane bilayer, rather than by binding to one or few specific protein target(s), as in conventional drugs. Indeed, published (2) and ongoing studies3 with yeast mutants indicate that membrane lipid composition can modulate hypersensitivity or tolerance to amiodarone. Thus, amiodarone may be one of a growing number of compounds, including microbicidal peptides (e.g. 34), which selectively disrupt target membrane function based on differences in lipid composition between host and pathogen. Understanding the basis of its fungicidal activity in vitro may lead to the development of more effective drug combinations to combat life-threatening fungal infections in vivo.
This work was supported, in whole or in part, by National Institutes of Health Grant R01AI065983 (to R. R.). This work was also supported by Czech Grants MSMT LC531 and AV0Z 50110509 (to H. S.) and GA AS CR KJB500110701 (to L. M.). The costs of publication of this article were defrayed in part by the payment of page charges. This article must therefore be hereby marked “advertisement” in accordance with 18 U.S.C. Section 1734 solely to indicate this fact.
Footnotes
The abbreviations used are: diS-C3(3), 3,3′-dipropylthiacarbocyanine iodide; CCCP, carbonyl cyanide p-chlorophenylhydrazone; AMD, amiodarone; WT, wild type.
Y. Q. Zhang and R. Rao, unpublished observations.
References
- 1.Courchesne, W. E. (2002) J. Pharmacol. Exp. Ther. 300 195–199 [DOI] [PubMed] [Google Scholar]
- 2.Gupta, S. S., Ton, V. K., Beaudry, V., Rulli, S., Cunningham, K., and Rao, R. (2003) J. Biol. Chem. 278 28831–28839 [DOI] [PubMed] [Google Scholar]
- 3.Afeltra, J., Vitale, R. G., Mouton, J. W., and Verweij, P. E. (2004) Antimicrob. Agents Chemother. 48 1335–1343 [DOI] [PMC free article] [PubMed] [Google Scholar]
- 4.Guo, Q., Sun, S., Yu, J., Li, Y., and Cao, L. (2008) J. Med. Microbiol. 57 457–462 [DOI] [PubMed] [Google Scholar]
- 5.Courchesne, W. E., and Ozturk, S. (2003) Mol. Microbiol. 47 223–234 [DOI] [PubMed] [Google Scholar]
- 6.Pozniakovsky, A. I., Knorre, D. A., Markova, O. V., Hyman, A. A., Skulachev, V. P., and Severin, F. F. (2005) J. Cell Biol. 168 257–269 [DOI] [PMC free article] [PubMed] [Google Scholar]
- 7.Zhang, Y. Q., and Rao, R. (2007) J. Biol. Chem. 282 37844–37853 [DOI] [PubMed] [Google Scholar]
- 8.Muend, S., and Rao, R. (2008) FEMS Yeast Res. 8 425–431 [DOI] [PMC free article] [PubMed] [Google Scholar]
- 9.Serrano, R. (1983) FEBS Lett. 156 11–14 [DOI] [PubMed] [Google Scholar]
- 10.Matsumoto, T. K., Ellsmore, A. J., Cessna, S. G., Low, P. S., Pardo, J. M., Bressan, R. A., and Hasegawa, P. M. (2002) J. Biol. Chem. 277 33075–33080 [DOI] [PubMed] [Google Scholar]
- 11.Wallis, J. W., Chrebet, G., Brodsky, G., Rolfe, M., and Rothstein, R. (1989) Cell 58 409–419 [DOI] [PubMed] [Google Scholar]
- 12.Maresova, L., Urbankova, E., Gaskova, D., and Sychrova, H. (2006) FEMS Yeast Res. 6 1039–1046 [DOI] [PubMed] [Google Scholar]
- 13.Kinclova-Zimmermannova, O., Zavrel, M., and Sychrova, H. (2005) J. Biol. Chem. 280 30638–30647 [DOI] [PubMed] [Google Scholar]
- 14.Stevens, H. C., and Nichols, J. W. (2007) J. Biol. Chem. 282 17563–17567 [DOI] [PubMed] [Google Scholar]
- 15.Maresova, L., and Sychrova, H. (2007) BioTechniques 43 667–672 [DOI] [PubMed] [Google Scholar]
- 16.Denksteinova, B., Gaskova, D., Herman, P., Vecer, J., Malinsky, J., Plasek, J., and Sigler, K. (1997) Folia Microbiol. (Praha) 42 221–224 [DOI] [PubMed] [Google Scholar]
- 17.Malac, J., Urbankova, E., Sigler, K., and Gaskova, D. (2005) Int. J. Biochem. Cell Biol. 37 2536–2543 [DOI] [PubMed] [Google Scholar]
- 18.Brett, C. L., Tukaye, D. N., Mukherjee, S., and Rao, R. (2005) Mol. Biol. Cell 16 1396–1405 [DOI] [PMC free article] [PubMed] [Google Scholar]
- 19.Gradmann, D., Hansen, U. P., Long, W. S., Slayman, C. L., and Warncke, J. (1978) J. Membr. Biol. 39 333–367 [DOI] [PubMed] [Google Scholar]
- 20.Ballarin-Denti, A., Slayman, C. L., and Kuroda, H. (1994) Biochim. Biophys. Acta 1190 43–56 [DOI] [PubMed] [Google Scholar]
- 21.Perlin, D. S., Harris, S. L., Seto-Young, D., and Haber, J. E. (1989) J. Biol. Chem. 264 21857–21864 [PubMed] [Google Scholar]
- 22.Ramos, S., Balbin, M., Raposo, M., Valle, E., and Pardo, L. A. (1989) J. Gen. Microbiol. 135 2413–2422 [DOI] [PubMed] [Google Scholar]
- 23.Carmelo, V., Santos, H., and Sa-Correia, I. (1997) Biochim. Biophys. Acta 1325 63–70 [DOI] [PubMed] [Google Scholar]
- 24.Roberts, S. K. (2003) Eukaryot. Cell 2 181–190 [DOI] [PMC free article] [PubMed] [Google Scholar]
- 25.Vergani, P., Miosga, T., Jarvis, S. M., and Blatt, M. R. (1997) FEBS Lett. 405 337–344 [DOI] [PubMed] [Google Scholar]
- 26.Eilam, Y., and Chernichovsky, D. (1987) J. Gen. Microbiol. 133 1641–1649 [DOI] [PubMed] [Google Scholar]
- 27.Eilam, Y., Othman, M., and Halachmi, D. (1990) J. Gen. Microbiol. 136 2537–2543 [DOI] [PubMed] [Google Scholar]
- 28.Eilam, Y., and Othman, M. (1990) J. Gen. Microbiol. 136 861–866 [DOI] [PubMed] [Google Scholar]
- 29.Shang, Z.-L., Ma, L.-G., Zhang, H.-L., He, R.-R., Wang, X.-C., Cui, S.-J., and Sun, D.-Y. (2005) Plant Cell Physiol. 46 598–608 [DOI] [PubMed] [Google Scholar]
- 30.Qu, H. Y., Shang, Z. L., Zhang, S. L., Liu, L. M., and Wu, J. Y. (2007) New Phytol. 174 524–536 [DOI] [PubMed] [Google Scholar]
- 31.Trumbore, M., Chester, D. W., Moring, J., Rhodes, D., and Herbette, L. G. (1988) Biophys. J. 54 535–543 [DOI] [PMC free article] [PubMed] [Google Scholar]
- 32.Chatelain, P., and Laruel, R. (1985) J. Pharmacol. Sci. 74 783–784 [DOI] [PubMed] [Google Scholar]
- 33.Rosa, S. M., Antunes-Madeira, M. C., Matos, M. J., Jurado, A. S., and Madeira, V. M. (2000) Biochim. Biophys. Acta 1487 286–295 [DOI] [PubMed] [Google Scholar]
- 34.Marx, F., Binder, U., Leiter, E., and Posci, I. (2008) Cell. Mol. Life Sci. 65 445–454 [DOI] [PMC free article] [PubMed] [Google Scholar]
- 35.Herbette, L. G., Trumbore, M., Chester, D. W., and Katz, A. M. (1988) J. Mol. Cell. Cardiol. 20 373–378 [DOI] [PubMed] [Google Scholar]


