

Abstract
The roles of toxin-antitoxin (TA) systems in bacteria have been debated. Here, the role of five TA systems in regard to biofilm development was investigated (listed as toxin/antitoxin: MazF/MazE, RelE/RelB, ChpB, YoeB/YefM, and YafQ/DinJ). Although these multiple TA systems were reported previously to not impact bacterial fitness, we found that deletion of the five TA systems decreased biofilm formation initially (8 h) on three different surfaces and then increased biofilm formation (24 h) by decreasing biofilm dispersal. Whole-transcriptome profiling revealed that the deletion of the five TA systems induced expression of a single gene, yjgK, which encodes an uncharacterized protein; quantitative real-time PCR (qRT-PCR) confirmed consistent induction of this gene (at 8, 15, and 24 h). Corroborating the complex phenotype seen upon deleting the TA systems, overexpression of YjgK decreased biofilm formation at 8 h and increased biofilm formation at 24 h; deletion of yjgK also affected biofilm formation in the expected manner by increasing biofilm formation after 8 h and decreasing biofilm formation after 24 h. In addition, YjgK significantly reduced biofilm dispersal. Whole-transcriptome profiling revealed YjgK represses fimbria genes at 8 h (corroborated by qRT-PCR and a yeast agglutination assay), which agrees with the decrease in biofilm formation upon deleting the five TA systems at 8 h, as well as that seen upon overexpressing YjgK. Sand column assays confirmed that deleting the five TA systems reduced cell attachment. Furthermore, deletion of each of the five toxins increased biofilm formation at 8 h, and overexpression of the five toxins repressed biofilm formation at 8 h, a result that is opposite that of deleting all five TA systems; this suggests that complex regulation occurs involving the antitoxins. Also, the ability of the global regulator Hha to reduce biofilm formation was dependent on the presence of these TA systems. Hence, we suggest that one role of TA systems is to influence biofilm formation.
The role of toxin-antitoxin (TA) systems in cell physiology is enigmatic. Nine hypothetical biological functions of TA systems have been proposed (24), including growth control, persister formation, antiphage measures (28), and general stress response. In contrast, it has been reported that there is little benefit in regard to bacterial fitness and competitiveness by using a strain that lacks the five best-studied proteic TA systems, Δ5, which lacks (listed in the form toxin/antitoxin) MazF/MazE, RelE/RelB, ChpB, YoeB/YefM, and YafQ/DinJ (40).
TA systems have been found on the chromosomes of many bacteria, as well as on low-copy-number plasmids (10). Typically, TA systems consist of pairs of genes: one for a stable toxin that can cause cell death by disrupting an essential cellular process and the other for a labile antitoxin that can bind to and block activity of the toxin (10, 24).
Recent studies with Staphylococcus aureus and its putative holin and anti-holin system, Cid/Lrg, have linked cell death and lysis to biofilm development, and reduced amounts of extracellular DNA (a structural component of biofilms) were observed with bacterial cells that lack the putative holin Cid (3). In addition, Pseudomonas aeruginosa uses autolysis via prophage to allow dispersal from the biofilm matrix (46), and Pseudoalteromonas tunicata uses the autolytic protein AlpP to undergo autolysis for biofilm dispersal (25). The dispersal steps (including detachment) from biofilm development may be essential to permit bacteria to escape the architecture of the biofilm. Several specialized regulatory proteins (CsrA in Escherichia coli and BdlA in P. aeruginosa) have important roles in biofilm dispersal (15, 27), and biofilm dispersal may be affected by environmental conditions such as nutrient availability and temperature (35).
Although cell death and lysis are linked to biofilm formation, there are limited reports for the effect of TA systems on biofilm formation. For example, in Streptococcus mutans, mutants lacking homologues of the mazF and relE toxin genes had no differences in biofilm formation compared to parental strains (22). In contrast, in E. coli, we recently found the toxin Hha controls cell death and biofilm dispersal via its activation of prophage lytic genes (e.g., rzpD, yfjZ, appY, and alpA) and several proteases (e.g., Lon, ClpP, and ClpX), which may activate toxins by degrading antitoxins (11). Furthermore, MqsR, which was identified as expressed in biofilms (31) and which is a putative toxin in conjunction with antitoxin B3021 (38), influences biofilm formation (14). In an effort to investigate further this relationship between TA systems and biofilm formation, we hypothesized that if the five TA systems of the Δ5 strain do not participate in the general stress response of planktonic cells, perhaps these TA systems may provide some other function in biofilms. Here, we show the five TA systems of E. coli have a profound temporal effect on biofilm formation that is related to type 1 fimbriae and biofilm dispersal. Also, when expressed individually, the five toxins reduced biofilm formation. A whole-transcriptome study with the Δ5 strain was used to identify a single gene, yjgK, that is influenced by the five TA systems, and another whole-transcriptome study was used to link YjgK to fimbriae.
MATERIALS AND METHODS
Bacterial strains, plasmids, and growth conditions.
Bacterial strains and plasmids used in the present study are listed in Table 1. E. coli MG1655 wild-type and isogenic Δ5 (MG1655 ΔmazEF ΔrelBEF ΔchpB ΔyefM-yoeB ΔdinJ-yafQ, also known as LVM100) were obtained from L. Van Melderen (40). MazF, RelE, ChpB, YoeB, and YafQ are proteic toxins, while MazE, RelB, YefM, and DinJ are antitoxins. For deleting and overexpressing genes for BW25113, we used the Keio collection (1) and ASKA library (17), respectively, from the Genome Analysis Project in Japan. All experiments were conducted in Luria-Bertani (LB) medium (36) at 37°C (except the curli assay and extracellular autoinducer-2 [AI-2] assay). Kanamycin (50 μg/ml) was used for preculturing the isogenic knockout mutants, and chloramphenicol (30 μg/ml) and ampicillin (100 μg/ml) were used for selecting pCA24N-based plasmids and pLW11, respectively.
TABLE 1.
Bacterial strains and plasmids used in this study
| Strain or plasmid | Genotype and/or relevant characteristicsa | Source or reference |
|---|---|---|
| Strains | ||
| E. coli K-12 | ||
| MG1655 | F− λ−ilvG rfb-50 rph-1 | 40 |
| LVM100 (Δ5) | MG1655 ΔmazEF ΔrelBEF ΔchpB ΔyefM-yoeB ΔdinJ-yafQ | 40 |
| MG1655 fimA | K-12 MG1655 ΔfimA ΩKmr | This study |
| MG1655 yefM | K-12 MG1655 ΔyefM::Tn5Kan-2 | 16 |
| Δ5 fimA | Δ5 ΔfimA ΩKmr | This study |
| BW25113 | lacIqrrnBT14 ΔlacZWJ16hsdR514 ΔaraBADAH33 ΔrhaBADLD78 | 1 |
| BW25113 fimA | K-12 BW25113 ΔfimA ΩKmr | 1 |
| BW25113 yjgK | K-12 BW25113 ΔyjgK ΩKmr | 1 |
| BW25113 mazF | K-12 BW25113 ΔmazF ΩKmr | 1 |
| BW25113 relE | K-12 BW25113 ΔrelE ΩKmr | 1 |
| BW25113 chpB | K-12 BW25113 ΔchpB ΩKmr | 1 |
| BW25113 yoeB | K-12 BW25113 ΔyoeB ΩKmr | 1 |
| BW25113 yafQ | K-12 BW25113 ΔyafQ ΩKmr | 1 |
| V. harveyi | ||
| BB170 | BB120 luxN::Tn5 (sensor 1−, sensor 2−) | 2 |
| Plasmids | ||
| pCA24N | Cmr; lacIq, pCA24N | 17 |
| pCA24N-yjgK | Cmr; lacIq, pCA24N PT5-lac::yjgK+ | 17 |
| pCA24N-relB | Cmr; lacIq, pCA24N PT5-lac::relB+ | 17 |
| pCA24N-dinJ | Cmr; lacIq, pCA24N PT5-lac::dinJ+ | 17 |
| pCA24N-yefM | Cmr; lacIq, pCA24N PT5-lac::yefM+ | 17 |
| pCA24N-mazF | Cmr; lacIq, pCA24N PT5-lac::mazF+ | 17 |
| pCA24N-relE | Cmr; lacIq, pCA24N PT5-lac::relE+ | 17 |
| pCA24N-chpB | Cmr; lacIq, pCA24N PT5-lac::chpB+ | 17 |
| pCA24N-yoeB | Cmr; lacIq, pCA24N PT5-lac::yoeB+ | 17 |
| pCA24N-yafQ | Cmr; lacIq, pCA24N PT5-lac::yafQ+ | 17 |
| pLW11 | Ampr; pFZY1 derivative containing plsrACDBFG::lacZ | 44 |
Kmr, Cmr, and Ampr are kanamycin, chloramphenicol, and ampicillin resistance, respectively.
P1 transduction.
Bacteriophage P1 transduction was used to construct fimA deletion mutations in MG1655 and Δ5 using the rapid gene knockout method (23). Briefly, to construct the MG1655 fimA and Δ5 fimA strains, bacteriophage P1 was grown with BW25113 ΔfimA Ω Kmr, and the lysate was used to transduce MG1655 and Δ5 by selecting for kanamycin-resistant colonies.
Crystal violet biofilm assay.
The biofilm formation assay was performed in 96-well polystyrene, polyvinyl chloride, and polypropylene plates (Corning Costar, Cambridge, MA) as described previously (11). Briefly, cells were inoculated with an initial turbidity at 600 nm of 0.05 for 8 and 24 h without shaking, and then the cell density (turbidity at 620 nm) and total biofilm (absorbance at 540 nm) were measured by using 0.1% crystal violet staining. Normalized biofilm was calculated by dividing the total biofilm by the bacterial growth for each strain. Two independent cultures were used for each strain. For taking biofilm images, 14-ml sterile polystyrene tubes were used. In addition, the dispersal phenotypes were monitored using the crystal violet biofilm assay with polystyrene from 15 h to 34 h for Δ5 versus MG1655 and from 15 to 24 h for BW25113 yjgK versus BW25113.
Cell surface assays.
All experiments were performed with at least two independent cultures after 15 to 18 h except for the sand column attachment assay, which was performed as described previously (19) with slight modifications to prevent damage to the fimbriae. Cells were not centrifuged or vortex mixed, were grown from an initial turbidity at 600 nm of 0.05 to a turbidity of 0.5 to 0.6 in 200 ml of LB medium at 37°C, and were directly added to the sand column (12-cm syringe column filled with 18 g sterile sea sand) at a flow rate of 0.5 ml/min. Fourteen fractions (each 1.5 ml) were collected over 50 min, and attachment was calculated as 1 − (efflux turbidity/input turbidity).
Cell aggregation was measured as described previously (50). Briefly, overnight cultures were washed and diluted in 3 ml of LB medium (turbidity at 600 nm of 2.5) in 14-ml sterile tubes; after the tubes were incubated quiescently for 15 h, the turbidity was measured 5 mm underneath the surface to determine the cell concentration for an indirect measure of the cell aggregation.
Cell surface hydrophobicity was measured as published previously by extracting stationary-phase cells with hexane isomers (H302-4; Fisher Scientific Co., Pittsburgh, PA) (50). The extracted mixtures were vortex mixed thoroughly for 1 min. After standing for 15 min at room temperature for phase separation, the aqueous phase was removed, and the cell turbidity was measured.
For the curli assay, which was conducted at 30°C since curli is formed preferentially at this temperature, LB agar supplemented 20 μg of Congo red (Sigma-Aldrich Corp., St. Louis, MO)/ml and 10 μg of Coomassie brilliant blue (Sigma-Aldrich Corp.)/ml was used as described previously (50) to visualize E. coli curli expression by inspecting the red color intensity after 16 h of incubation (which is proportional to the curli concentration).
Total exopolysaccharide (EPS) was assayed as described previously (49) using approximately 60 mg of cellular material collected from the surfaces of LB agar plates after 18 h of incubation. Glucose equivalents in the EPS samples were quantified by using a calibration curve with a glucose standard solution (GAHK20; Sigma-Aldrich Corp.) from 10 to 80 μg/ml, and the values were normalized by cell turbidity at 600 nm. Colanic acid from the same samples was assayed by measuring fucose (49). An l-fucose (Acros Organics, Morris Plains, NJ) calibration curve from 10 to 60 μg/ml was used to determine the fucose concentration, and these values were normalized by the cell turbidity at 600 nm.
Type 1 fimbria production was assayed via the yeast agglutination assay as described previously (11) and also by quantitative real-time PCR (qRT-PCR; see below). After growth for 18 h on LB plates, bacterial cells were collected from the surface of LB agar plates and resuspended in phosphate-buffered saline (137 mM NaCl, 2.7 mM KCl, 8 mM Na2HPO4, 2 mM KH2PO4 [pH 7.4]; turbidity at 600 nm of 5) and mixed with a 10% (wt/vol) brewer's yeast suspension (Acros Organics). A few drops (20 μl) of the mixture was put on microscope glass slides, and yeast agglutination was evaluated after 5 min.
Cell signaling assays.
All experiments were performed with at least two independent cultures for each strain. Extracellular AI-2 was assayed as described previously (32). Cell-free supernatants were collected after 1, 3, and 9 h of incubation and were added at a concentration of 10% (vol/vol) to the reporter strain Vibrio harveyi BB170, which was grown in AB medium overnight and diluted 1:5,000 into the fresh AB medium. After growth at 30°C for 4 h (the optimal incubation time to minimize background), bioluminescence was measured with a 20/20 luminometer (Turner Design, Sunnyvale, CA). The cell density of the V. harveyi reporter strain was measured by spreading the cells on Luria marine plates and by counting CFU after 24 h. For the intracellular AI-2 assay for biofilm cells, plasmid pLW11 with the lsrACDBFG::lacZ fusion was used (44). Cells harboring this plasmid were cultured in 250 ml of fresh medium with 10 g of glass wool (Corning Glass Works, Corning, NY) for 15 h at 250 rpm to form a biofilm, and biofilm cells were harvested, washed, resuspended in ice-cold buffer solution, and sonicated on ice at a power level of 10 W for 2 min (four intervals of 30 s each; Fisher Scientific model 60 Sonic Dismembrator). The β-galactosidase activities were calculated as described previously (47).
Extracellular and intracellular indole concentrations were measured spectrophotometrically as described previously (9). The extracellular indole concentrations of MG1655 and Δ5 were measured at 3, 6, 9, and 12 h. Intracellular indole concentrations were also measured using 15-h biofilm cells by harvesting cells, washing them, resuspending them in cold LB medium, and sonicating them at a power level of 15 W for 1 min (four intervals of 15 s each). The cellular debris was removed by centrifugation for 1 min, and the concentration of indole in the supernatants was determined by the same methods used for extracellular indole.
RNA isolation and DNA microarrays.
Biofilms were formed on glass wool as described previously (31) using overnight cultures to inoculate 250 ml of LB medium with 10 g of glass wool (Corning Glass Works). After incubation for 8 h (for the yjgK microarray) and 15 h (for the Δ5 microarray) with shaking (250 rpm), biofilm cells were prepared by rinsing and sonicating the glass wool in sterile 0.85% NaCl solution at 0°C as described before (31). Total RNA was isolated from biofilm cells as described previously (31). The E. coli GeneChip Genome 2.0 array (Affymetrix, P/N 511302) was used and contains 10,208 probe sets for open reading frames, rRNA, tRNA, and intergenic regions for four E. coli strains: MG1655, CFT073, O157:H7-Sakai, and O157:H7-EDL933. Hybridization was performed for 16 h, and the total cell intensity was scaled to an average value of 500. The probe array images were inspected for any image artifact. Background values, noise values, and scaling factors of both arrays were examined and were comparable. The intensities of polyadenosine RNA control were used to monitor the labeling process. Corroborating the deletion mutations, the microarray signals of the yjgK gene and Δ5 genes (mazE, mazF, relB, relE, relF, chpB, yefM, yoeB, dinJ, and yafQ) had very low signals in their respective microarray experiments. For both sets of binary microarray comparisons to determine differential gene expression, if the gene with the larger transcription rate did not have a consistent transcription rate based on the 11 probe pairs (P < 0.05), these genes were not used. A gene was considered differentially expressed when the P value for comparing two chips was lower than 0.05 (to assure that the change in gene expression was statistically significant and that false positives arise less than 5%) and when the expression ratio was higher (2.0-fold for both sets of microarray experiments) than the standard deviation for all of the E. coli K-12 genes (1.1-fold for both). Gene functions were obtained from the Ecogene database (http://www.ecogene.org/).
Microarray accession numbers.
The biofilm differential gene expression data for MG1655 versus Δ5 and for BW25113 versus BW25113 yjgK have been deposited in the NCBI Gene Expression Omnibus (http://www.ncbi.nlm.nih.gov/geo/) and are accessible through accession numbers GSE11932 and GSE12701, respectively.
qRT-PCR.
qRT-PCR was performed by using the StepOne real-time PCR system (Applied Biosystems, Foster City, CA). A total of 50 ng of total RNA was used for the qRT-PCR using a SuperScript III Platinum SYBR Green One-Step qRT-PCR kit (Invitrogen, Carlsbad, CA). Primers were designed by using Primer3Input software (v0.4.0). Expression of the poly-β-1,6-N-acetyl-d-glucosamine genes (pgaA, pgaB, pgaC, and pgaD), sdiA, tnaA, fimA, and yjgK was determined by qRT-PCR after isolating RNA from biofilm cultures of MG1655 and Δ5 on glass wool for 15 h (for fimA and yjgK, biofilm RNA samples were analyzed for 8, 15, and 24 h). The expression of fimA was also determined by using RNA from 8-h biofilm cultures of BW25113 and BW25113 yjgK. The primers for qRT-PCR are listed in Table 2. The housekeeping gene rrsG was used to normalize the gene expression data. The annealing temperature was 60°C for all of the genes in the present study.
TABLE 2.
Oligonucleotide primers used for qRT-PCR used in this study
| Gene | Orientationa | Primer sequence (5′-3′) |
|---|---|---|
| fimA | F | GTTCTGCTGTCGGTTTTAACATTC |
| R | GGGTTGTTTCTGAACTAAATGTCG | |
| sdiA | F | TGATGAAATAGTGATGACGCCAGAG |
| R | CGTAACAGGCAACCTGGGTCTTATT | |
| tnaA | F | TGAAGAAGTTGGTCCGAATAACGTG |
| R | CTTTGTATTCTGCTTCACGCTGCTT | |
| yjgK | F | GAAGGCAATCGACTGTTTTATCTTA |
| R | AAATGCGATGTCTTTATCAGCTAAC | |
| pgaA | F | GCCAATTTACTCGCAGAAGC |
| R | TGACCAGTTCGGCATGAATA | |
| pgaB | F | AAGCAGATATTTTTAGTCGGGTTG |
| R | AACTTGTGCTCTGACTCTGTCATC | |
| pgaC | F | TTAGCACAGCGTTATGAGAACATT |
| R | ATCAATGCACACCAGATATTCACT | |
| pgaD | F | GATCTGCTGACGGGTTATTACTG |
| R | TCAGGTATTGCTAAGCTCTCTGC | |
| rrsG | F | TATTGCACAATGGGCGCAAG |
| R | ACTTAACAAACCGCTGACTT |
F, forward; R, reverse.
RESULTS
TA systems alter E. coli biofilm formation.
The five TA deletions did not affect cell growth (data not shown); however, deleting the five proteic TA systems resulted in less biofilm after 8 h and more biofilm after 24 h consistently on polystyrene, polyvinyl chloride, and polypropylene surfaces (Fig. 1). Hence, the deletion of the five TA systems results in biofilm formation that is altered in a temporal fashion.
FIG. 1.

(A) Normalized biofilm formation (total biofilm/growth) in LB medium at 37°C for MG1655 and Δ5 with 96-well plates of polystyrene (PS), polyvinyl chloride (PVC), and polypropylene (PP) after 8 and 24 h of incubation. (B) Biofilm images under the same culture conditions in 14-ml polystyrene tubes. The data are the average of 10 replicate wells from two independent cultures, and one standard deviation is shown.
Since dispersal is one of the developmental stages for biofilm formation (42), we also investigated whether the five TA systems of Δ5 change biofilm dispersal. After 34 h, deleting the five TA pairs decreased significantly biofilm dispersal compared to the MG1655 wild-type strain (Fig. 2A).
FIG. 2.

Time course of biofilm dispersal for MG1655 and Δ5 (A) and BW25113 and BW25113 yjgK (B) in 96-well polystyrene plates with LB medium at 37°C. Dispersal indicates the percentage of normalized biofilm (total biofilm/growth) that was removed at each time point compared to the 15-h normalized biofilm. The data are the averages of 10 replicate wells from two independent cultures, and one standard deviation is shown.
TA systems affect fimbriae and attachment but not poly-β-1,6-N-acetyl-d-glucosamine, aggregation, surface hydrophobicity, EPS, colanic acid, curli, or cell signals.
In the absence of conjugation plasmids (30), bacterial cell surface structures including flagella, fimbriae, autotransporter proteins, curli, and EPS are important for the development of biofilms (42). In addition, poly-β-1,6-N-acetyl-d-glucosamine, encoded by the pgaABCD locus, is involved in the attachment to abiotic surfaces and in biofilm formation for E. coli (42). To investigate whether the deletion of the five TA systems of Δ5 modifies surface-associated phenotypes, we evaluated sand column attachment, aggregation, cell surface hydrophobicity, total EPS, colanic acid, curli production, type 1 fimbriae (with yeast agglutination and qRT-PCR), and poly-β-1,6-N-acetyl-d-glucosamine production by qRT-PCR with pgaA, pgaB, pgaC, and pgaD specific primers. However, we found no significant differences in these phenotypes between the wild-type and Δ5 biofilm samples (data not shown) except for fimA expression and sand column attachment: deleting five TA systems repressed fimA transcription by (2 ± 1)-fold in biofilm samples at 8 h (no change at 15 and 24 h), and deleting the five TA systems reduced cell attachment to nearly the same degree as a fimA control (Fig. 3). These results indicate that the five TA systems have an important role in early biofilm development (8 h) that is related to fimbriae.
FIG. 3.
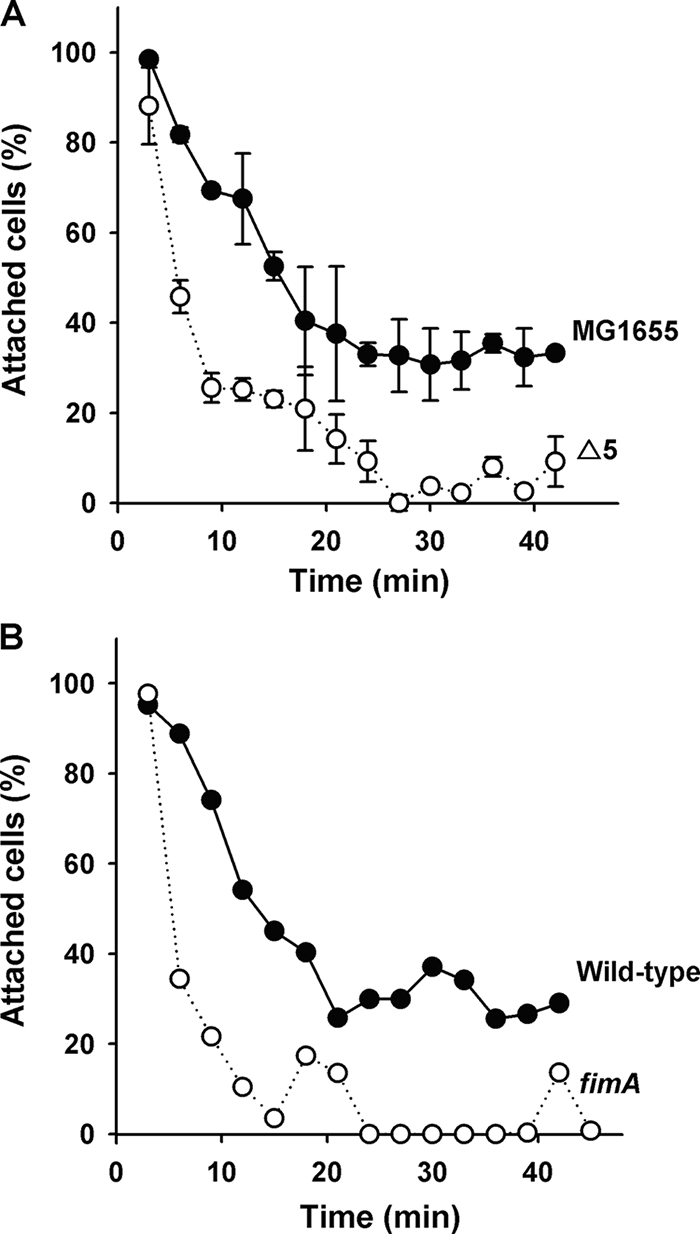
(A) Attachment to sand columns for MG1655 and Δ5 in LB medium at 37°C. (B) BW25113 versus BW25113 fimA was used as fimbria minus control. The data in panel A are the averages of two independent cultures, and one standard deviation is shown.
To confirm that the fimA mutation is directly related to biofilm formation, we investigated biofilm formation with MG1655 fimA at 8 and 24 h; no biofilm formation was observed upon deleting fimA after both 8 and 24 h (Fig. 4). Similar results were found with Δ5 fimA. Therefore, these results corroborate that type 1 fimbriae are critical for biofilm formation in E. coli strains and that the five TA systems may influence biofilm formation by influencing the expression of fimA.
FIG. 4.

Normalized biofilm formation (total biofilm/growth) in LB medium at 37°C for MG1655 and MG1655 fimA with 96-well polystyrene plates. The data are the averages of 10 replicate wells from two independent cultures, and one standard deviation is shown.
Cell signaling affects biofilm formation in E. coli (21); for example, AI-2 directly stimulates E. coli biofilms (14), and indole decreases biofilm formation through SdiA (20). To investigate whether cell signaling was altered by deleting the five TA systems, both extra- and intracellular AI-2 and indole concentrations were assayed, along with tnaA and sdiA transcription rates; however, there were no significant differences between the wild-type and Δ5 strains (data not shown). These results indicate that the five TA systems have a role in biofilm development that is not linked to cell signaling.
TA systems influence yjgK expression.
To explore further the role of the five TA systems in biofilm formation, a whole-transcriptome analysis of biofilm cells grown on glass wool for the wild-type and Δ5 strains was performed after 15 h. From the whole genome, only one gene, yjgK (b4252), was induced (3.0-fold) by deleting the five TA systems; there were no repressed genes (other than those of the deleted TA systems). The microarray data at 15 h were confirmed by qRT-PCR (along with data obtained at two other time points) with specific yjgK targeted primers; consistent with the microarray data, yjgK was induced after deleting the five TA systems by (8 ± 1)-fold at 8 h, (7 ± 1)-fold at 15 h, and (11 ± 1)-fold at 24 h in biofilms. Hence, deleting the five TA systems induces yjgK consistently.
YjgK controls biofilm formation in a manner consistent with deleting the five TA systems.
Deletion of yjgK increased biofilm formation after short incubations (8 h), while it decreased biofilm formation slightly after long incubations (24 h) (Fig. 5). Corroborating these results, overexpression of YjgK from pCA24N decreased biofilm formation after 8 h and increased biofilm after 24 h (Fig. 5). Hence, the changes seen in biofilm formation with the Δ5 strain may be explained in terms of the impact of YjgK on biofilm formation: during short incubations, induction of yjgK decreases biofilm formation, while after long incubations, continued induction of yjgK increases biofilm formation (Fig. 1A). In addition, deleting yjgK significantly increased biofilm dispersal (Fig. 2B), so YjgK decreases biofilm dispersal; hence, the five TA systems may control biofilm dispersal through YjgK, which explains the increase in biofilm formation at 24 h seen upon deleting the five TA systems (YjgK is expressed and biofilm dispersal is decreased).
FIG. 5.

Normalized biofilm formation (total biofilm/growth) after 8 h and 24 h of incubation in LB medium at 37°C for BW25113, BW25113 yjgK, and BW25113 yjgK/pCA24N-yjgK (complementation study). YjgK was induced by the addition of 0.5, 1, and 2 mM IPTG. The data are the average of 10 replicate wells from two independent cultures, and one standard deviation is shown.
YjgK represses fimbriae.
Given that the deletion of yjgK dramatically induced biofilm formation at 8 h (Fig. 5), a whole-transcriptome study was performed to see what genes were influenced by deleting yjgK in biofilms. Deleting yjgK induced three genes (fimA, fimI, and fecB) and repressed one gene (ryeA) by more than 2.0-fold (Table 3). Importantly, fimA (the major constituent of type 1 fimbriae) (18) and fimI (FimA homolog) (41) are required for type 1 fimbriae, which are necessary for biofilm formation on abiotic surfaces (37). Corroborating these results, other type 1 fimbria-related genes, including hofB (1.9-fold), fimB (1.7-fold), fimC (1.9-fold), fimD (1.7-fold), fimE (1.5-fold), fimF (1.6-fold), fimG (1.7-fold), and fimH (1.5-fold), were also induced by the deletion of yjgK (Table 3).
TABLE 3.
Differentially expressed genes in biofilm cells of BW25113 yjgK versus the BW25113 wild-type strain in LB medium after incubation for 8 h at 37°C
| Group and gene | b no. | Fold change | Description |
|---|---|---|---|
| Small RNA related | |||
| ryeA | b4432 | -2.0 | Novel small RNA, function unknown |
| Small toxin related | |||
| hokA | b4455 | -1.5 | Small toxic membrane polypeptide |
| hokE | b4415 | -1.3 | Small toxic membrane polypeptide |
| Cell motility related | |||
| fimA | b4314 | 3.0 | Fimbrin type 1, major structural subunit; |
| fimB | b4312 | 1.7 | Recombinase involved in phase variation; regulator for fimA |
| fimI | b4315 | 2.5 | Required for pilus biosynthesis, FimA homolog |
| fimC | b4316 | 1.9 | Periplasmic chaperone, required for type 1 fimbriae |
| fimD | b4317 | 1.7 | Outer membrane protein; export and assembly of type 1 fimbriae |
| fimE | b4313 | 1.5 | Recombinase involved in phase variation; regulator for fimA |
| fimF | b4318 | 1.6 | Fimbrial morphology |
| fimG | b4319 | 1.7 | Fimbrial morphology |
| fimH | b4320 | 1.5 | Minor fimbrial subunit, d-mannose specific adhesin |
| hofB | b0107 | 1.9 | Putative integral membrane protein involved in biogenesis of fimbriae, protein transport, and DNA uptake |
| Iron transport related | |||
| fecA | b4291 | 1.9 | Outer membrane receptor; citrate-dependent iron transport |
| fecB | b4290 | 2.3 | Citrate-dependent iron transport, periplasmic protein |
| fecC | b4289 | 1.6 | Citrate-dependent iron(III) transport protein, cytosolic |
| fecD | b4288 | 1.6 | Citrate-dependent iron transport, membrane-bound protein |
| fecE | b4287 | 1.9 | ATP-binding component of citrate-dependent iron(III) transport protein |
| fecR | b4292 | 1.6 | Regulator for fec operon, periplasmic |
| fecI | b4393 | 1.5 | Probable RNA polymerase sigma factor |
| Cell division related | |||
| ftsL | b0083 | 1.6 | Cell division protein; ingrowth of wall at septum |
| ftsQ | b0093 | 1.5 | Cell division protein; ingrowth of wall at septum |
| ftsZ | b0095 | 1.5 | Cell division; forms circumferential ring; tubulinlike GTP-binding protein and GTPase |
| Hydrogenase related | |||
| hyaB | b0973 | -1.6 | Hydrogenase-1 large subunit |
| hyaC | b0974 | -1.4 | Probable NiFe-hydrogenase 1 b-type cytochrome subunit |
| hyaD | b0975 | -1.5 | Processing of HyaA and HyaB proteins |
| hyaE | b0976 | -1.5 | Processing of HyaA and HyaB proteins |
| hyaF | b0977 | -1.4 | Nickel incorporation into hydrogenase-1 proteins |
To confirm the DNA microarray result that YjgK repressed type 1 fimbria-associated genes in 8-h biofilm cultures, both a yeast agglutination assay and qRT-PCR were utilized. As expected, the deletion of yjgK induced higher agglutination than the wild-type strain, indicating higher fimbria levels (data not shown). Also, this enhanced agglutination (fimbria) phenotype was repressed by the overexpression of YjgK with 1 mM IPTG (isopropyl-β-d-thiogalactopyranoside) (data not shown). In addition, qRT-PCR showed fimA was induced strongly [(8 ± 1)-fold] upon deleting yjgK in 8-h biofilms, but transcription of fimA was not altered greatly at 24 h. Therefore, YjgK represses (either directly or indirectly) type 1 fimbriae at 8 h, and the reduction in biofilm formation seen with the Δ5 strain at 8 h (Fig. 1A) and the repression of fimA seen with the Δ5 strain in 8 h biofilms may be explained by induction of YjgK, which results in the repression of fimbria genes (Table 3) and reduced biofilm formation (Fig. 5).
Also, upon deleting yjgK, the gene encoding a citrate-dependent iron transport protein FecB was induced 2.3-fold (5). Similar to the fim cluster, other ferric citrate transport-related genes were induced, including fecA (1.9-fold), fecC (1.6-fold), fecD (1.6-fold), fecE (1.9-fold), fecR (1.6-fold), and fecI (1.5-fold) (Table 3). Deleting yjgK also repressed genes encoding small RNA (ryeA, 2.0-fold) (43) and a toxic membrane polypeptide (hokA, 1.5-fold) (29).
Biofilm fitness may be controlled by Hha through the five TA systems of MG1655.
hha is induced dramatically in biofilms (31), and Hha overexpression reduces biofilm formation and increases dispersal (11). Furthermore, Hha overexpression induces genes encoding the antitoxins YefM (7.0-fold), DinJ (4.0-fold), and RelB (3.0-fold), as well as toxin proteins, including YoeB (6.5-fold), YafQ (1.9-fold), and RelE (2.6-fold) (these three were deleted in Δ5) (11). Therefore, we reasoned that Hha may require the TA systems of Δ5 to reduce biofilms, so we assayed biofilm formation upon overexpressing Hha in MG1655 versus Δ5 using pCA24N-hha. As expected, biofilm formation was decreased due to Hha overexpression in the wild-type strain at 8 and 24 h [(9.0 ± 0.0)-fold and (3.1 ± 0.1)- fold, respectively; Fig. 6A], whereas removing the five TA systems abolished the ability of Hha to reduce biofilm formation and increased biofilm formation (Fig. 6A). Hence our results show that the ability of Hha to reduce biofilm formation is dependent on the activity of some of these five TA systems.
FIG. 6.

(A) Normalized biofilm formation (total biofilm/growth) upon induction of Hha in MG1655 and Δ5 via 1 mM IPTG for 8 h and 24 h in LB at 37°C using plasmid pCA24N-hha. (B) Normalized biofilm formation (total biofilm/growth) upon deleting toxin genes mazF, relE, chpB, yoeB, and yafQ after 8 h in LB at 37°C with BW25113. (C) Normalized biofilm formation (total biofilm/growth) upon overexpressing toxin genes mazF, relE, chpB, yoeB, yafQ after 8 h in LB at 37°C with 1 mM IPTG with BW25113. The data are the average of 10 replicate wells from two independent cultures, and one standard deviation is shown.
Single toxin deletions influence biofilm formation.
To elucidate the impact on biofilm formation of the deletion of each of the five toxins, biofilm formation was assayed with the mazF, relE, chpB, yoeB, and yafQ mutants, as well as with plasmids overexpressing these toxin genes. Unexpectedly, deletion of each of the five single toxin genes increased biofilm formation at 8 h (Fig. 6B) (recall deletion of all five TA systems reduced biofilm formation at 8 h, Fig. 1A). Corroborating this result, overexpressing each toxin gene reduced biofilm formation (Fig. 6C); note that overexpression of each toxin with 1 mM IPTG partially inhibited cell growth by 50 to 70% compared to no induction, so the cells could still form biofilms. The unexpected result is probably due to deletion of the antitoxins, along with the toxins in the Δ5 strain, whereas only each toxin was deleted here since, as shown below, antitoxins also can influence biofilm formation. Clearly, these five proteic toxins individually influence biofilm formation which supports our finding that deleting the five TA systems influences biofilm formation.
Antitoxin YefM increases biofilm formation.
Since deleting the five TA systems increased biofilm formation at 24 h of incubation (Fig. 1A) and each of the five toxins repressed biofilm formation (Fig. 6C), we reasoned that overexpression of the antitoxins may increase biofilm formation. After overexpressing RelB, DinJ, and YefM with 1 mM IPTG, we found overexpression of the YefM antitoxin increased significantly the biofilm formation of MG1655 (Fig. 7A) and Δ5 (Fig. 7B) compared to each strain containing the empty pCA24N plasmid. Corroborating this result, deleting yefM repressed biofilm formation slightly at 24 h (Fig. 7A); hence, YefM clearly affects biofilm formation. Unexpectedly, overexpression of RelB and DinJ did not affect biofilm formation. Often TA systems have overlapping stop and start codons, indicating their regulation may be coupled (24); hence, it appears antitoxin YefM may be associated with biofilm development.
FIG. 7.
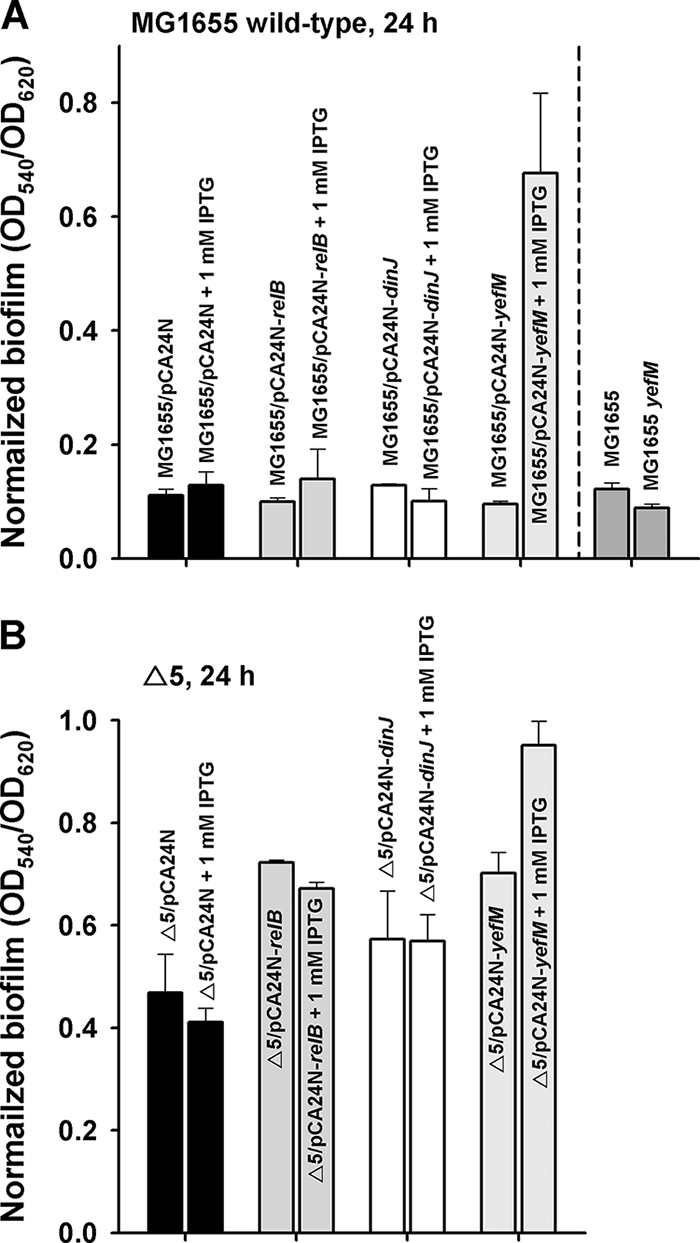
Normalized biofilm formation (total biofilm/growth) upon overexpressing antitoxin genes relB, dinJ, and yefM with 1 mM IPTG after 24 h in LB at 37°C in MG1655 (A) and in Δ5 (B). The data are the average of 10 replicate wells from two independent cultures, and one standard deviation is shown.
DISCUSSION
Although programmed cell death, i.e., any form of cell death mediated by an intracellular death program, has mainly been reported in eukaryotic cells (apoptosis), it has become important for bacteria and is regulated through their TA systems (10). The most prevalent hypothesis is that TA systems are involved in general stress response (12); however, the five TA systems of Δ5 were shown to not affect the stress response for E. coli (40). Hundreds of gene networks are differentially controlled during the biofilm development process, including stress-associated genes (4, 8, 31). However, there are few reports that chromosomal TA systems may be involved in these complex gene networks for biofilm formation. Therefore, we focused on the relationship between TA systems and biofilm formation in E. coli and found here that the deletion of five TA systems of Δ5 influences biofilm formation on three surfaces in a temporal manner (Fig. 1A). The lines of evidence that indicate the five TA systems control early biofilm formation (8 h) through their influence on fimbriae are (i) qRT-PCR shows that deleting the five TA systems represses fimA transcription at 8 h but not at 24 h; (ii) deleting five TA systems induces yjgK, as shown by a whole-transcriptome study (only expression of this gene was altered) and by qRT-PCR; (iii) YjgK represses fimA, as shown by a whole-transcriptome study (Table 3), by qRT-PCR, and by a yeast agglutination assay; (iv) deleting the five TA systems reduces attachment to sand columns similar to a fimA control; and (v) deleting fimA abolishes biofilm formation (Fig. 4). The increase in late biofilm formation by deleting the five TA systems (Fig. 1A at 24 h) appears to be related to the decrease in biofilm dispersal (Fig. 2A), as well as induction of YjgK (Fig. 2B and Fig. 5). Hence, TA systems participate in biofilm development for E. coli through fimbriae and dispersal.
Hha is a small transcriptional hemolysin repressor that affects other phenotypes including plasmid supercoiling (6) and insertion sequence transposition (26). We recently reported that a two-protein system, Hha-TomB, was involved in biofilm formation by controlling fimbria production and viability; deletion of Hha induced biofilm formation (by stimulating fimbria production), overexpressing Hha repressed biofilm formation and led to cell dispersal and lysis, and TomB reduced Hha toxicity (11). Note that Hha is a global regulator that kills cells indirectly by activating lytic prophage genes (rzpD, yfjZ, appY, and alpA); by activating proteases (Lon, ClpP, and ClpX) so that toxins are induced, including those deleted in the Δ5 strain (YoeB, YafQ, and RelE); and by affecting protein translation (11). Here we show Hha is not effective for repressing biofilm formation upon deleting the five TA systems (Fig. 6A) and that the Δ5 strain influences biofilm formation via control of fimbriae via YjgK. Therefore, Hha is clearly related to the toxins of the Δ5 strain.
An additional connection between Hha and the five TA systems of Δ5 is through the antitoxin YefM. Overexpression of YefM increased significantly biofilm formation compared to the RelB and DinJ antitoxins, whereas deleting yefM repressed biofilm formation slightly at 24 h (Fig. 7). Previously, we found that yefM was induced in E. coli biofilms (31), as well as upon deleting yliH (bssR) and yceP (bssS), which induce biofilm formation (9). Therefore, the balance of toxin and antitoxin proteins may control biofilm formation, and among these TA systems, antitoxin YefM clearly increases biofilm formation. Note, antitoxins can bind to DNA through their N-terminal domains (13); therefore, YefM may control biofilm formation as a regulator with different binding properties depending on the presence of the toxin or perhaps other partners. Note that Lon protease, which degrades some antitoxin proteins, is highly induced upon Hha overexpression (11). Furthermore, the other four TA systems of Δ5 (MazF/MazE, RelE/RelB, ChpB, and YafQ/DinJ) are not involved in Lon-dependent lethality; instead, Lon overproduction specifically activates only the YoeB-YefM TA system (7). Therefore, it is possible that Lon induction by Hha in biofilms directly inactivates YefM, and then the toxin YoeB may trigger cell death and biofilm repression. Therefore, our results suggest a strong role for YefM in biofilm formation, and this requires further study.
To investigate the specific factors controlled by TA systems, we analyzed the cell structure- and cell signaling-associated properties in the present study. No significant differences except for repression of fimA at 8 h biofilms and repression of attachment to sand columns (Fig. 3) were observed by the deletion of five TA systems, indicating that other cell structures and cell signaling are probably not involved in the phenotypes regulated by the TA systems. This was also reflected in the remarkable lack of differential gene expression upon deleting the 5 TA systems, and these results agree with the lack of changes related to bacterial fitness and competitiveness seen previously for the Δ5 strain (40); note that both groups found no difference in cell growth. Clearly, regulation of type 1 fimbriae is sufficient to control biofilm formation in that deletion of fimA abolishes biofilm formation in this strain (Fig. 4). However, we cannot rule out the possibility that posttranscriptional control mechanisms may also be involved, and these mechanisms would have been missed by our whole-transcriptome study; for example, these processes are known to be important for poly-β-1,6-N-acetyl-d-glucosamine (45).
Our whole-transcriptome study of Δ5 versus its wild-type strain did show that the single gene yjgK was induced upon deleting the 5 TA systems. YjgK (150 amino acids) is an uncharacterized cytoplasmic protein that has not been linked previously to biofilm formation, although it has been seen in some microarray experiments. For example, we found that yjgK was significantly repressed by AI-2 (33), and yjgK is induced after exposure to H2O2 (51); hence, YjgK may be part of a stress response that is related to biofilm formation. We suggest that yjgK should be named tabA (for toxin-antitoxin biofilm protein).
YjgK is highly conserved in three different strains of E. coli and is found in six genera (E. coli K-12, Shigella flexneri, Salmonella enterica serovar Typhimurium, Yersinia pestis, Erwinia carotovora, and Vibrio vulnificus). In E. coli, YjgK, YhcH, and YiaL are three paralogs for YhcH in Haemophilus influenzae (39). Bioinformatics suggests that YjgK may be involved in the metabolism of sialic acid (39), 2,3-diketo-l-gulonate (48), and pectin (34). Our results relate YjgK to the fim cluster including fimA.
We have found, at least in part, that E. coli biofilm development is influenced by multiple TA systems. Our working model (Fig. 8) is that when the five TA systems are removed, for early biofilm formation, they induce the expression of YjgK which results in repressed fimbria production, and repressed biofilm formation. For mature biofilms, biofilm formation is increased by deleting the five TA systems due to a reduction in dispersal through YjgK (Fig. 2). Also, the global regulatory protein Hha controls biofilm formation in part by controlling expression of some of the TA systems of Δ5 (11). Our results also lend credence to the idea that programmed cell death regulated through TA systems may make sense for biofilms (25); hence, to see the importance of TA systems, studies of biofilm cells should be included.
FIG. 8.

Schematic of the mechanism for the impact of the five TA systems and biofilm formation in E. coli: early biofilm formation is increased via fimbriae and repression of YjgK, and late biofilm formation is decreased due to dispersal and repression of YjgK. Also, the ratio of toxins (T) and antitoxins (A) may influence biofilm formation. The “→” indicates induction, and “⊥” indicates repression.
Acknowledgments
This study was supported by the NIH (R01 EB003872) and the ARO (W911NF-06-1-0408).
We are grateful for the MG1655 and Δ5 strains provided by Laurence Van Melderen and for the KEIO and ASKA strains provided by the Genome Analysis Project in Japan.
Footnotes
Published ahead of print on 5 December 2008.
REFERENCES
- 1.Baba, T., T. Ara, M. Hasegawa, Y. Takai, Y. Okumura, M. Baba, K. A. Datsenko, M. Tomita, B. L. Wanner, and H. Mori. 2006. Construction of Escherichia coli K-12 in-frame, single-gene knockout mutants: the Keio collection. Mol. Syst. Biol. 20008. [DOI] [PMC free article] [PubMed] [Google Scholar]
- 2.Bassler, B. L., M. Wright, R. E. Showalter, and M. R. Silverman. 1993. Intercellular signalling in Vibrio harveyi: sequence and function of genes regulating expression of luminescence. Mol. Microbiol. 9773-786. [DOI] [PubMed] [Google Scholar]
- 3.Bayles, K. W. 2007. The biological role of death and lysis in biofilm development. Nat. Rev. Microbiol. 5721-726. [DOI] [PubMed] [Google Scholar]
- 4.Beloin, C., and J.-M. Ghigo. 2005. Finding gene-expression patterns in bacterial biofilms. Trends Microbiol. 1316-19. [DOI] [PubMed] [Google Scholar]
- 5.Braun, V., and C. Herrmann. 2007. Docking of the periplasmic FecB binding protein to the FecCD transmembrane proteins in the ferric citrate transport system of Escherichia coli. J. Bacteriol. 1896913-6918. [DOI] [PMC free article] [PubMed] [Google Scholar]
- 6.Carmona, M., C. Balsalobre, F. Muñoa, M. Mouriño, Y. Jubete, F. De la Cruz, and A. Juárez. 1993. Escherichia coli hha mutants, DNA supercoiling and expression of the haemolysin genes from the recombinant plasmid pANN202-312. Mol. Microbiol. 91011-1018. [DOI] [PubMed] [Google Scholar]
- 7.Christensen, S. K., G. Maenhaut-Michel, N. Mine, S. Gottesman, K. Gerdes, and L. Van Melderen. 2004. Overproduction of the Lon protease triggers inhibition of translation in Escherichia coli: involvement of the yefM-yoeB toxin-antitoxin system. Mol. Microbiol. 511705-1717. [DOI] [PubMed] [Google Scholar]
- 8.Domka, J., J. Lee, T. Bansal, and T. K. Wood. 2007. Temporal gene-expression in Escherichia coli K-12 biofilms. Environ. Microbiol. 9332-346. [DOI] [PubMed] [Google Scholar]
- 9.Domka, J., J. Lee, and T. K. Wood. 2006. YliH (BssR) and YceP (BssS) regulate Escherichia coli K-12 biofilm formation by influencing cell signaling. Appl. Environ. Microbiol. 722449-2459. [DOI] [PMC free article] [PubMed] [Google Scholar]
- 10.Engelberg-Kulka, H., S. Amitai, I. Kolodkin-Gal, and R. Hazan. 2006. Bacterial programmed cell death and multicellular behavior in bacteria. PLoS Genet. 2e135. [DOI] [PMC free article] [PubMed] [Google Scholar]
- 11.García-Contreras, R., X.-S. Zhang, Y. Kim, and T. K. Wood. 2008. Protein translation and cell death: the role of rare tRNAs in biofilm formation and in activating dormant phage killer genes. PLoS ONE 3e2394. [DOI] [PMC free article] [PubMed] [Google Scholar]
- 12.Gerdes, K. 2000. Toxin-antitoxin modules may regulate synthesis of macromolecules during nutritional stress. J. Bacteriol. 182561-572. [DOI] [PMC free article] [PubMed] [Google Scholar]
- 13.Gerdes, K., S. K. Christensen, and A. Løbner-Olesen. 2005. Prokaryotic toxin-antitoxin stress response loci. Nat. Rev. Microbiol. 3371-382. [DOI] [PubMed] [Google Scholar]
- 14.González Barrios, A. F., R. Zuo, Y. Hashimoto, L. Yang, W. E. Bentley, and T. K. Wood. 2006. Autoinducer 2 controls biofilm formation in Escherichia coli through a novel motility quorum-sensing regulator (MqsR, B3022). J. Bacteriol. 188305-316. [DOI] [PMC free article] [PubMed] [Google Scholar]
- 15.Jackson, D. W., K. Suzuki, L. Oakford, J. W. Simecka, M. E. Hart, and T. Romeo. 2002. Biofilm formation and dispersal under the influence of the global regulator CsrA of Escherichia coli. J. Bacteriol. 184290-301. [DOI] [PMC free article] [PubMed] [Google Scholar]
- 16.Kang, Y., T. Durfee, J. D. Glasner, Y. Qiu, D. Frisch, K. M. Winterberg, and F. R. Blattner. 2004. Systematic mutagenesis of the Escherichia coli genome. J. Bacteriol. 1864921-4930. [DOI] [PMC free article] [PubMed] [Google Scholar]
- 17.Kitagawa, M., T. Ara, M. Arifuzzaman, T. Ioka-Nakamichi, E. Inamoto, H. Toyonaga, and H. Mori. 2005. Complete set of ORF clones of Escherichia coli ASKA library (a complete set of E. coli K-12 ORF archive): unique resources for biological research. DNA Res. 12291-299. [DOI] [PubMed] [Google Scholar]
- 18.Klemm, P. 1984. The fimA gene encoding the type-1 fimbrial subunit of Escherichia coli. Eur. J. Biochem. 143395-399. [DOI] [PubMed] [Google Scholar]
- 19.Landini, P., and A. J. B. Zehnder. 2002. The global regulatory hns gene negatively affects adhesion to solid surfaces by anaerobically grown Escherichia coli by modulating expression of flagellar genes and lipopolysaccharide production. J. Bacteriol. 1841522-1529. [DOI] [PMC free article] [PubMed] [Google Scholar]
- 20.Lee, J., A. Jayaraman, and T. Wood. 2007. Indole is an inter-species biofilm signal mediated by SdiA. BMC Microbiol. 742. [DOI] [PMC free article] [PubMed] [Google Scholar]
- 21.Lee, J., X.-S. Zhang, M. Hegde, W. E. Bentley, A. Jayaraman, and T. K. Wood. 2008. Indole cell signaling occurs primarily at low temperatures in Escherichia coli. ISME J. 21007-1023. [DOI] [PubMed] [Google Scholar]
- 22.Lemos, J. A. C., J. T. A. Brown, J. Abranches, and R. A. Burne. 2005. Characteristics of Streptococcus mutans strains lacking the MazEF and RelBE toxin-antitoxin modules. FEMS Microbiol. Lett. 253251-257. [DOI] [PubMed] [Google Scholar]
- 23.Maeda, T., V. Sanchez-Torres, and T. K. Wood. 2008. Metabolic engineering to enhance bacterial hydrogen production. Microb. Biotechnol. 130-39. [DOI] [PMC free article] [PubMed] [Google Scholar]
- 24.Magnuson, R. D. 2007. Hypothetical functions of toxin-antitoxin systems. J. Bacteriol. 1896089-6092. [DOI] [PMC free article] [PubMed] [Google Scholar]
- 25.Mai-Prochnow, A., J. S. Webb, B. C. Ferrari, and S. Kjelleberg. 2006. Ecological advantages of autolysis during the development and dispersal of Pseudoalteromonas tunicata biofilms. Appl. Environ. Microbiol. 725414-5420. [DOI] [PMC free article] [PubMed] [Google Scholar]
- 26.Mikulskis, A. V., and G. R. Cornetis. 1994. A new class of proteins regulating gene expression in enterobacteria. Mol. Microbiol. 1177-86. [DOI] [PubMed] [Google Scholar]
- 27.Morgan, R., S. Kohn, S.-H. Hwang, D. J. Hassett, and K. Sauer. 2006. BdlA, a chemotaxis regulator essential for biofilm dispersion in Pseudomonas aeruginosa. J. Bacteriol. 1887335-7343. [DOI] [PMC free article] [PubMed] [Google Scholar]
- 28.Pecota, D. C., and T. K. Wood. 1996. Exclusion of T4 phage by the hok/sok killer locus from plasmid R1. J. Bacteriol. 1782044-2050. [DOI] [PMC free article] [PubMed] [Google Scholar]
- 29.Pedersen, K., and K. Gerdes. 1999. Multiple hok genes on the chromosome of Escherichia coli. Mol. Microbiol. 321090-1102. [DOI] [PubMed] [Google Scholar]
- 30.Reisner, A., J. A. Haagensen, M. A. Schembri, E. L. Zechner, and S. Molin. 2003. Development and maturation of Escherichia coli K-12 biofilms. Mol. Microbiol. 48933-946. [DOI] [PubMed] [Google Scholar]
- 31.Ren, D., L. A. Bedzyk, S. M. Thomas, R. W. Ye, and T. K. Wood. 2004. Gene expression in Escherichia coli biofilms. Appl. Microbiol. Biotechnol. 64515-524. [DOI] [PubMed] [Google Scholar]
- 32.Ren, D., L. A. Bedzyk, R. W. Ye, S. M. Thomas, and T. K. Wood. 2004. Stationary-phase quorum-sensing signals affect autoinducer-2 and gene expression in Escherichia coli. Appl. Environ. Microbiol. 702038-2043. [DOI] [PMC free article] [PubMed] [Google Scholar]
- 33.Ren, D., L. A. Bedzyk, R. W. Ye, S. M. Thomas, and T. K. Wood. 2004. Differential gene expression shows natural brominated furanones interfere with the autoinducer-2 bacterial signaling system of Escherichia coli. Biotechnol. Bioeng. 88630-642. [DOI] [PubMed] [Google Scholar]
- 34.Rodionov, D. A., M. S. Gelfand, and N. Hugouvieux-Cotte-Pattat. 2004. Comparative genomics of the KdgR regulon in Erwinia chrysanthemi 3937 and other gamma-proteobacteria. Microbiology 1503571-3590. [DOI] [PubMed] [Google Scholar]
- 35.Romeo, T. 2006. When the party is over: a signal for dispersal of Pseudomonas aeruginosa biofilms. J. Bacteriol. 1887325-7327. [DOI] [PMC free article] [PubMed] [Google Scholar]
- 36.Sambrook, J., E. F. Fritsch, and T. Maniatis. 1989. Molecular cloning: a laboratory manual, 2nd ed. Cold Spring Harbor Laboratory Press, Cold Spring Harbor, NY.
- 37.Schembri, M. A., and P. Klemm. 2001. Biofilm formation in a hydrodynamic environment by novel FimH variants and ramifications for virulence. Infect. Immun. 691322-1328. [DOI] [PMC free article] [PubMed] [Google Scholar]
- 38.Shah, D., Z. Zhang, A. Khodursky, N. Kaldalu, K. Kurg, and K. Lewis. Persisters: a distinct physiological state of Escherichia coli. BMC Microbiol. 653, 2006. [DOI] [PMC free article] [PubMed]
- 39.Teplyakov, A., G. Obmolova, J. Toedt, M. Y. Galperin, and G. L. Gilliland. 2005. Crystal structure of the bacterial YhcH protein indicates a role in sialic acid catabolism. J. Bacteriol. 1875520-5527. [DOI] [PMC free article] [PubMed] [Google Scholar]
- 40.Tsilibaris, V., G. Maenhaut-Michel, N. Mine, and L. Van Melderen. 2007. What is the benefit to Escherichia coli of having multiple toxin-antitoxin systems in its genome? J. Bacteriol. 1896101-6108. [DOI] [PMC free article] [PubMed] [Google Scholar]
- 41.Valenski, M. L., S. L. Harris, P. A. Spears, J. R. Horton, and P. E. Orndorff. 2003. The product of the fimI gene is necessary for Escherichia coli type 1 pilus biosynthesis. J. Bacteriol. 1855007-5011. [DOI] [PMC free article] [PubMed] [Google Scholar]
- 42.van Houdt, R., and C. W. Michiels. 2005. Role of bacterial cell surface structures in Escherichia coli biofilm formation. Res. Microbiol. 156626-633. [DOI] [PubMed] [Google Scholar]
- 43.Vogel, J., V. Bartels, T. H. Tang, G. Churakov, J. G. Slagter-Jäger, A. Hüttenhofer, and E. G. H. Wagner. 2003. RNomics in Escherichia coli detects new sRNA species and indicates parallel transcriptional output in bacteria. Nucleic Acids Res. 316435-6443. [DOI] [PMC free article] [PubMed] [Google Scholar]
- 44.Wang, L., Y. Hashimoto, C.-Y. Tsao, J. J. Valdes, and W. E. Bentley. 2005. Cyclic AMP (cAMP) and cAMP receptor protein influence both synthesis and uptake of extracellular autoinducer 2 in Escherichia coli. J. Bacteriol. 1872066-2076. [DOI] [PMC free article] [PubMed] [Google Scholar]
- 45.Wang, X., A. K. Dubey, K. Suzuki, C. S. Baker, P. Babitzke, and T. Romeo. 2005. CsrA posttranscriptionally represses pgaABCD, responsible for synthesis of a biofilm polysaccharide adhesin of Escherichia coli. Mol. Microbiol. 561648-1663. [DOI] [PubMed] [Google Scholar]
- 46.Webb, J. S., L. S. Thompson, S. James, T. Charlton, T. Tolker-Nielsen, B. Koch, M. Givskov, and S. Kjelleberg. 2003. Cell death in Pseudomonas aeruginosa biofilm development. J. Bacteriol. 1854585-4592. [DOI] [PMC free article] [PubMed] [Google Scholar]
- 47.Wood, T. K., and S. W. Peretti. 1991. Effect of chemically-induced, cloned-gene expression on protein synthesis in E. coli. Biotechnol. Bioeng. 38397-412. [DOI] [PubMed] [Google Scholar]
- 48.Yew, W. S., and J. A. Gerlt. 2002. Utilization of l- ascorbate by Escherichia coli K-12: assignments of functions to products of the yjf-sga and yia-sgb operons. J. Bacteriol. 184302-306. [DOI] [PMC free article] [PubMed] [Google Scholar]
- 49.Zhang, X.-S., R. García-Contreras, and T. K. Wood. 2008. Escherichia coli transcription factor YncC (McbR) regulates colanic acid and biofilm formation by repressing expression of periplasmic protein YbiM (McbA). ISME J. 2615-631. [DOI] [PubMed] [Google Scholar]
- 50.Zhang, X.-S., R. García-Contreras, and T. K. Wood. 2007. YcfR (BhsA) influences Escherichia coli biofilm formation through stress response and surface hydrophobicity. J. Bacteriol. 1893051-3062. [DOI] [PMC free article] [PubMed] [Google Scholar]
- 51.Zheng, M., X. Wang, L. J. Templeton, D. R. Smulski, R. A. LaRossa, and G. Storz. 2001. DNA microarray-mediated transcriptional profiling of the Escherichia coli response to hydrogen peroxide. J. Bacteriol. 1834562-4570. [DOI] [PMC free article] [PubMed] [Google Scholar]