

Abstract
Current methods for statistical analysis of neuropsychological test data in schizophrenia are inherently insufficient for revealing valid cognitive impairment profiles. While neuropsychological tests aim to selectively sample discrete cognitive domains, test performance often requires several cognitive operations or “attributes.” Conventional statistical approaches assign each neuropsychological score of interest to a single attribute or “domain” (e.g., attention, executive, etc.), and scores are calculated for each. This can yield misleading information about underlying cognitive impairments. We report findings applying a new method for examining neuropsychological test data in schizophrenia, based on finite partially ordered sets (posets) as classification models.
A total of 220 schizophrenia outpatients were administered the Positive and Negative Symptom Scale (PANSS) and a neuropsychological test battery. Selected tests were submitted to cognitive attribute analysis a priori by two neuropsychologists. Applying Bayesian classification methods (posets), each patient was classified with respect to proficiency on the underlying attributes, based upon his or her individual test performance pattern.
Twelve cognitive “classes” are described in the sample. Resulting classification models provided detailed “diagnoses” into “attribute-based” profiles of cognitive strength/weakness, mimicking expert clinician judgment. Classification was efficient, requiring few measures to achieve accurate classification. Attributes were associated with PANSS factors in the expected manner (only the negative and cognition factors were associated with the attributes), and a double dissociation was observed in which divergent thinking was selectively associated with negative symptoms, possibly reflecting a manifestation of Kraepelin's hypothesis regarding the impact of volitional disturbances on thought.
Using posets for extracting more precise cognitive information from neuropsychological data may reveal more valid cognitive endophenotypes, while dramatically reducing the amount of testing required.
Keywords: schizophrenia, neurocognitive deficits, neuropsychological test domains, neuropsychological test data reduction, clustering techniques, Bayesian methods
Introduction
Clinical neuropsychological (NP) examinations are usually employed to determine whether a patient has neurocognitive deficits and, where present, to determine whether they selectively affect certain neurocognitive operations relative to others. The latter process involves expert interpretation of the profile of NP test scores as well as patterns of responding within particular tests. Some patterns have diagnostic significance in that they are associated with focal damage to particular brain regions, or to degenerative processes having a well-documented course/sequence of cognitive deterioration. Cognitive profiles may also have rehabilitative value, where cognitive strengths may be engaged to offset weaknesses, thereby improving the patient's functionality.
This approach is impractical for large-scale clinical studies such as those widely conducted in schizophrenia. As a result, the subdomain method, reviewed below, has been used in most large-scale studies of schizophrenia, including our own.1–8
We report on an application of statistical cognitive modeling methods that can systematically, accurately, and efficiently diagnose cognitive functioning in a manner that more closely approaches that of an expert neuropsychologist than currently available methods. The methods we will describe are based on finite partially ordered sets (posets) as classification models.9,10 Poset models can provide concise and accurate information about cognitive functioning at the level of the attributes that underlie test performance. (We define attributes as cognitive operations (e.g., vigilance, working memory, etc.), which are latent constructs, that may be present or absent. An attribute must be present for a patient to be able to perform well on a test that requires that attribute (e.g., “naming ability” is an attribute that must be present to perform well on the Boston Naming Test).) The objective of this article is to demonstrate the validity of this new statistical classification system for NP functioning using existing NP data in a sample of schizophrenia patients. This will be accomplished by applying the poset methodology to classify patients (“test subjects”) into “states” in a poset model. In our application, a state describes a group of patients. Patients in the same state share the same pattern of attribute strengths and weaknesses, that is, they have the same cognitive deficit profile. Posets are natural models for cognition since the cognitive deficit profile associated with a given state may differ from that of another state both qualitatively and also in terms of its overall severity (e.g., the number of attributes lacking). Moreover, it is also possible for one state to have higher levels of functioning, with respect to all the attributes of interest, than another. Partial orderings can represent these inherent relationships between states. In our view, the classification of cases into cognitive deficit profiles is more likely than previous methods to reveal valid neurocognitive treatment targets for novel interventions. We hypothesize that patients having common neurocognitive deficit profiles (sharing the same “state” in the poset model) are more similar with respect to brain pathology to one another than they are to patients in different states. Hence, a state may be a more valid endophenotype for genetic studies than a single test score (e.g., the Wisconsin Card Sorting Test), which may be impaired to the same degree in two different patients but for very different reasons (described further below).
The Subdomain Method for Identifying Cognitive Operations in NP Testing
The prevalent method for studying cognitive domain specificity in large-scale studies of schizophrenia is to create subscale scores by summing standard scores of tests judged a priori to belong to a particular subdomain.1,2,6,11,12 In a previous review of this literature, we addressed some of the problems attending this work, including disagreements between studies about which domains were identified and their constituent measures.8 Although there has been a proliferation of published studies of NP test performance in mental illness, especially schizophrenia, the attempts to discern replicable cognitive profiles within aggregate data using existing statistical and psychometric methods (mainly factor analysis) remain at best marginally successful, with a “generalized” deficit overwhelming more subtle patterns.2,13
This is largely owing to the fact that individual NP tests are almost unavoidably polyfactorial.14–16 Except in rare instances, no single test can be used to measure a single cognitive operation. For example, a verbal list-learning task involves not only memory (subsuming encoding and retrieval), but also (among other things) the ability to attend to the words as they are presented. Nevertheless, in an NP study, the number of words remembered would typically be treated as an index of verbal memory ability for all subjects in a sample, including those in whom there was an impairment of sustained attention. In large sample analysis, this could result in a finding of impairment in both attention and memory when in fact it is possible that the latter is the spurious consequence of attentional demands inherent in list-learning tasks.2,5,17 In clinical practice, a trained neuropsychologist distinguishes whether a true verbal memory impairment exists in such a case by considering performance on other tests and in some cases also performance patterns within the list-learning test itself.
The statistical approach in NP studies of deeming a test score to be an index of a single cognitive attribute produces inaccuracies in data interpretation. When scores are aggregated into cognitive subdomains, this problem becomes exacerbated. This problem applies equally to subdomain methods that use sums of standard scores from measures within a priori domains8 as those using factor analysis.18 This problem has been recognized by others who have employed covariance,16 subtyping according to threshold cutoffs,19,20 cluster analyses narrowly focusing on one domain,21 or experimental control paradigms22 in the attempt to reveal fundamental deficit profiles in schizophrenia. Unfortunately, cluster analyses of schizophrenia subjects based on comprehensive neuropsychological test batteries have not done much better, with the most replicable clusters being a “near normal” group and a “dementia” group.23 Clusters are in general difficult to replicate, as changes in the clustering algorithm and/or data can alter the clusters that emerge. Moreover, the interpretation of the common cognitive functionality within a cluster may not always be straightforward.
Partially Ordered Models of Cognition
As an alternative, we employ a more refined statistical method based on partially ordered models of cognition that can explicitly recognize the polyfactorial nature of widely used NP measures. Posets are comprised of states, into which cases are classified, that are associated with distinct patterns of attribute strengths and weaknesses. In general, a first state is said to be of higher order than a second state if and only if the associated attributes in which there is proficiency for the second state are included in the analogous associated attributes for the first state. Figure 1 illustrates a simple poset simulating possible “states” of cases on the basis of their level of competency on two attributes, denoted by A and B (for example, representing cognitive flexibility and divergent thinking).
Fig. 1.

Sample Poset Model.
Note: “A” and “B” denote cognitive attributes (say, divergent thinking capacity and working memory). States 1 through 4 are partially ordered (see text).
Note the “partially ordered” quality of the collection of possible states, as for this illustration 1 has the “highest” functionality, 4 has the “least,” yet states 2 and 3 are ordered only relative to states 1 and 4, but not to each other. Posets thus represent a richer and more flexible class of models than linearly ordered models,24 which assume that states are all relatively ordered with respect to each other.
Test scores from measures are used to classify a test subject to one of the states in a poset model. For the example in Figure 1, suppose that a measure requires both attributes A and B in order to perform well. Strong observed performance on such a measure would indicate that the test subject has proficiency in both A and B. On the other hand, if observed performance is poor, then it is still unclear whether the test subject is lacking in proficiency with A alone, B alone, or both A and B. Further testing is required to distinguish between these latter possibilities in the poset methodology. In the subscale approach, however, poor performance would directly affect any associated scale scores. For instance, suppose that the measure is associated with a subscale relating to attribute B. It is possible that the test subject has full proficiency with attribute B but is lacking attribute A, yet the subscale score associated with attribute B will be adversely affected. Hence, the subscale approach can give quite misleading results.
In order to relate test score information to cognitive states, each NP measure must first be associated with its underlying cognitive attributes. This “expert” analysis of the cognitive attributes associated with individual NP test measures, critical in expert interpretation of neuropsychological test profiles, is the first step in poset modeling. States in a poset are comprised of attribute profiles, so the step of identifying and associating attributes to measures is what determines the structure of the poset. This approach to determining the latent cognitive states relies on expert opinion and background information, and thus enhances the possibility that the underlying model will accurately describe NP functioning. Generally, test measures are associated with several attributes that can affect performance. In this manner, the polyfactorial nature of measures can be explicitly recognized within the poset methodology. For example, the Wisconsin Card Sorting test (WCST) perseverative errors score might be identified as requiring, for intact performance, the attributes of attention/vigilance, high levels of working memory, divergent thinking capacity, and cognitive flexibility, while Trails B might be identified as requiring attention/vigilance, a modest working memory capacity, cognitive flexibility, and the additional attribute of motor dexterity.
Background
This work was first applied in educational testing,10,25,26 where there is interest in identifying attributes or skills that are mastered or not mastered by a student (e.g., whether a seventh grader can find “a common denominator” in subtraction of fraction problems) to provide more insightful testing information than just the reporting of a score, which reflects only the number of correct responses. It was hypothesized that the same benefits can be obtained in the realm of NP assessment, since it has both conceptual and statistical similarities to educational testing. For example, in both settings, partially ordered models are natural representations of the various states of cognition associated with a cognitive domain. Nonetheless, NP assessment poses statistical problems not necessarily shared with educational assessment (e.g., a range of possible responses to NP measures, whereas in educational testing, items are generally “correct” or “incorrect”).
METHOD
Statistical Framework
Classification of each test subject to a state is conducted based on his or her scores on NP test measures through the use of Bayesian methods. (See the procedures section below for a step-by-step description.) The collection of states into which subjects are classified is assumed to be partially ordered. For each measure, it will be assumed that there are two test score probability distributions for observing a score on the measure. One distribution will be associated with subjects in states that have proficiency on the attributes associated with the measure. The other distribution will represent the test score distribution for test subjects in states that do not have proficiency on all the associated attributes. (This is illustrated in paragraph 2 of the results section below, using data from our test sample.)
For each subject, prior probabilities are assigned for state membership. For each state in the poset model, a probability is assigned to represent the prior belief that the test subject belongs to that state. Taking into account observed NP test scores for the test subject, the posterior probabilities of state membership are then calculated using Bayes's rule.
The posterior probability that a given subject is in a given state after observations of measures represents a combination of the prior information as reflected by the prior probability, and the empirical information provided by the observations of the measures. As the number of observations of measures increases, the contribution of the prior probability value lessens, and the observed test scores become predominant in determining posterior probability values. Where there is certainty that a subject belongs to a given state, the calculated posterior probability for that state would be one, while the posterior probability corresponding to the other states within the poset would be zero. Hence, a large posterior probability value for one state indicates that a classification is decisive.
A hallmark of Bayesian analysis is the specification of probabilities to represent the uncertainty in inference. Note that the prior probabilities of state membership are assigned for each test subject. For the present study, a uniform, non-informative prior probability was assigned, so that each state was viewed as being equally likely to be the true one prior to updating the probabilities of state membership after test scores were observed. While not done in the present study, an advantage of the Bayesian approach is that pertinent background information or expert opinion can be incorporated into a test subject's state membership prior probability specifications, if it is believed a priori that certain states are more likely to be the true cognitive state than others.
An important statistical property of these poset models is that they are very efficient in terms of the amount of measures needed to make accurate classifications.9 Note below that only seven measures are used in the present analysis, a significant reduction from what a clinical neuropsychologist would use to test the functionality of each of the attributes under study here.
Participants
NP test data from 220 outpatients with schizophrenia (N = 135) or schizoaffective disorder (N = 85) were included in this study. Participants were tested within six months after hospital discharge. The study was approved by the North Shore Long Island Jewish Health System Human Subjects Review Board, and all study participants provided written informed consent after having been judged competent to do so. The sample was composed of 83 females (38%) and 137 males (62%); the mean age was 36.3 years (SD = 8.9), the mean duration of illness was 16.9 years (SD = 9.3), and the average FSIQ was 83.3 (SD = 10.95). The mean education was 12.04 years (SD = 2.34, range 3–18) with 63 (28.6%) not completing a high school degree, 127 (57.8%) completing high school or a GED, and 30 (13.6%) completing a college degree (AA, BA/S, MA/S). Sample ethnicity was 84 (38%) Caucasian, 96 (43%) African American, 25 (11.4%) Hispanic, 8 (3.6%) Asian, and 7 (3.2%) Pacific Islander.
Procedure
1. Identifying Attributes and Assigning Tests to Attributes
The Positive and Negative Symptoms Scale (PANSS)27 and a comprehensive battery of NP tests were conducted.8 Only a small subset of the available NP measures was required for classification according to the attributes being studied. Tests are selected by neuropsychology experts (JJ, SMB) based on their cognitive content, with input (from CT) on their statistical properties. Attribute content was specified, also by neuropsychology experts (JJ, SMB) for each measure selected, along with associated proficiency levels. Table 1 lists the measures used and the assignment of attributes to each measure.
Table 1.
A priori Assignment of Attributes to NP Test Measures
| Attribute |
||||||
| Attention/ Sustained Vigilance | Working Memory (Medium) | Working Memory (High) | Divergent Thinking | Cognitive Flexibility | Psycho-motor Speed | |
| D2 | √ | |||||
| LNS | √ | √ | √ | |||
| COWAT | √ | √ | √ | |||
| WCST | √ | √ | √ | √ | √ | |
| Trails A | √ | √ | ||||
| Finger Tapping | √ | √ | ||||
| Trails B | √ | √ | √ | √ | √ | |
√ = proficient
LNS = Letter Number Span Test (Gold et al. 1997)39
COWAT = Controlled Oral Word Association Test (Benton and Hamsher 1978)40
WCST = Wisconsin Card Sorting Test (Heaton 1981)41 perseverative error score (Grant and Berg 1995)42
Trails A, B = Trailmaking Test (Reitan 1969)43 time to completion for forms A and B, respectively
Finger Tapping Test = Finger Tapping Test Preferred Hand (Reitan and Davidson 1974)44
The attribute analysis process involves identifying, for each NP measure of interest, the (most important) underlying cognitive attributes that determine performance. In our case, two levels of proficiency per attribute are used for four of the five attributes. Subjects are considered to have either “proficiency” or “no proficiency” for these attributes (i.e., “high” performance level or “low” performance level). For working memory, we identified three levels of proficiency: no proficiency, medium working memory, and high working memory. Note that if a measure requires high working memory, then it necessarily requires medium working memory.
2. Identification of States (Collections of Attributes) on the Basis of Shared Response Patterns
A poset model is generated based on the attribute specifications given to the measures.10 The poset that resulted from this procedure in the present set of NP measures is illustrated in Figure 2.
Fig. 2.

Graphic Representation of Poset Result.
Twelve states resulted, representing the cognitive states that are identifiable (statistically distinguishable) from the battery of seven NP measures. Each state is associated with information about the pattern of functioning on the attributes that were selected. The states within the poset provide information about proficiency levels associated with the attributes (e.g., high vs. low functioning on attention/vigilance, divergent thinking, etc.). Note that the resultant poset is a reduction from the poset containing all 26 possible patterns of functioning of the six attributes. The present set of NP measures cannot distinguish all these patterns. Table 2 lists for each state the attributes for which it is clear that a test subject belonging to that state will have proficiency. Conservatively, in terms of our clinical analysis below, it will otherwise be assumed that the test subject does not have proficiency.
Table 2.
Poset Results Attribute Combinations Associated with Each of 12 Resulting States and Number of Subjects (Ss) Classified to Each
| Attribute |
|||||||
| State | N subjects classified into each state | 1. Attention/ Sustained Vigilance | 2. Working Memory (medium) | 3. Working Memory (High) | 4. Divergent Thinking | 5. Cognitive Flexibility | 6. Psycho-motor Speed |
| 1 | 38 | √ | √ | √ | √ | √ | √ |
| 2 | 13 | √ | √ | √ | √ | √ | |
| 3 | 13 | √ | √ | √ | √ | √ | |
| 4 | 10 | √ | √ | √ | √ | √ | |
| 5 | 8 | √ | √ | √ | √ | ||
| 6 | 10 | √ | √ | √ | √ | ||
| 7 | 10 | √ | √ | √ | |||
| 8 | 25 | √ | √ | √ | √ | ||
| 9 | 19 | √ | √ | ||||
| 10 | 14 | √ | √ | √ | |||
| 11 | 22 | √ | |||||
| 12 | 38 | ||||||
√ = proficient
Note: The poset consists of a collection of cognitive states that are associated with combinations of attributes. The twelve cognitive states that emerged in our sample are shown, along with the number of subjects classified into each.
3. Prior Assumptions and Examination of Actual Score Distributions
It was assumed that there are two different class conditional test score distributions per measure across the states in a poset. (A class conditional test score distribution refers to the distribution of test scores for subjects in an associated state (or class).) One will be associated with the states that have functional ability with respect to associated cognitive attributes to perform well on the measure, and another for states without functionality in all attributes associated with the measure. By way of illustration for the WCST, the states in Table 2 with the attribute functionality to perform well are states 1 and 2, which require functionality on sustained vigilance, a high level of working memory, capacity for divergent thinking, and cognitive flexibility. The remaining states (3 through 12) without the functionality of all attributes associated with the WCST have a different test score distribution.
The range of possible scores for each NP measure was partitioned into intervals. Depending upon the NP variable, either three or four intervals were selected, based on quartile values from the entire sample. If there were only three intervals in a partition (for WCST and Grooved Pegboard), then the first interval represents the range of values from the minimum value to the first quartile, while the third interval represents the range of values from the third quartile to the maximum value. Based on a training sample, the NP test score distributions were estimated.10 Actual score distributions were studied in several ways. A main statistical property of interest involves the discriminatory capabilities of each test (as can be measured for instance by Kullback-Leibler information values between estimated class conditional test score distributions for the test). The statistical analysis of tests follows.10
The underlying classification model is latent, which presents difficulty in estimation of the class conditional test score distributions, since the class membership of each subject is not known precisely. To alleviate this difficulty, only two class conditional test score distributions are estimated per measure. States in the model are partitioned into two groups: those with the requisite functionality and those without. The determination of these two groups utilizes the partial ordering of states. As mentioned above, a uniform, non-informative prior probability was assigned for the present study, so that each state was viewed as being equally likely to be the true one, prior to updating the probabilities of state membership, after test scores were observed. Thus, in this application, no prior information was incorporated into the classification process for each subject. However, in general, prior information about state membership for a test subject can be incorporated into the classification process through the specification of the prior distribution.
4. Posterior Probabilities and Validation of Cognitive States
Posterior probabilities are assigned, as a result of the poset analyses, for each subject and for each possible state in the poset. Subjects can be “assigned” to one of the resultant states based upon that state having the highest posterior probability relative to all the other states for that subject. For each subject, the sum of the posterior probabilities for each of the states will be 1.0.
Several validation procedures follow. Frequency distributions are used to examine the range of observed largest posterior probabilities to provide an indication of the likely accuracy of state assignments. (The objective of the classification process is to concentrate probability on one state, so the higher this value for most cases, the more successful the classification.) In addition, the sum of the two largest posterior probabilities is examined, since this can provide evidence of functionality for the shared attributes between the two associated states and hence is of interest. A lack of concentration of probability values can be an indication of poor model fit (e.g., poorly specified attributes).
Face validity is illustrated by selecting individual subjects in individual states and examining their test performance, and then determining whether the attributes associated with the assigned state match their test score profile. For data analytic validation, individual test score distributions are examined, contrasting subjects classified by the poset into states “having” the attributes assigned to that test from subjects assigned to states “not having” these attributes. Subjects in the former collection of states should have higher scores on the test than subjects in the latter states. To examine the clinical validity of the attributes, we calculate for each subject the sum of the posterior probabilities for each state that includes each of the cognitive attributes (i.e., working memory, divergent thinking, cognitive flexibility, psychomotor speed/dexterity) and relate those values to clinical factors. In this case, we examined the factor scores on the PANSS.28 We hypothesize that these attributes will have differential relationships to these factors, in particular with respect to the negative symptom and cognition factor relative to positive symptoms, emotional discomfort, and hostility.
Results
The specific attribute combinations associated with each of these 12 states are indicated on Table 2, as well as the number of subjects classified to each of these states. States 1 and 12, describing 38 and 43 of the cases respectively in the sample, consist of those who had high or low functioning respectively on all six attributes. The remaining 139 cases were classified to one of the 10 remaining states, reflecting various other combinations of attribute strengths and weaknesses. States 2, 3, and 4 are not ordered relative to one another, since they reflect high functioning on five of the six possible attributes. Similarly, states 5, 6, and 8 reflect high functioning on four of the six possible attributes, although the particular combination of attributional strengths and weaknesses is different among these three states. Examining the combination of attribute strengths and weaknesses reveals the neurocognitive deficit profile that applies to each subject belonging to that state. In this sense, the process is similar to assigning a neurocognitive diagnosis to each subject.
Referring to Table 2, it can be noted that if a subject is classified in any of states 1 through 7, it can be inferred that he or she has demonstrated competency in the first three attributes listed, while those classified in states 8 through 12 lack at least one of them. These three attributes indicate high levels of competency in attention/sustained vigilance, and both medium and high levels of working memory. Note from Table 1 that the Letter Number Span (LNS) test is the only measure of a collection we examined that was judged to require all three attributes. One would expect therefore that subjects classified into states 1 through 7 would have a higher probability of having performed well on this test than subjects classified into states 8 through 12. Table 3 summarizes the proportion of cases performing at the first through the fourth quartiles on LNS as a function of whether they were classified into states 1 through 7 vs. 8 through 12. Ninety percent of the subjects classified into states 8 through 12 performed below the median on this test, while 69 percent of those classified into states 1 through 7 performed above the median. These distributions respectively describe the probabilities of a test subject performing in the specified score ranges with or without proficiency on all the attributes associated with LNS.
Table 3.
Estimated Probabilities for Subjects (Ss) Performing at the First through Fourth Quartiles on the Letter Number Span Test as a Function of Whether They Were Classified into States 1 through 7 (Having Proficiency in Attention/Sustained Vigilance [Att/SV], Working Memory Medium [WM1], and Working Memory High [WM2]) versus States 8 through 12 (NOT Having Proficiency on These Three Attributes)
| LNS [0,8) | LNS [8,11) | LNS [11,13) | LNS [13,25 | |
| Ss HAVING proficiency with Att/SV, WM1, WM2 | 0.08 | 0.23 | 0.27 | 0.42 |
| Ss NOTHAVING proficiency with Att/SV, WM1, WM2 | 0.58 | 0.33 | 0.06 | 0.04 |
Note: LNS score ranges are denoted using set notation in which [0,8) refers to the range of scores from 0, inclusive but not including 8.
The poset methodology results in calculation of a posterior probability for each state for each case. Subjects are classified into a state on the basis of its being the one having the largest posterior probability. Figure 3 reflects a frequency distribution for the largest posterior probability observed for each case, while Figure 4 reflects the distribution when the sum of the two largest posterior probabilities for each case is plotted. Note that the posterior probabilities of state membership for the test subjects are in many cases aggregated on two states.
Fig. 3.

Frequency Distribution Displaying the Largest Posterior Probability Observed for Any of the 12 States.
Fig. 4.

Frequency Distribution Displaying the Sum of the Two Largest Posterior Probability Values Observed among the 12 States.
Table 4 illustrates, with a single subject, the utility of examining the two highest probability states where the highest possible classification accuracy is desirable, and it also illustrates how posets can mimic a neuropsychologist's expert judgment through classification.
Table 4.
Illustration with a Single Subject Showing How Posets Can Mimic a Neuropsychologist's Expert Judgment through Classification
| NP Test | Raw Score | Quartile (first = upper) |
| D2 | 402 | First |
| LNS | 13 | Second |
| WCST | 44 | Bottom (tercile) |
| Trails A | 25 | First |
| Trails B | 76 | First |
| Finger Tapping | 54 | First (tercile) |
| COWAT | 30 | Third |
| Attribute |
||||||
| State | 1. Attention | 2. Working Memory (medium) | 3. Working Memory (High) | 4. Divergent Thinking | 5. Cognitive Flexibility | 6. Psycho-motor Speed |
| 3 | √ | √ | √ | √ | √ | |
| 5 | √ | √ | √ | √ | ||
Note: This subject's posterior probability for classification into state 3 was 0.67, while for state 5 it was 0.10. (Attributes associated with these two states are illustrated below.)
This subject performed very poorly on WCST, a highly polyfactorial test that is widely held to measure working memory as well as cognitive flexibility. Divergent thinking is also involved, since the ability to “think of” alternative sorting categories is essential. This subject performed in the third quartile on the COWAT, a measure generally thought to measure divergent thinking. Working memory impairment is considered very unlikely, however, since LNS was performed at the second quartile. All other measures (D2, Trails A and B, and Finger Tapping) were performed relatively well. Thus, a neuropsychologist might conclude confidently, based on available test data, that this subject's profile is associated with a relative impairment in divergent thinking (common to the WCST and COWAT, which had the worst performance). Since the WCST also involves cognitive flexibility (switching response categories), there is some possibility that cognitive flexibility may be involved. However this would be inconsistent with the patient's good Trails B performance. On the other hand, psychomotor speed was performed so consistently well (D2, Finger Tapping), including on a test with similarities to Trails B (Trails A), that it remains possible that cognitive flexibility is somewhat impaired, but that the patient's excellent psychomotor speed “made up for” difficulties that arose in cognitive flexibility on Trails B. Turning to the poset classification of this subject, classification into state 3 was achieved with a posterior probability of 0.67. State 3 reflects the profile in which five of the six attributes are performed well, with only divergent thinking selectively impaired. Classification into state 5, the second-highest posterior probability for this subject, was 0.10. State 5 consists of cases performing poorly on both divergent thinking and cognitive flexibility. Summing these two posterior probabilities, we conclude that there is a 77 percent chance that this subject is in either state 3 or state 5. Both of these states are associated with impairments in divergent thinking. Thus, the poset classification is consistent with the likely conclusion of an expert neuropsychologist examining this subject's test performance profile.
Conventional methods for analyzing these data would most likely register a low to medium aggregate score on an “executive functioning” subdomain for this case, on the basis of poor performance on WCST and COWAT, which would be averaged with contrasting medium to high scores on LNS and Trails B, respectively. The specificity of the cognitive impairment to divergent thinking and possibly also to cognitive flexibility with intact working memory even at high difficulty levels could not be discerned using conventional methods of analysis.
Data-Analytic Validation
Data-analytic validation of model fit and of the specification of the class conditional NP test score distributions is essential to providing reliable and accurate results, since the cognitive processes underlying the assessment responses are latent and complex. The data-analytic tools we used involve analyzing test score distribution parameter estimates and patterns in the classification results.10 For instance, respective test score distribution estimates for a test measure that do not have clearly distinguished probability values (e.g., for those “having” vs. those “not having” proficiency on an attribute required for that test) indicate that attributes may be incorrectly associated with the test, or alternatively, that the underlying cognitive model may not be incorporating all of the clinically important cognitive states.
Consider the test score distribution estimates in Figure 5. This figure displays, for each of the seven NP measures, the means and standard deviations of the probability estimates. Test performance distributions are divided into terciles (for WCST and Finger Tapping) or quartiles (for the remaining variables).
Fig. 5.

Response Probability Estimates for Each of the Seven NP Measures.
Note: The two groups plotted reflect estimated probabilities for all test subjects classified into states associated with the presence of the attributes necessary for performance on that test (open triangles), or test subjects classified into states associated with the absence of those attributes (closed circles). Values on the x-axis reflect the raw score range in each quartile or tercile using set notation. TMA = Trailmaking test A, TMB = Trailmaking test B. See caption of Table 1 for remainder of test abbreviations. With the exception of TMA Time, TMB Time, and WCST, a high value denotes good performance and a low value denotes poor performance.
The two sets of probabilities plotted in Figure 5 represent the respective estimated response probabilities of subjects in states associated with the presence (closed circles) or absence (open triangles) of the attributes necessary for performance on that test. Note that the estimates of probabilities for an observation belonging to certain intervals in most instances reflect the order structure of the cognitive model,10 and that respective probabilities are distinguished between the response distributions for the tests. In other words, subjects in a state associated with the presence of attributes necessary for performance on an NP test will have higher probabilities of performing well than subjects in states not associated with the presence of all the attributes associated with the NP test. Stated conversely, a subject without functionality on the attribute(s) required for a given NP test has a relatively higher probability of performing poorly. This corroborates the underlying order structure of the model and indicates that the attributes that were associated a priori with the NP measures do indeed play a role in performance. Terciles were used for WCST and Finger Tapping instead of quartiles, as the use of terciles corroborated the order structure in the above manner, while using quartiles in the interval ranges did not in the middle ranges. This could be in part due to the need for more data in estimation. Moreover, small standard deviations (ranging from 0.0017 to 0.0302) among the test score probability estimates among 10 cross-validation replications (stratified by gender and education level) support the stability and replicability of the estimation process and hence the classifications as well. In conjunction with the fairly decisive classifications, these results give strong indication that the poset approach can successfully model the cognitive processes underlying NP assessment in schizophrenia.
Clinical Validity of the Attributes
The clinical significance of these and future poset results will be more fully explored in subsequent research. However, as a first step, dimensions of psychopathology, as measured by previously validated factors from the PANSS,28 were studied in relation to the attributes studied here. For each patient, posterior probability values were summed for groups of states that “have” each of the four attributes of interest. For Working Memory, we included only states that required High Working Memory. Subjects were grouped into low (< 0.3), medium [0.3, 0.7], and high (> 0.7) posterior probability groupings for each attribute, and the non-parametric Kruskal Wallis test was used to relate these groupings to PANSS factor score (see Table 5).
Table 5.
Kruskal Wallis Results Relating Attributes (Cases Grouped into 3 Groups of Posterior Probability Levels for Total of All States Requiring That Attribute, Low = (<0.3), Med = [0.3, 0.7], High = (>0.7) to PANSS Factors (Bell et al., 1994)28
| PANSS Factor |
|||||
| Attribute | PANSS Negative | PANSS Cognitive | PANSS Positive Sx | PANSS Emotional | PANSS Hostility |
| Working Memory | Chi-Sq = 10.9 p = .004 | Chi-sq = 9.67 p = .008 | ns | ns | ns |
| Divergent Thinking | Chi-sq = 9.56 p = .008 | ns | ns | ns | ns |
| Cognitive Flexibility | ns | Chi-sq = 14.23 p = .001 | ns | ns | ns |
| Motor Dexterity | ns | ns | ns | ns | ns |
Results were as expected in the sense that the negative symptom and cognitive factors were the only ones among the five factors that approached significance with the working memory attribute associated with both of these PANSS factors. (Note that, since our purpose was to explore trends, the table shows p values meeting an alpha of 0.01; however, after multiplicity correction looking at all five PANSS factors, alpha should be set at the more conservative 0.0025.) In addition, a potentially important double dissociation may have been revealed: The divergent thinking attribute is associated with negative symptoms but not cognitive flexibility. Further, the flexibility attribute is uniquely associated with the cognitive factor.
Discussion and Conclusions
The results of this first application of posets to the problem of discerning neurocognitive profiles from polyfactorial neuropsychological tests are promising. Posets offer an alternative to existing data-analytic approaches for NP test data in studies of cognitively impaired populations, where it is important to discern patterns of cognitive strength and deficit. Approaches based on principal components analysis, cluster analysis, and the more prevalent approach of summing scaled scores within a priori subdomains cannot reveal valid measures of discrete cognitive operations where the tests themselves are polyfactorial.
A frequent question asked regarding the prior assignment of attributes relates to concerns that these could be “subjective,” in that different experts might apply different taxonomies of cognitive functions. Indeed, the methodology is dependent on the specification of attributes, and the results could differ between experts. The data-analytic framework10 is used to validate model fit, i.e., the attribute specification. Criteria, which were applied here, include classification performance (higher largest posterior probability values for subjects indicate good performance), and strong discrimination properties of tests indicate that they are indeed differentiating valid cognitive subgroups. Such criteria can help in determining how to resolve discrepancies between expert opinions.
The cognitive attributes successfully distinguished here cannot be discerned within clinical neuropsychological test batteries in large data sets using conventional data reduction methods. Our preliminary examination of the clinical validity of these attributes using PANSS factor scores revealed an exciting and potentially important distinction. Specifically, the results suggest a double dissociation in which the capacity for divergent thinking, that is, coming up with alternative ideas or strategies when called for, may be distinctly associated with negative symptoms, while this attribute does not contribute to the PANSS cognitive factor. On the other hand, the cognitive factor (and not negative symptoms) is significantly associated with cognitive flexibility. A hallmark symptom of the negative “syndrome” is avolition. However, disturbances of volition are classically examined only with respect to behavior and movement. Yet disturbances in the volitional control of thought were essential features in Kraepelin's original formulation of the cognitive disturbances of dementia praecox. To the degree that capacity for divergent thinking may reflect willed initiation of a thought or thought process, this attribute may reflect an essential element of the cognitive disturbances originally discerned by Kraepelin.
An important goal of experimental psychology and cognitive science has been to develop tests and methods that decompose the elemental units of cognition.29–34 Perhaps in the future, such an approach will successfully reveal one or more neurocognitive endophenotypes critical for targeting new treatments or distinguishing biological subgroups.35 While great strides are being made, a comprehensive battery of such discrete cognitive probes remains elusive, leading those directing the NIMH MATRICS initiative36 to adopt a traditional “paper and pencil” battery such as those that have been studied in thousands of schizophrenia sufferers, to define cognitive improvement. Importantly, these legacy databases can be subjected to poset analysis, offering rich opportunities to take advantage of existing datasets.
There are some limitations in the current study. The limited number of intervals used for the test score categories can hinder the decisiveness of the classification performance, because scores in mid-range intervals do not always discriminate between functionality states very efficiently. With a larger data set, finer partitions of the test score categories can be employed. An advantage in just partitioning the range of values of a measure into intervals is that parametric assumptions about response models are not made.
Experts are used in linking test measures to attributes. However, not all pertinent attributes may be recognized in any given NP measure, at least for some of the test subjects. The poset methodology requires that attributes be identified a priori. Attributes selected for this first application of posets to NP test data included conventional ones widely studied in schizophrenia: attention/sustained vigilance, working memory, set shifting/cognitive flexibility, ideational fluency (or capacity for divergent thinking), and motor dexterity. Subsequent analyses will address memory and language functions using a different set of measures in our battery. This initial work with posets addresses the most firmly established attributes and task analysis and employs NP measures likely to be found in many legacy NP databases in schizophrenia, raising the potential for fruitful retrospective analyses of existing data sets. Future applications can be directed to ongoing work in experimental cognition.
Further investigations will also be conducted to examine the stability of posets in nearly 200 subjects for whom a repeat NC battery was conducted, as well as the association between poset classes and functional outcome.
Supplementary Material
Supplementary material is available online at http://schizophreniabulletin.oxfordjournals.org.
Acknowledgments
The study was funded by NIMH R01MH 55585 (Jaeger) and NIMH R01MH 65538 (Tatsuoka). Portions of the article were previously presented at the Mount Sinai Conference on Cognition in Schizophrenia (March 29–30, 2003) and the International Congress on Schizophrenia Research in Colorado Springs, CO (March 31–April 2, 2003). We acknowledge the contribution of Dr. Ann Hohmann, of the NIMH, whose insights prompted the collaboration leading to this investigation. Thanks also to Dr. John Lachin for suggesting that partially ordered classification models could be applied in neuropsychology, and to Sarah Uzelac, Ph.D., for technical assistance. We wish to thank anonymous reviewers for their thoughtful comments and helpful suggestions.
Appendix: Details of Statistical Framework
Classification is conducted based on scores xi for each of n NP test measures (ei, i = 1…n) through the use of Bayesian methods. Define P as a partially ordered collection of states into which subjects are classified. Define f(x|e,j) as the class conditional test score density value (probability) for observing a score x on measure e from a test subject in state j, where j is in P. The class conditional test score distribution describes the distribution of test scores observed on measure e for subjects in state j. Using as an example for the measure e the total number of correct responses on the Letter Number Span Test (LNS), this formula indicates the probability that a subject in state j could have a score of x on LNS. Each state j is assigned a test score distribution for each measure ei, i = 1…n, with probability density f(xi|ei,j).
For each subject, prior probabilities are assigned for state membership, π0(j), for each j in P, where j refers to one of the states in a poset P. Taking into account n observed NP test scores, the posterior probability of state membership in j, πn(j), is then calculated using Bayes's rule:
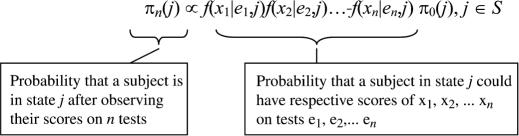 |
The posterior probability πn(j) that a given subject is in a given state j after n observations is proportional to the product of the probabilities (class conditional test score density function values associated with state j) for each of his or her respective observed test scores (xi,i = 1…n). This product is multiplied by the prior probability π0(j). As n increases, the contribution of the prior probability value lessens, and the probabilities (density values) corresponding to the observed test scores become predominant in determining posterior probability values. Where there is certainty that a subject belongs to a given state j, the calculated posterior probability, πn(j), for that state would be one, while the posterior probability corresponding to the other states within the poset P would be zero.
An important statistical property of these poset models is that when s is the “true” state, there is an exponential rate of convergence of πn(s) to 1 as n increases.9 The small number of measures needed in the present analysis to obtain useful classification information is an illustration of the efficiency of this classification process and a significant reduction from what a clinical neuropsychologist would use to test the functionality of each of the attributes under study here.
Note with respect to the assumption of the (conditional) independence of test measures: Conditional independence in this context refers to absence, in individual test scores, of variance explained by performance on the previous test (e.g., analogous to the independence of each in a series of coin flips from all the other coin flips). Neuropsychologists understand such risks, for example, as they can arise from test order effects. For example, memory tests are believed to be more vulnerable to test session fatigue and are typically administered first in clinical settings, relative to simple motor speed or dexterity measures. In this study, test order was standardized, and testers were carefully instructed (and routinely reminded) to take rest or food breaks at any point that they felt the patient's best performance could not be achieved on the next test, whether owing to fatigue, hunger, or any other factor.
References
- 1.Saykin AJ, Gur RC, Gur RE, Mozley D, Mozley L, Resnick SM, Kester B, Stafiniak P. Neuropsychological function in schizophrenia: selective impairment in memory and learning. Arch Gen Psychiatry. 1991;48:618–624. doi: 10.1001/archpsyc.1991.01810310036007. [DOI] [PubMed] [Google Scholar]
- 2.Bilder RM, Goldman RS, Robinson D, Reiter G, Bell L, Bates JA, Pappadopulos E, Willson DF, et al. Neuropsychology of first-episode schizophrenia: initial characterization and clinical correlates. Am J Psychiatry. 2000;157:549–559. doi: 10.1176/appi.ajp.157.4.549. [DOI] [PubMed] [Google Scholar]
- 3.White L, Harvey PD, Opler L, Lindenmayer JP. Empirical assessment of the factorial structure of clinical symptoms in schizophrenia. A multisite, multimodel evaluation of the factorial structure of the Positive and Negative Syndrome Scale. The PANSS Study Group. Psychopathology. 1997;30:263–274. doi: 10.1159/000285058. [DOI] [PubMed] [Google Scholar]
- 4.Hoff AL, Kremen WS, Wieneke MH, Lauriello J, Blankfeld HM, Faustman WO, Csernansky JG, Nordahl TE. Association of estrogen levels with neuropsychological performance in women with schizophrenia. Am J Psychiatry. 2001;158:1134–1139. doi: 10.1176/appi.ajp.158.7.1134. [DOI] [PubMed] [Google Scholar]
- 5.Heaton RK, Gladsjo JA, Palmer BW, Kuck J, Marcotte TD, Jeste DV. Stability and course of neuropsychological deficits in schizophrenia. Arch Gen Psychiatry. 2001;58:24–32. doi: 10.1001/archpsyc.58.1.24. [DOI] [PubMed] [Google Scholar]
- 6.Blanchard JJ, Neale JM. The neuropsychological signature of schizophrenia: generalized or differential deficit? Am J Psychiatry. 1994;151:40–48. doi: 10.1176/ajp.151.1.40. [DOI] [PubMed] [Google Scholar]
- 7.Censits DM, Ragland JD, Gur RC, Gur RE. Neuropsychological evidence supporting a neurodevelopmental model of schizophrenia: a longitudinal study. Schizophr Res. 1997;24:289–298. doi: 10.1016/s0920-9964(96)00091-6. [DOI] [PMC free article] [PubMed] [Google Scholar]
- 8.Jaeger J, Czobor P, Berns S. Basic neuropsychological dimensions in schizophrenia. Schizophr Res. 2003;65:105–116. doi: 10.1016/s0920-9964(03)00052-5. [DOI] [PubMed] [Google Scholar]
- 9.Tatsuoka C, Ferguson T. Sequential classification on partially ordered sets. Journal of the Royal Statistical Society Series B. 2003;65:143–157. [Google Scholar]
- 10.Tatsuoka C. Data analytic methods for latent partially ordered classification models. Applied Statistics (Journal of the Royal Statistical Society Series C) 2002;51:337–350. [Google Scholar]
- 11.Hoff AL, Riordan H, O'Donnell DW, Morris L. Neuropsychological functioning of first-episode schizophreniform patients. Am J Psychiatry. 1992;149:898–903. doi: 10.1176/ajp.149.7.898. [DOI] [PubMed] [Google Scholar]
- 12.Meltzer HY. The effects of clozapine, risperidone, and olanzapine on cognitive function in schizophrenia. Schizophr Bull. 25:233–255. doi: 10.1093/oxfordjournals.schbul.a033376. [DOI] [PubMed] [Google Scholar]
- 13.Dickinson D, Iannone VN, Wilk CM, Gold JM. General and specific cognitive deficits in schizophrenia. Biol Psychiatry. 2004;55:826–833. doi: 10.1016/j.biopsych.2003.12.010. [DOI] [PubMed] [Google Scholar]
- 14.Baddeley A, Della SS, Papagno C, Spinner H. Dual-task performance in dysexecutive and nondysexecutive patients with a frontal lesion. Neuropsychology. 1997;11:187–194. doi: 10.1037//0894-4105.11.2.187. [DOI] [PubMed] [Google Scholar]
- 15.Lehto J. Are executive function tests dependent on working memory capacity? Q J Exp Psychol A. 1996;49:29–50. [Google Scholar]
- 16.Perry W, Heaton RK, Potterat E, Roebuck T, Minassian A, Braff DL. Working memory in schizophrenia: transient “online” storage versus executive functioning. Schizophr Bull. 2001;27:157–176. doi: 10.1093/oxfordjournals.schbul.a006854. [DOI] [PubMed] [Google Scholar]
- 17.Saykin AJ, Shtasel DL, Gur RE, Kester DB, Mozley LH, Stafiniak P, Gur RC. Neuropsychological deficits in neuroleptic naive patients with first-episode schizophrenia. Arch Gen Psychiatry. 1994;51:124–131. doi: 10.1001/archpsyc.1994.03950020048005. [DOI] [PubMed] [Google Scholar]
- 18.Nuechterlein KH, Barch DM, Gold JM, Goldberg TE, Green MF, Heaton RK. Identification of separable cognitive factors in schizophrenia. Schizophr Res. 2004;72:29–39. doi: 10.1016/j.schres.2004.09.007. [DOI] [PubMed] [Google Scholar]
- 19.Weickert TW, Goldberg TE, Gold JM, Bigelow LB, Egan MF, Weinberger DR. Cognitive impairments in patients with schizophrenia displaying preserved and compromised intellect. Arch Gen Psychiatry. 2000;57:907–913. doi: 10.1001/archpsyc.57.9.907. [DOI] [PubMed] [Google Scholar]
- 20.Kremen WS, Seidman LJ, Faraone SV, Tsuang MT. Intelligence quotient and neuropsychological profiles in patients with schizophrenia and in normal volunteers. Biol Psychiatry. 2001;50:453–462. doi: 10.1016/s0006-3223(01)01099-x. [DOI] [PubMed] [Google Scholar]
- 21.Turetsky BI, Moberg PJ, Mozley LH, Moelter ST, Agrin RN, Gur RC, Gur RE. Memory-delineated subtypes of schizophrenia: relationship to clinical, neuroanatomical, and neurophysiological measures. Neuropsychology. 2002;16:481–490. [PubMed] [Google Scholar]
- 22.Glahn DC, Cannon TD, Gur RE, Ragland JD, Gur RC. Working memory constrains abstraction in schizophrenia. Biol Psychiatry. 2000;47:34–42. doi: 10.1016/s0006-3223(99)00187-0. [DOI] [PubMed] [Google Scholar]
- 23.Seaton BE, Goldstein G, Allen DN. Sources of heterogeneity in schizophrenia: the role of neuropsychological functioning. Neuropsychol Rev. 2001;11:45–67. doi: 10.1023/a:1009013718684. [DOI] [PubMed] [Google Scholar]
- 24.Macready G, Dayton C. The application of latent class models in adaptive testing. Psychometrika. 1992;57:71–88. [Google Scholar]
- 25.Tatsuoka K. Toward an integration of item-response theory and cognitive error diagnosis, diagnostic monitoring of skill and knowledge acquisition. In: Frederiksen N, Glaser R, Lesgold A, Shafto M, editors. Diagnostic monitoring of skill and knowledge acquisition. Hillsdale, NJ: Lawrence Erlbaum; 1990. pp. 453–488. [Google Scholar]
- 26.Tatsuoka K. Architecture of knowledge structures and cognitive diagnosis: a statistical pattern classification approach, in cognitively diagnostic assessments. In: Nichols P, Chipman S, Brennan R, editors. Cognitively diagnostic assessments. Hillsdale, NJ: Lawrence Erlbaum; 1995. pp. 327–359. [Google Scholar]
- 27.Kay SR, Opler LA, Lindenmayer JP. The Positive and Negative Syndrome Scale (PANSS): rationale and standardization. Br J Psychiatry. 1989;155(suppl 7):59–65. [PubMed] [Google Scholar]
- 28.Bell MD, Lysaker PH, Beam-Goulet JL, Milstein RM, Lindenmayer JP. Five-component model of schizophrenia: assessing the factorial invariance of the positive and negative syndrome scale. Psychiatry Res. 1994;52:295–303. doi: 10.1016/0165-1781(94)90075-2. [DOI] [PubMed] [Google Scholar]
- 29.Fan J, McCandliss BD, Sommer T, Raz A, Posner MI. Testing the efficiency and independence of attentional networks. J Cogn Neurosci. 2002;14:340–347. doi: 10.1162/089892902317361886. [DOI] [PubMed] [Google Scholar]
- 30.Park S, Holzman PS, Goldman-Rakic PS. Spatial working memory deficits in the relatives of schizophrenic patients. Arch Gen Psychiatry. 1995;52:821–828. doi: 10.1001/archpsyc.1995.03950220031007. [DOI] [PubMed] [Google Scholar]
- 31.Goldberg TE, Egan MF, Gscheidle T, Coppola R, Weickert T, Kolachana BS, Goldman D, Weinberger DR. Executive subprocesses in working memory: relationship to catechol-O-methyltransferase Val158Met genotype and schizophrenia. Arch Gen Psychiatry. 2003;60:889–896. doi: 10.1001/archpsyc.60.9.889. [DOI] [PubMed] [Google Scholar]
- 32.Manoach DS, Gollub RL, Benson ES, Searl MM, Goff DC, Halpern E, Saper CB, Rauch SL. Schizophrenic subjects show aberrant fMRI activation of dorsolateral prefrontal cortex and basal ganglia during working memory performance. Biol Psychiatry. 2000;48:99–109. doi: 10.1016/s0006-3223(00)00227-4. [DOI] [PubMed] [Google Scholar]
- 33.Cohen JD, Barch DM, Carter C, Servan-Schreiber D. Context-processing deficits in schizophrenia: converging evidence from three theoretically motivated cognitive tasks. J Abnorm Psychol. 1999;108:120–133. doi: 10.1037//0021-843x.108.1.120. [DOI] [PubMed] [Google Scholar]
- 34.Baddeley A. The fractionation of working memory. Proc Natl Acad Sci U S A. 1996;93:13468–13472. doi: 10.1073/pnas.93.24.13468. [DOI] [PMC free article] [PubMed] [Google Scholar]
- 35.Goldberg TE, Weinberger DR. Genes and the parsing of cognitive processes. Trends Cogn Sci. 2004;8:325–335. doi: 10.1016/j.tics.2004.05.011. [DOI] [PubMed] [Google Scholar]
- 36.Green MF, Nuechterlein KH. The MATRICS initiative: developing a consensus cognitive battery for clinical trials. Schizophr Res. 2004;72:1–3. doi: 10.1016/j.schres.2004.09.006. [DOI] [PubMed] [Google Scholar]
- 37.Brickenkamp R. Gottingen: Verlag fur Psychologie; 1981. Concentration-Endurance Test Manual. [Google Scholar]
- 38.Brickenkamp R, Zillmer E. Kirkland, Wash: Hogrefe & Huber Publishers; 1998. d2 Test of Attention. [Google Scholar]
- 39.Gold JM, Carpenter C, Randolph C, Goldberg TE, Weinberger DR. Auditory working memory and Wisconsin Card Sorting Test performance in schizophrenia. Arch Gen Psychiatry. 1997;54:159–165. doi: 10.1001/archpsyc.1997.01830140071013. [DOI] [PubMed] [Google Scholar]
- 40.Benton A, Hamsher K. Iowa City: University of Iowa; 1978. Multiphasic Aphasia Examination Manual. [Google Scholar]
- 41.Heaton RK. Odessa, NY: Psychological Assessment Resources; 1981. The Wisconsin Card Sorting Test Manual. [Google Scholar]
- 42.Grant D, Berg E. A behavioral analysis of degree of reinforcement and ease of shifting to new responses in a Weigl-type card-sorting problem. Journal of Experimental Psychology. 1995;38:404–411. doi: 10.1037/h0059831. [DOI] [PubMed] [Google Scholar]
- 43.Reitan RM. Indianapolis, Ind: Indianapolis Neuropsychological Laboratory, Indianapolis Medical Center; 1969. Trail Making Test Manual for Administration and Scoring. [Google Scholar]
- 44.Reitan R, Davidson L. Clinical Neuropsychology: Current Status and Applications. New York: Hemisphere; 1974. [Google Scholar]