

Abstract
The present study examined the factor structure underlying the Wisconsin Schizotypy Scales and the validity of these dimensions. Confirmatory factor analysis with 6137 nonclinical young adults supported a 2-factor model with positive and negative schizotypy dimensions. As predicted, the schizotypy dimensions were differentially related to psychopathology, personality, and social impairment. Both dimensions were related to schizotypal and paranoid symptoms. Positive schizotypy was uniquely related to psychotic-like experiences, substance abuse, mood disorders, and mental health treatment, whereas negative schizotypy was associated with negative and schizoid symptoms. Both dimensions were associated with poorer overall and social functioning, but negative schizotypy was associated with decreased likelihood of intimate relationships. The findings support the construct validity of a multidimensional model of schizotypy and the use of psychometric inventories to assess these dimensions.
Keywords: multidimensional, schizophrenia, psychometric screening, confirmatory factor analysis
Introduction
It has been more than 30 years since the Chapmans and their collaborators began developing their measures of schizotypy or psychosis proneness. Since that time their scales have been widely used with clinical and nonclinical samples. However, the scales have typically been used as manifest independent variables, and there have been few studies examining whether there is a meaningful factor structure underlying the scales. The present study examines the factor structure underlying four of the Wisconsin Schizotypy Scales—the Perceptual Aberration,1 Magical Ideation,2 Physical Anhedonia,3 and Revised Social Anhedonia (Eckblad ML, Chapman LJ, Chapman JP, Mishlove M, unpublished questionnaire, 1982) Scales—and examines the construct validity of these dimensions.
Schizotypy and Schizophrenia
Current models of the etiology of schizophrenia and related disorders4–7 implicitly or explicitly assume that there are schizotypic individuals who have neurodevelopmental vulnerability for developing such conditions. Although the exact mechanisms are not fully understood, this vulnerability is presumed to result from an accumulation or interaction of multiple genetic, neurodevelopmental, and psychosocial factors. Meehl8 used Rado's9 term schizotypy to refer to the personality organization that represents the expression of this vulnerability. It is assumed that there are individuals who have an underlying vulnerability for schizophrenia but who may never decompensate into clinical psychosis. In fact, it is presumed that the majority of these schizotypic individuals will never decompensate, although they may demonstrate mild or transient signs of schizophrenic-like or schizotypic adjustment that includes cognitive and biobehavioral deficits, clinical and subclinical symptoms, and social impairment.
This formulation suggests that schizotypy is expressed on a dynamic continuum ranging from relative psychological health to subclinical deviance to schizophrenia-spectrum personality disorders to full-blown schizophrenia, with severity contingent on the interaction of biopsychosocial factors.10 Because compensated or nonpsychotic schizotypes are hypothesized to share a common neurodevelopmental pathway with schizophrenia patients, it is expected that they will exhibit subclinical and clinical forms of the cognitive, emotional, and behavioral features of schizophrenia. We hypothesize that this impairment can provide points of entry for identifying schizotypic individuals. Furthermore, we hypothesize that the identification of schizotypic individuals should facilitate the determination of relevant etiological factors and may ultimately hasten the development of prophylactic treatment interventions. The study of schizotypy also minimizes many of the confounding effects of the consequences of schizophrenia (eg, hospitalization, psychotropic medications, marginalized social status) that complicate the study of patients with the disorder.
Schizotypy as a Multidimensional Construct
Schizotypy has been described as a multidimensional construct consisting of 2 or more factors. Consistent with multidimensional models of schizophrenia, candidate factors include positive schizotypy, negative schizotypy, cognitive disorganization, paranoia, and nonconformity.11–14 Positive and negative schizotypy are the most consistently replicated factors. While there is not a universally agreed upon latent structure of schizotypy, the proposed factors appear consistent with those hypothesized to comprise schizophrenia, including positive, negative, and disorganized dimensions.15–18 Findings of parallel factor structure add empirical support to the hypothesis that the neurodevelopmental vulnerability for schizophrenia is expressed across the continuum of schizotypy. The identification of a multidimensional structure should provide a model for better understanding the heterogeneity that characterizes schizotypy and schizophrenia. Furthermore, the reliable identification of these factors should provide an improved basis for exploring the etiological mechanisms that underlie these dimensions and the events that impact the progression toward clinical illness.
Wisconsin Scales of Schizotypy
Psychometric inventories provide a promising method for assessing schizotypy. First, these measures can be used to screen large numbers of individuals from the general population, rather than selecting participants based upon clinical status or consanguinity. In contrast, family studies provide a rather stratified group of at-risk participants because only about 15% of all patients with schizophrenia have a known first-degree relative with the disorder—thus providing a sample that is not wholly representative of future sufferers. Psychometric screening inventories also tend to be relatively noninvasive and inexpensive to administer and score. Finally, they can be used in conjunction with other measures of risk including family studies—as has been demonstrated by research such as the New York High-Risk Project.19
Loren and Jean Chapman and their collaborators developed a series of self-report, true-false questionnaires that were intended to measure symptoms and traits reported to be characteristic of the preschizophrenic condition. The development of the scales relied heavily on Meehl's20 description of schizotypy and the description of pseudoneurotic schizophrenia by Hoch and Cattell21. These measures include the Magical Ideation, Perceptual Aberration, Physical Anhedonia, and Revised Social Anhedonia Scales. The Perceptual Aberration Scale contains 35 items that tap schizophrenic-like perceptual and bodily distortions, while the Magical Ideation Scale is comprised of 30 items that tap a belief in implausible or invalid causality. The Revised Social Anhedonia Scale consists of 40 items that tap asociality and indifference to others. The Physical Anhedonia Scale includes 61 items that tap deficits in sensory and aesthetic pleasure. The questionnaires were not developed as diagnostic instruments or to map on specifically to diagnostic criteria. The Perceptual Aberration and Magical Ideation Scales were developed to tap positive schizotypy, while the anhedonia scales were designed to assess aspects of negative schizotypy. Surprisingly, the Revised Social Anhedonia Scale appears to tap aspects of both dimensions of schizotypy.22 The scales were developed following Jackson's23 recommendations for the construction of personality measures resulting in internally consistent questionnaires.
Validity of the Wisconsin Schizotypy Scales
The Wisconsin Schizotypy Scales have been widely used in cross-sectional and longitudinal studies with psychotic patients and psychosis-prone subjects. Nonpsychotic individuals with markedly elevated scores on these scales tend to show psychological and physiological deficits similar to those seen in schizophrenia patients.24,25 Chapman et al26 reinterviewed 95% of 534 putatively schizotypic and control participants in a 10-year longitudinal study. At the follow-up assessment, participants identified by the Perceptual Aberration and Magical Ideation Scales had higher rates of psychosis than control participants. In addition, schizotypic participants who did not develop psychotic disorders still exceeded the control group on ratings of schizotypal, paranoid, and psychotic-like symptoms. Chapman et al26 also examined the degree to which a combination of measures improved the prediction of psychosis at the 10-year follow-up. They reported that 14% of Magical Ideation subjects who also reported psychotic-like experiences at the initial assessment developed psychotic disorders at the follow-up assessment. Secondly, participants who were deviant on the Magical Ideation Scale and scored above the mean on the Revised Social Anhedonia Scale had a 21% rate of psychosis at the follow-up. Finally, the rate of psychosis leapt to 40% in the Magical Ideation-Social Anhedonia subjects who also reported psychotic-like experiences at the initial assessment. Kwapil27 reported that 24% of individuals scoring high on the Revised Social Anhedonia Scale exhibited schizophrenia-spectrum illnesses as compared with 1% of controls at a 10-year reassessment. The Physical Anhedonia Scale has not been an effective predictor of psychosis in longitudinal studies of college students. However, in cross-sectional research, high scorers on the scale exhibited cognitive, social, and physiological deficits similar to schizophrenic patients. Moreover, the New York High Risk Project19 found that the offspring of schizophrenic patients who had elevated scores on the Physical Anhedonia Scale showed increased rates of psychosis and social impairment. These findings support the validity of the construct of schizotypy and the use of the Perceptual Aberration, Magical Ideation, and Revised Social Anhedonia Scales as indicators of the construct.
Goals and Hypotheses of the Present Study
The initial goal of the present study was to examine the underlying factor structure assessed by the Wisconsin Schizotypy Scales in a large nonclinical sample of young adults. We hypothesized that a 2-factor solution would provide the best fit with the data. Specifically, it was expected that the 2 anhedonia scales would load on a negative schizotypy factor, while the Perceptual Aberration and Magical Ideation Scales would load on a positive schizotypy factor. We further expected, consistent with previous questionnaire and interview studies, that the best fitting model would involve the Revised Social Anhedonia Scale cross-loading onto the positive schizotypy factor as well. We hypothesized that this factor structure would be invariant across sex and between Caucasian and African American participants. Assuming that there was a discernable factor structure, we planned to compute dimensional scores for each of the participants.
The second goal of the study was to provide a preliminary examination of the validity of the schizotypy dimensions by exploring the relationship of the factor structure with interview and questionnaire measures of schizotypy, psychopathology, personality, and adjustment. We hypothesized that the positive and negative schizotypy factors would be differentially related to these measures. Specifically, we predicted that the positive dimension would be significantly related to interview measures of psychotic-like, schizotypal, and paranoid symptoms as well as mood disorders, substance use, and history of mental health treatment. The negative dimension was expected to be associated with ratings of negative, schizotypal, and schizoid symptoms and poorer overall functioning but not with mood disorders or substance use. It was expected that the interaction of both schizotypy dimensions would improve the prediction of overall functioning and schizotypic symptoms beyond the main effects. We hypothesized that the positive symptom dimension would be associated with questionnaire measures of neuroticism and openness to experience, while the negative symptom dimension would be inversely associated with extraversion and openness to experience. Both dimensions were presumed to be related to impairment in social functioning across multiple domains.
METHODS
Participants
Usable schizotypy questionnaires were completed by 6137 college undergraduates enrolled in introductory psychology courses at the University of North Carolina at Greensboro (UNCG) between 1998 and 2005. The mean age of the sample was 19.4 years (SD = 3.7). The sample was limited to Caucasian and African American participants because reliable norms for the schizotypy scales have not been established for other ethnic groups and because other ethnic groups comprised less than 2% of the sample of participants. Consistent with the student demographics at UNCG, the sample was 76% female and 24% male and 74% Caucasian and 26% African American. Males and females did not differ on age or ethnicity.
An unselected subset of 780 participants completed questionnaire measures of personality and social functioning following completion of the schizotypy scales. The subsample was comparable to the original sample with 75% female and 25% male and 78% Caucasian and 22% African American. The participants who completed the questionnaires did not differ from the remaining participants in the initial sample on their scores on the schizotypy scales. Likewise, a subset of 430 participants were administered structured diagnostic interviews. The subsample was comparable to the original sample with 74% female and 26% male and 74% Caucasian and 26% African American. The participants were recruited for interviews based upon their scores on the schizotypy scales as part of several different studies conducted at UNCG. The means on the schizotypy scales were slightly higher in the interviewed sample than in the noninterviewed sample; however, the distribution and range of scores were comparable between the 2 groups. Subjects provided informed consent and received course credit for participation in each part of the study. The study was approved by the UNCG Institutional Review Board and conducted in accordance with the American Psychological Association Code of Ethics.
Materials and Procedures
Schizotypy Questionnaires
Participants were administered the Perceptual Aberration, Magical Ideation, Revised Social Anhedonia, and Physical Anhedonia Scales. The items on the schizotypy scales were intermixed with a 13-item measure of infrequent responding (Chapman LJ, Chapman JP, unpublished questionnaire, 1983). The infrequency scale was included to screen out participants who responded in a random or “fake-bad” manner. Consistent with the recommendations of Chapman and Chapman (Chapman LJ, Chapman JP, unpublished questionnaire, 1983), participants who endorsed more than 2 infrequency items were dropped from further study. Participants completed these measures (along with measures not used in this study) as part of mass-screening sessions that lasted 1.5–2 hours.
Personality and Social Adjustment Questionnaires
Participants completed the NEO Personality Inventory-Revised28 (NEO-PI-R) and the Social Adjustment Scale—self-report version.29 The NEO-PI-R is a widely used self-report measure of the 5-factor model of personality. It is broken down into 5 domains, each of which has 6-facet scores. The scale contains 240 items, which are scored on a 5-point Likert scale from “Strongly Agree” to “Strongly Disagree.” The Social Adjustment Scale is a 54-item self-report measure that assesses functioning in a variety of social contexts. The scale provides a total score and 3 subscale scores applicable to college students that assess social functioning in school during social and leisure activities (including friendships and dating) and with extended family. Each question is rated on a 5-point scale with higher scores indicating greater impairment.
Structured Interviews
The interview contained the portions of the Structured Clinical Interview for the Diagnostic and Statistical Manual of Mental Disorders, Fourth Edition,30 that assess major depressive and manic episodes, substance use disorders, and demographic information. Quantitative ratings of substance use and impairment were coded using the rating system described in Kwapil.31 The modules of the International Personality Disorders Examination32 that assess schizoid, paranoid, and schizotypal personality disorders were also included. These personality disorders were assessed because they are reported to be genetically related to schizophrenia.33–35 The International Personality Disorders Examination provides personality disorders diagnoses and dimensional ratings of the disorders.
The Wisconsin Manual for Assessing Psychotic-like Experiences36,37 was used to quantify the deviance of psychotic symptoms across a broad range of clinical and subclinical deviancy. The manual provides criteria for rating 7 classes of experiences on a continuum from relatively normal to grossly psychotic, including (1) transmission of one's own thoughts, (2) passivity experiences, (3) thought withdrawal, (4) voice experiences and other auditory hallucinations, (5) other personally relevant aberrant beliefs, (6) visual hallucinations and other visual experiences, and (7) olfactory experiences. Experiences of mild or transient forms of psychotic symptoms in nonpsychotic persons have historically been thought of as precursors of clinical psychosis.21,38–40 Kwapil et al37 reported that the highest rating across the 7 classes of experiences provides a useful index of clinical and subclinical deviancy, and it effectively predicts the development of psychotic disorders. Interrater reliability is 0.89 for the highest symptom rating.
The Negative Symptom Manual (Kwapil TR, Dickerson LA, unpublished data, 2001), which provides a companion rating system to the Wisconsin Manual, was used to quantify negative symptoms of schizophrenia across a range of clinical and subclinical deviance. The manual consists of a structured interview and rating system that assesses 6 classes of symptoms across a range of clinical and subclinical deviance: alogia, flattened affect, anhedonia, social indifference, avolition/anergia, and impairment in attention (as well as producing a total score). Interrater reliability is 0.94 for the Negative Symptom Manual total score. The Global Assessment Scale (GAS)41 was used to assess overall functioning for each subject. The GAS is a rating of overall adjustment ranging from marked psychopathology at the low end to superior functioning at the high end. Interrater reliability was 0.87 for the GAS ratings.
The interviews were conducted by a licensed clinical psychologist and advanced graduate students in clinical psychology. The assessments were audiotaped and lasted approximately 2 hours. The interviewers were unaware of participants’ scores on the schizotypy questionnaires.
Results
Descriptive and Correlational Analyses for the Schizotypy Scales
Table 1 contains descriptive statistics for each of the schizotypy scales computed separately by gender and ethnicity. Two-way (group by ethnicity) analyses of variance were conducted for each of the 4 scales. The alpha level was set at 0.001 for the analyses due to the large sample size and the large number of analyses computed in order to minimize Type I error and to reduce the likelihood of reporting statistically significant but inconsequential findings (ie, findings that accounted for a trivial amount of variance). Nevertheless, the large sample size renders the interpretation of conventional p values problematic. Therefore, the eta2 effect size is reported and may be more instructive for considering the relative contribution of each effect. This statistic indicates the proportion of the total variance in the sample accounted for by each effect. Following Cohen,42 an effect size of 0.14 is considered large, 0.06 is considered medium, and 0.01 is considered small. None of the interaction effects accounted for more than 0.1% of the variance. The only main effect that accounted for a nontrivial portion of the variance was the main effect of ethnicity on the Physical Anhedonia Scale (small effect size). Contrary to previous recommendations,43 raw scores on the schizotypy scales (rather than scores normed on sex and ethnicity) were used for the subsequent analyses—given the minimal effect of these variables on the schizotypy scores.
Table 1.
Descriptive Statistics for the Schizotypy Scales by Sex and Ethnicity
| African American |
Caucasian |
Main Effects |
||||||
| Male | Female | Male | Female | |||||
| (n = 299) | (n = 1309) | (n = 1174) | (n = 3355) | Sex | Ethnicity | Interaction | ||
| Perceptual Aberration Scale | ||||||||
| Mean | 6.67 | 5.89 | 5.93 | 5.66 | F value | 6.9 | 6.0 | 1.6 |
| SD | 5.93 | 4.82 | 5.74 | 5.69 | p value | .009 | .015 | >.10 |
| α | .89 | .84 | .89 | .89 | η2 | <.001 | <.001 | <.001 |
| Magical Ideation Scale | ||||||||
| Mean | 10.56 | 9.92 | 9.29 | 9.06 | F value | 4.7 | 27.3 | 1.0 |
| SD | 5.45 | 5.13 | 5.61 | 5.75 | p value | .031 | <.001 | >.10 |
| α | .84 | .84 | .89 | .90 | η2 | <.001 | .001 | <.001 |
| Physical Anhedonia Scale | ||||||||
| Mean | 18.28 | 16.29 | 14.39 | 10.68 | F value | 144.0 | 400.0 | 13.2 |
| SD | 7.12 | 6.57 | 7.77 | 5.99 | p value | <.001 | <.001 | <.001 |
| α | .80 | .79 | .86 | .81 | η2 | .005 | .013 | <.001 |
| Revised Social Anhedonia Scale | ||||||||
| Mean | 11.38 | 10.23 | 9.64 | 7.23 | F value | 78.3 | 137.4 | 9.7 |
| SD | 5.74 | 5.46 | 6.27 | 5.34 | p value | <.001 | <.001 | .002 |
| α | .81 | .81 | .85 | .84 | η2 | .004 | .007 | <.001 |
Note: df = 1, 6133 for all analyses.
Table 2 presents the Pearson correlations of the scales for the total sample. According to Cohen42 correlations of 0.10 indicate small effect sizes, 0.30 indicate medium effect sizes, and 0.50 indicate large effect sizes (with squared correlation coefficients indicating the amount of variance shared or accounted for in the bivariate relationship). Consistent with previous findings,44 the Perceptual Aberration and Magical Ideation Scales were highly correlated, as were the Social Anhedonia and Physical Anhedonia scales. The Physical Anhedonia Scale was not correlated with Perceptual Aberration or Magical Ideation scores. The Revised Social Anhedonia Scale was significantly, though modestly, correlated with the Perceptual Aberration and Magical Ideation Scales—consistent with the finding that the Revised Social Anhedonia Scale taps aspects of both positive and negative schizotypy. The pattern of correlations was comparable when computed separately by sex and ethnicity.
Table 2.
Pearson Correlations and Reliabilities of the Schizotypy Scales for the Total Sample (n = 6137)
| Perceptual Aberration | Magical Ideation | Physical Anhedonia | Revised Social Anhedonia | |
| Perceptual Aberration | 0.88 | |||
| Magical Ideation | 0.69 | 0.84 | ||
| Physical Anhedonia | −0.03 | −0.10 | 0.84 | |
| Revised Social Anhedonia | 0.29 | 0.22 | 0.42 | 0.84 |
Note: Coefficient alpha presented along the diagonal.
Confirmatory Factor Analyses
Confirmatory factor analyses (CFAs) were conducted to examine the factor structure of psychometrically assessed schizotypy. The sample size and the number of participants per observable variable were more than sufficient for conducting CFA.45,46 The items for each of the schizotypy scales were divided into 3 “parcels” in order to produce more robust estimates.48 Following the recommendations of Little et al. (2002), each of the scales was divided into 3 parcels by randomly distributing groups of 3 items to the parcels in sequential order to ensure that each parcel contained a comparable proportion of items from the beginning, middle, and end of the scale. The coefficient alphas of the parcels ranged from 0.56 to 0.75 (mean = 0.65), consistent with the estimations computed using the Spearman-Brown prophecy formula for the effects of shortening the measures to this degree. While each parcel had lower reliability than the original measures, they allowed us to produce a more robust estimate of our latent constructs. The residuals from each parcel within a schizotypy scale were allowed to correlate given the common source. Goodness of fit was assessed using multiple indicators listed in table 3, including the goodness of fit index, adjusted goodness of fit index, normed fit index, comparative fit index, root mean square error of approximation, and the chi-square statistic. Adequate fit of the model to the data is generally indicated by fit indices greater than 0.95, root mean square error of approximation less than 0.05, and nonsignificant chi-squares47,48; however, with a large sample, it is unlikely to report a nonsignificant value.
Table 3.
Confirmatory Factor Analyses of Schizotypy Scale Parcels (n = 6137)
| Model | GFI | AGFI | NFI | CFI | RMSEA | RMSEA CI | Chi-square (df) | p value | Δχ2 (Δdf) | p value |
| Factor Structure for the Total Sample | ||||||||||
| Unidimensional | 0.90 | 0.82 | 0.92 | 0.92 | 0.111 | 0.108–0.114 | 3295.0 (43) | <.001 | ||
| 2-Factora | 0.98 | 0.96 | 0.98 | 0.98 | 0.053 | 0.050–0.056 | 772.6 (42) | <.001 | ||
| 2-Factorb | 0.99 | 0.99 | 0.99 | 0.99 | 0.032 | 0.029–0.036 | 285.3 (39) | <.001 | 487.3 (3) | <.001 |
| Factor Invariance across Sex and Ethnicity | ||||||||||
| Unconstrained | 0.98 | 0.98 | 0.99 | 0.99 | 0.017 | 0.015–0.019 | 558.2 (202) | <.001 | ||
| Regression Weights Constrained | 0.98 | 0.98 | 0.98 | 0.99 | 0.017 | 0.016–0.019 | 680.3 (241) | <.001 | ||
| Structural Covariances Constrained | 0.98 | 0.97 | 0.98 | 0.98 | 0.020 | 0.018–0.021 | 841.1 (273) | <.001 | ||
Note: GFI, Goodness of Fit Index; AGFI, Adjusted Goodness of Fit Index; NFI, Normed Fit Index; CFI, Comparative Fit Index; RMSEA, Root Mean Square Error of Approximation; RMSEA CI, 90% confidence interval for RMSEA.
Positive schizotypy factor (with loadings from the Perceptual Aberration and Magical Ideation Scales) and negative schizotypy factor (with loadings from the Revised Social Anhedonia and Physical Anhedonia Scales).
Positive schizotypy factor (with loadings from the Perceptual Aberration, Magical Ideation and Revised Social Anhedonia Scales) and negative schizotypy factor (with loadings from the Revised Social Anhedonia and Physical Anhedonia Scales).
Three models were tested to examine factor structure. The first (default) model did not differentiate an underlying factor structure for schizotypy—all the variables loaded on a generic schizotypy factor. As seen in table 3, the fit for this model was poor. The second model included a positive schizotypy factor with loadings from the Perceptual Aberration and Magical Ideation Scale parcels and a negative schizotypy factor with loadings from the Revised Social Anhedonia and Physical Anhedonia Scale parcels. The schizotypy factors were allowed to correlate in this and the subsequent models. This model provided improved fit for the data but still failed to provide adequate fit. The final model was the same as the previous, except that the Revised Social Anhedonia Scale was allowed to load on both the schizotypy factors. This 2-factor model provided an excellent fit for the data. Given that the final 2 models were nested, the change in chi-square and degrees of freedom was evaluated between them. The final model provided significantly improved fit over the second model. Figure 1 contains the standardized coefficients for the final model.
Fig. 1.
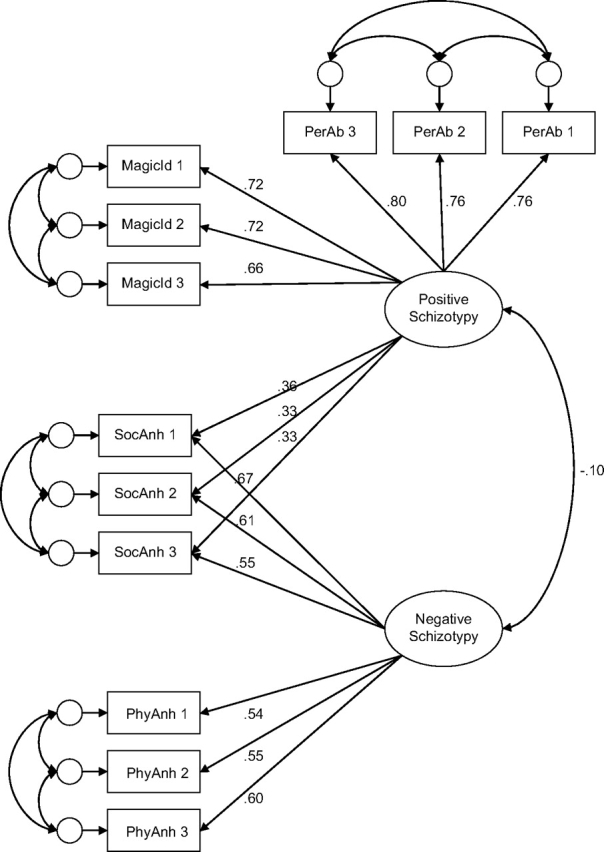
Two-factor solution with standardized coefficients.
In order to test the invariance of the factor structure across sex and ethnicity, a multigroup, multimodel comparison was conducted using the final 2-factor structure reported above. In the first model, the subscales were allowed to freely load on the schizotypy factors for each of the 4 sex-by-ethnicity groups (eg, African American females). In the second model, the regression weights (but not the structural covariances) were constrained to be identical across the 4 sex/ethnicity groups. The final model was the most restrictive in that it constrained the factor variances and covariances, in addition to the regression weights, across the 4 groups. As seen in table 3, the 2 constrained models fit the data equally as well as the model in which the factor loadings were allowed to vary freely, supporting the comparability of the factor structure of psychometrically assessed schizotypy across sex and ethnicity.
Bootstrap Procedures
As noted in Chapman et al,43 the distributions of scores for their scales depart from normality. Following the recommendation of Wilcox and Muska,49 the correlations reported in table 2 and the final CFA model reported in table 3 were computed using bootstrap procedures. In each case, the analysis was computed using 1000 bootstrap samples and the difference (bias) between the original coefficients and the bootstrapped coefficients was computed. In every reanalysis, all 1000 bootstrap samples were usable. The bias values for the correlations presented in table 2 were within ±0.001 in every case, supporting the original estimates. Likewise, the bias was minimal for the standardized regression weights (bias range: 0.000–0.004) and the correlation coefficient (0.003) in the CFA. The results of the bootstrap analyses support the findings of the original analyses.
Validity of the Schizotypy Factors
Positive and negative schizotypy dimensional scores were computed for each subject based upon the factor weights derived from the final CFA. In order to provide a preliminary examination of the validity of the schizotypy dimensions, a series of hierarchical linear and binary logistic regression analyses were computed assessing the relative contribution of each of the schizotypy dimensions and their interaction to the prediction of interview measures of psychopathology and questionnaire measures of personality and adjustment. In every analysis, the positive and negative schizotypy factor scores were entered simultaneously in the regression at the first step in order to examine the relative contribution of each factor, while controlling for the other factor (this in essence creates an “equal horse race” in which the variance accounted for by each factor is examined independent of the other factor). The interaction term was always entered at the second step to assess its effect over and above the main effects (however, note that contrary to our hypotheses none of the interaction terms accounted for a significant increment in variance). The standardized regression coefficient (β) and semipartial r2 for each predictor was reported for continuous dependent measures. Binary logistic regression was computed in the case of dichotomous, dependent variables with the odds ratios and 95% confidence intervals reported.
Relationship With Interview Measures of Psychopathology
Table 4 presents the relationship of the positive and negative schizotypy factors with interview measures of psychopathology. As expected, both dimensions were associated with poorer overall adjustment. Consistent with our predictions, the negative schizotypy dimension was significantly associated with interview ratings of negative, schizotypal, schizoid, and paranoid but not psychotic-like (positive) symptoms. Negative schizotypy was also associated with never having a steady intimate relationship. Consistent with the idea that negative schizotypy is associated with blunted affect and diminished sensation seeking, the factor score was not significantly associated with mood episodes or substance use. Furthermore, negative schizotypy was unrelated to history of mental health treatment. Positive schizotypy was generally associated with a different pattern of impairment. Specifically, the dimension was associated with elevated ratings of psychotic-like, schizotypal, and paranoid (but not schizoid or negative) symptoms. It also was significantly associated with mood episodes, increased substance use and abuse, history of psychiatric hospitalization, outpatient mental health treatment, and pharmacotherapy.
Table 4.
Linear and Logistic Regressions of the Interview Measures of Psychopathology (n = 430)
| Multiple linear regressions | ||||||
| Step 1 |
Step 2 |
|||||
| Positive Schizotypy |
Negative Schizotypy |
Interaction |
||||
| Criterion | β | Δr2 | β | Δr2 | β | Δr2 |
| Global Adjustment Scale | −.348 | 0.116* | −.268 | 0.066* | .044 | 0.002 |
| Psychotic-like experiences | .534 | 0.285* | .060 | 0.004 | −.026 | 0.001 |
| Schizotypal symptoms | .424 | 0.180* | .181 | 0.033* | .020 | 0.000 |
| Schizoid symptoms | .091 | 0.008 | .445 | 0.198* | .071 | 0.005 |
| Paranoid symptoms | .206 | 0.042* | .203 | 0.041* | .062 | 0.004 |
| Alcohol use | .160 | 0.025* | −.048 | 0.002 | −.081 | 0.006 |
| Alcohol impairment | .221 | 0.049* | −.065 | 0.004 | −.112 | 0.011 |
| Drug use | .362 | 0.131* | −.076 | 0.006 | −.100 | 0.009 |
| Drug impairment | .333 | 0.111* | −.075 | 0.006 | −.075 | 0.005 |
| Binary logistic regressions | ||||||
| Step 1 |
Step 2 |
|||||
| Positive Schizotypy |
Negative Schizotypy |
Interaction |
||||
| Criterion | OR | 95% CI | OR | 95% CI | OR | 95% CI |
| No steady relationship | 0.89 | 0.74–1.11 | 1.28* | 1.09–1.50 | 1.03 | 0.90–1.13 |
| Major depressive episode | 1.54* | 1.30–1.84 | .88 | 0.72–1.07 | 0.92 | 0.79–1.07 |
| Manic episode | 3.26* | 1.62–6.59 | 1.18 | 0.56–2.46 | 1.44 | 0.72–2.87 |
| Psychiatric treatment | ||||||
| Hospitalization | 2.04* | 1.37–3.04 | 1.23 | 0.78–1.93 | 1.03 | 0.74–1.44 |
| Outpatient | 1.47* | 1.24–1.74 | .88 | 0.73–1.06 | 1.05 | 0.90–1.22 |
| Medication | 1.49* | 1.21–1.82 | 1.06 | 0.85–1.32 | 1.27 | 1.05–1.53 |
| First or second degree relative | ||||||
| With psychosis | 1.31 | 0.96–1.78 | 1.09 | 0.79–1.53 | .88 | 0.70–1.11 |
| With nonpsychotic illness | 1.24 | 1.07–1.43 | .94 | 0.82–1.09 | .96 | 0.85–1.09 |
Note: df for all linear regressions: Step 1 = 1, 428; Step 2 = 1, 427; Step 3 = 1, 426. CI, confidence interval.
*p < .001.
Relationship With Questionnaire Measures of Personality and Social Functioning
Table 5 presents the standardized regression coefficient (β) and semipartial r2 for the positive schizotypy, negative schizotypy, and interaction terms in the prediction of scores on the Social Adjustment Scale total and subscale scores and the NEO-PI-R domain scores. Both schizotypy dimensions were associated with overall ratings of social impairment. Positive schizotypy was associated with social impairment in school, leisure, and family settings, whereas negative schizotypy was only associated with impairment in leisure and family settings. Positive schizotypy was associated with increased neuroticism and decreased agreeableness and conscientiousness. Negative schizotypy was associated with introversion (low extraversion) and decreased agreeableness. The distinction between positive and negative schizotypy was best captured by openness to experience because positive schizotypy was positively associated with the domain, while negative schizotypy had an inverse relationship (each schizotypy dimension independently accounted for more than 10% of the variance in openness).
Table 5.
Linear Regressions of the Questionnaire Measures of Personality and Adjustment (n = 780)
| Step 1 |
Step 2 |
|||||
| Positive Schizotypy |
Negative Schizotypy |
Interaction |
||||
| Criterion | β | Δr2 | β | Δr2 | β | Δr2 |
| Social Adjustment Scale | ||||||
| Total | .260 | 0.065* | .222 | 0.048* | .019 | 0.001 |
| Student | .221 | 0.048* | .030 | 0.001 | .024 | 0.001 |
| Leisure | .122 | 0.014* | .289 | 0.081* | .019 | 0.001 |
| Family | .250 | 0.061* | .120 | 0.015* | .035 | 0.001 |
| NEO-PI-R | ||||||
| Neuroticism | .350 | .119* | .030 | .001 | .047 | .002 |
| Extraversion | −.061 | 0.004 | −.528 | 0.271* | −.068 | 0.004 |
| Openness to experience | .333 | 0.108* | −.400 | 0.155* | .053 | 0.003 |
| Agreeableness | −.177 | 0.030* | −.256 | 0.064* | .014 | 0.001 |
| Conscientiousness | −.222 | 0.048* | .035 | 0.001 | .036 | 0.001 |
Note: df for all linear regressions: Step 1 = 1, 778; Step 2 = 1, 777; Step 3 = 1, 776.
*p < .001.
Discussion
The identification of schizotypic individuals holds the promise of advancing our understanding of the neurodevelopmental and psychosocial processes that produce schizotypy and that exacerbate or provide protection against the development of schizophrenia and spectrum disorders. Furthermore, it is an essential step in the development of preventative treatment programs—interventions that are currently controversial due to our limited ability to accurately identify individuals at risk of developing such disorders and our lack of understanding about which interventions are truly prophylactic.
Consistent with the current literature, we hypothesized that schizotypy (and by extension schizophrenia) is expressed across multiple dimensions—although the exact number, nature, etiology, and interrelationships of these dimensions are not unequivocally established. Furthermore, we suggested that the psychometric method provides an effective and noninvasive vehicle for assessing at least some of these schizotypic dimensions—or more colloquially, for getting one's foot in the schizotypy door. The present article focused on the Wisconsin Schizotypy Scales. However, it should be noted that there are a number of other valuable screening questionnaires that have been widely used, including the Schizotypal Personality Questionnaire,50 the Schizotypal Trait Assessment,51 Oxford-Liverpool Inventory of Feelings and Experiences (O-LIFE),52 and the Rust Inventory of Schizotypal Cognitions.53 The goal of the present work was not to reify particular measures—in fact, we suggest that both the promising features and the shortcomings of the Wisconsin Scales likely apply to many of the other available psychometric screening measures. Rather, the goals were to clarify the constructs underlying these scales and to assess their validity.
Consistent with the multidimensional view of schizotypy, the CFAs supported a 2-factor structure underlying the Wisconsin Schizotypy Scales in late adolescence and early adulthood—a structure that was invariant across sex and ethnicity. Note that the finding that the CFAs only identified positive and negative dimensions of schizotypy was not meant to imply that there are only 2 factors underlying the construct. Positive and negative symptom dimensions are the most widely reported factors of schizotypy and schizophrenia; however, our focus on and identification of these factors admittedly reflects the nature of the measures administered. Note that we did not test any model with more than 2 factors because meaningful hypotheses could not be offered supporting 3- or 4-factor models using these questionnaires. However, we believe that identification and validation of additional dimensions are essential for furthering our understanding of schizotypy.
There is considerable controversy regarding the underlying nature of schizotypy. The predominately European notion of schizotypy, as espoused by Claridge,54 considers schizotypy to be a normal dimension of personality (fully dimensional model), while the predominately North American conceptualization of schizotypy, as set forth by Meehl,8 considers schizotypy to represent the expression of a pathological process of neurodevelopment that is taxonic in nature. Lenzenweger and Korfine55 and Lenzenweger et al56have used taxometric methods and finite mixture modeling to support the notion of a schizotypic taxon.55,56 However, both the North American and European conceptualizations are consistent with a multifactorial structure for schizotypy in which schizotypic traits are distributed across continua of increasing severity. The models differ on whether these dimensions are continuous or discontinuous with the general population. It is important to note that the present study focused on identifying and validating the dimensional structure underlying the Wisconsin Scales not resolving the issue of whether schizotypy is fully dimensional or taxonic in nature—although the reliable identification of these underlying dimensions should facilitate resolution of this larger issue.
What Are We Tapping With Psychometric Scales of Positive and Negative Schizotypy?
The dimensions of positive and negative schizotypy were predictably related to a variety of interview and questionnaire measures of psychopathology and functioning. However, there were also expected areas of overlap in these relationships, such that both dimensions were associated with impairment in overall and social functioning and with interview ratings of schizotypal and paranoid symptoms. First, significant deviance in any personality dimension in general, and in any schizotypy dimension in particular, would likely be associated with impairments in functioning—especially social functioning. Second, schizotypal symptoms as defined in Diagnostic and Statistical Manual of Mental Disorders include a mix of positive and negative symptoms in the cognitive-perceptual, social, and motivational domains. Finally, paranoid symptoms have been found to load on different factors in different studies as well as being reported as a separate factor of schizotypy.
The relationship of the schizotypy dimensions with measures of personality and psychopathology were consistent with the analogous symptom dimensions in full-blown schizophrenia. Endorsement of positive schizotypic traits on psychometric screening inventories was associated with schizophrenic-like psychopathology across a broad range of clinical and subclinical deviancy. In particular, positive traits were associated with interview ratings of psychotic-like experiences—experiences that in their extreme form manifest as first-rank symptoms of schizophrenia. As hypothesized, positive schizotypy scores were associated with high levels of neuroticism and openness to experience and with low levels of agreeableness and conscientiousness.
Positive schizotypy also predicted history of manic and depressive episodes, increased substance use and abuse, and psychiatric treatment. The relationship of positive schizotypy with manic and depressive episodes is consistent with the clinical and empirical literature for schizotypy, schizophrenia, and spectrum disorders. Depression and anxiety are significantly associated with positive schizotypy (but not with negative schizotypy) in nonclinical young adults when measured cross-sectionally.22 Likewise, Chapman et al26 found that young adults identified by the Perceptual Aberration and Magical Ideation Scales had markedly elevated rates of mood disorders at a 10-year follow-up assessment relative to control and anhedonic participants. Similarly, a 1-year follow-up of participants from the general population found that individuals with high scores on an inventory of delusions were 9 times more likely to report an episode of depression during the follow-up period.57 Clearly, affective dysregulation and disorders occur across the continuum of schizotypy—and this affective dysregulation appears to be best conceptualized as part of the positive schizotypy dimension.
The finding that positive schizotypy was associated with mania and hypomania is consistent with Claridge and colleagues52 conceptualization of positive schizotypy. Claridge54 noted the relationship of schizotypy with affective instability characteristic of borderline personality and cyclothymia, and items assessing hypomania were included in the unusual experiences factor of the O-LIFE. The present findings are also consistent with the similarities in symptoms and genetic liability between mood and nonmood psychoses58 and in line with the classical Einheit psychoses or unitary psychoses concept that affective and nonaffective psychoses actually lie on a continuum.59
Endorsement of negative schizotypy was associated with interview ratings of negative and schizoid symptoms as well as with never having been engaged in a steady relationship. There was not an association between negative schizotypy and mood episodes, despite the greater phenotypic resemblance of depression to negative than positive schizotypy (eg, apathy, social withdrawal, anhedonia). Previous studies examining symptom dimensions in schizotypy22 and schizophrenia60 consistently report a much stronger relationship of mood symptoms with the positive, than the negative, dimension. These data and clinical observation seem to point out that unlike positive schizotypy, negative schizotypy is associated with a reduced experience of affective tone and reactivity.22
In terms of personality, negative schizotypy scores were associated with introversion, low openness to experience, and low agreeableness. The differentiation of positive and negative schizotypy on openness to experience is consistent with suggestion of Costa and Widiger61 that schizoid and schizotypal pathology may be distinguishable by the profile of their scores on this domain. This pattern of differential relationships across these domains (psychopathology, personality, social) validates these constructs and indicates the usefulness of the current psychometric inventories to capture schizotypy in nonclinical populations. Consistent with Claridge's54 fully dimensional model of schizotypy, some researchers have suggested that openness to experience may be a “nonpathological counterpart to positive schizotypy” that includes expressions such as creativity62 and out-of-body experiences.63
Contrary to our expectations, the interaction between positive and negative schizotypy did not improve our prediction of psychopathology or functioning. This is in contrast to findings from cluster-analytic studies that participants classified as being high in both positive and negative schizotypy exhibited broader and markedly more severe impairment than individuals characterized by only positive or negative schizotypy.64
Social Anhedonia as a Component of Both Positive and Negative Schizotypy
The 2-factor model in which the Revised Social Anhedonia Scale loaded exclusively on the negative schizotypy factor along with the Physical Anhedonia Scale did not provide as good of a fit to the data because the final model in which the Revised Social Anhedonia Scale was allowed to load on both the positive and negative schizotypy factors. From a conceptual standpoint, social anhedonia is part of negative schizotypy, which is characterized by diminished affect and avolition—in sharp contrast to the behavioral and affective excesses associated with positive schizotypy. However, the present finding is consistent with the modest positive correlation of the Revised Social Anhedonia Scale with measures of positive schizotypy reported here and elsewhere65 and with interview assessments of participants identified by deviantly high scores on the scale. Kwapil27 reported that socially anhedonic college students exhibited elevated rates of schizophrenia-spectrum disorders and psychotic-like symptoms at a 10-year follow-up assessment. Similarly, Diaz et al66 reported that social anhedonia participants exceeded control participants on interview-based ratings of psychotic-like and negative symptoms. In both studies, the findings were independent of scores on the Magical Ideation and Perceptual Aberration Scales. In contrast, high scorers on the Perceptual Aberration and Magical Ideation Scales only reported elevated rates of psychotic-like, but not negative, symptoms, while high scorers on the Physical Anhedonia Scale only reported negative symptoms.67 These findings are especially striking considering that the items on the Revised Social Anhedonia Scale simply inquire about disinterest in social contact—none of the items assess unusual perceptual experiences or magical beliefs.
The finding that the Revised Social Anhedonia Scale taps both positive and negative schizotypy dimensions calls into question either our conceptual understanding of social anhedonia or our methodological understanding of what the scale actually assesses. The relationship between the positive and negative schizotypy dimensions in our final 2 models differed considerably depending upon whether the scale was allowed to cross load on both dimensions (the factors were orthogonal in the cross-loaded model but positively correlated in the model in which social anhedonia only loaded on negative schizotypy). Again, this becomes a question of whether the shared variance best reflects that the Revised Social Anhedonia Scale taps both dimensions or that the schizotypy dimensions are significantly associated. Obviously, the present study cannot definitively disentangle this issue. However, given both the conceptual and empirical information noted above, we suggest that the most parsimonious explanation is that this represents a measurement issue and that a purer measure of the construct would not load on both dimensions—allowing us to better understand the relationship between the positive and negative schizotypy dimensions. Given that social anhedonia is firmly rooted in negative symptom schizotypy, the results suggest that the Revised Social Anhedonia Scale is actually a better multidimensional measure of schizotypy than a pure measure of the negative dimension.
Beyond Positive and Negative Schizotypy Dimensions
The present findings support further theoretical and empirical examination of the multidimensional structure of schizotypy. However, this obviously raises the conceptual question about which dimensions underlie schizotypy, and of these, which can be successfully assessed via self-report measures. The schizophrenia and schizotypy literatures suggest that positive symptoms of clinical and subclinical deviance can be readily identified by self-report (in fact, nonpsychotic individuals may be better able to recognize the deviant nature of unusual perceptual experiences and magical beliefs because their connection to reality is presumed to be more intact than their psychotic counterparts). Likewise, schizotypic individuals appear readily able to report on a number of negative features such as social disinterest, diminished affect, avolition, and anhedonia. However, questionnaire measures have not proven as successful at assessing mild forms of formal thought disturbance and cognitive disorganization. This may reflect that the disturbance itself impedes participants’ ability to recognize and report such impairment, as well as the fact that formal thought disturbance may only become manifest at more extreme (clinical) ends of the distribution of schizotypy. Similarly, behavioral disorganization (as opposed to purposefully nonconforming behavior) may be less accessible to self-report assessments than to observer ratings. Building on Eysenck's conceptualization of psychoticism, several measures have been developed to assess impulsive nonconformity as a dimension of schizotypy.52,68,69 However, empirical findings have not generally supported the inclusion of this dimension.70 The present study found that interview ratings of paranoid experiences are associated with both positive and negative schizotypy. In contrast, Stefanis et al13 found support for a separate paranoid dimension of schizotypy. Furthermore, a number of promising new measures of paranoid ideation and behaviors have been recently developed, including the Paranoia Checklist71 and the Paranoia Scale.72 Given that schizotypy is conceptualized as multidimensional, it will be important that new measures focus on assessing the severity of these dimensions across a broad range of severity.
The late 1970s to mid 1990s saw the creation of a number of psychometric inventories designed to assess aspects of schizotypy (under many different guises). Since that time, interest has focused more on the development of interview measures of schizotypic symptoms and impairment such as the Structured Interview for Prodromal Symptoms73 and Comprehensive Assessment of At-Risk Mental States,74 and the Negative Symptom Manual. It is important to note that while these interviews are especially useful for providing quantitative ratings of the severity of schizotypic impairment, they are not practical as first-line screening measures of schizotypy given the time and expertise that they require to administer. A considerable amount of cross-sectional data have been collected with psychometric screening questionnaires (and summarized elsewhere) allowing us to assess their basic psychometric properties as well as to evaluate their relationship with neurocognitive, affective, and social impairment and a wide array of clinical symptoms. However, these measures are simply tools that bear reevaluation (and almost certainly refinement).
Researchers should bear in mind that the development and use of psychometric screening assessments is still a work in progress that aims at a moving target (the construct of schizotypy). Ideally, our understanding of the construct should inform the development of measures, and the findings from employing the measures should refine our understanding and assessment of the construct. Again, this means that our measures simply provide a point of entry for studying schizotypy that should be used in conjunction with measures of neurophysiological, neurocognitive, behavioral, social, and emotional functioning and impairment.
Funding
Young Investigator Awards National Alliance for Research on Schizophrenia and Depression (Young Investigator Awards to T.R.K.).
Acknowledgments
None of the authors had conflicts of interest regarding the research described in the manuscript.
We wish to thank Professors Loren and Jean Chapman, as well as Leslie Brown and Kathryn Lewandowski, for their comments on earlier versions of the manuscript. We also thank Martha Diaz and Leigh Dickerson for assistance with data collection and George O'Toole for assistance with data management.
References
- 1.Chapman LJ, Chapman JP, Raulin ML. Body image aberration in schizophrenia. J Abnorm Psychol. 1978;87:399–407. doi: 10.1037//0021-843x.87.4.399. [DOI] [PubMed] [Google Scholar]
- 2.Eckblad ML, Chapman LJ. Magical ideation as an indicator of schizotypy. J Consult Clin Psychol. 1983;51:215–225. doi: 10.1037//0022-006x.51.2.215. [DOI] [PubMed] [Google Scholar]
- 3.Chapman LJ, Chapman JP, Raulin ML. Scales for physical and social anhedonia. J Abnorm Psychol. 1976;85:374–382. doi: 10.1037//0021-843x.85.4.374. [DOI] [PubMed] [Google Scholar]
- 4.Andreasen NC. A unitary model of schizophrenia: Bleuler's “fragmented phrene” as schizencephaly. Arch Gen Psychiatry. 1999;56:781–793. doi: 10.1001/archpsyc.56.9.781. [DOI] [PubMed] [Google Scholar]
- 5.Keshavan MS. Neurodevelopment and schizophrenia: quo vadis? In: Keshavan MS, Murray RM, editors. Neurodevelopment and Adult Psychopathology. London, UK: Cambridge University Press; 1997. pp. 267–277. [Google Scholar]
- 6.Murray RM, Lewis SW. Is schizophrenia a neurodevelopmental disorder? Br Med J (Clin Res Ed) 1987;295:681–682. doi: 10.1136/bmj.295.6600.681. [DOI] [PMC free article] [PubMed] [Google Scholar]
- 7.Weinberger DR. Implications of normal brain development for the pathogenesis of schizophrenia. Arch Gen Psychiatry. 1987;44:660–669. doi: 10.1001/archpsyc.1987.01800190080012. [DOI] [PubMed] [Google Scholar]
- 8.Meehl PE. Schizotaxia, schizotypy, schizophrenia. Am Psychol. 1962;17:827–838. [Google Scholar]
- 9.Rado S. Psychoanalysis of Behavior. New York, NY: Grune & Stratton; 1956. [Google Scholar]
- 10.Gooding DC, Iacono WG. Developmental Psychopathology. New York, NY: Wiley & Sons; 1995. Schizophrenia through the lens of a developmental psychopathology perspective; pp. 535–580. [Google Scholar]
- 11.Claridge G, McCreery C, Mason O, et al. The factor structure of ‘schizotypal’ traits: a large replication study. Br J Clin Psychol. 1996;35:103–115. doi: 10.1111/j.2044-8260.1996.tb01166.x. [DOI] [PubMed] [Google Scholar]
- 12.Raine A, Reynolds C, Lencz T, Scerbo A, Triphon N, Kim D. Cognitive-perceptual, interpersonal and disorganized features of schizotypal personality. Schizophr Bull. 1994;20:191–201. doi: 10.1093/schbul/20.1.191. [DOI] [PubMed] [Google Scholar]
- 13.Stefanis NC, Smyrnis N, Avramopoulos D, Evdokimidis I, Ntzoufras I, Stefanis CN. Factorial composition of self-rated schizotypal traits among young males undergoing military training. Schizophr Bull. 2004;30:335–350. doi: 10.1093/oxfordjournals.schbul.a007083. [DOI] [PubMed] [Google Scholar]
- 14.Vollema MG, van den Bosch RJ. The multidimensionality of schizotypy. Schizophr Bull. 1995;21:19–31. doi: 10.1093/schbul/21.1.19. [DOI] [PubMed] [Google Scholar]
- 15.Arndt S, Alliger RJ, Andreasen NC. The distinction of positive and negative symptoms. The failure of a two-dimensional model. Br J Psychiatry. 1991;158:317–322. doi: 10.1192/bjp.158.3.317. [DOI] [PubMed] [Google Scholar]
- 16.Bilder RM, Mukherjee S, Rieder RO, Pandurangi AK. Symptomatic and neuropsychological components of defect states. Schizophr Bull. 1985;11:409–419. doi: 10.1093/schbul/11.3.409. [DOI] [PubMed] [Google Scholar]
- 17.Liddle PF. The symptoms of chronic schizophrenia: a re-examination of the positive-negative dichotomy. Br J Psychiatry. 1987;151:145–151. doi: 10.1192/bjp.151.2.145. [DOI] [PubMed] [Google Scholar]
- 18.Peralta V, Cuesta MJ, de Leon J. Positive versus negative schizophrenia and basic symptoms. Compr Psychiatry. 1992;33:202–206. doi: 10.1016/0010-440x(92)90031-k. [DOI] [PubMed] [Google Scholar]
- 19.Erlenmeyer-Kimling L, Cornblatt BA, Rock D, Roberts S, Bell M, West A. The New York High-Risk Project: anhedonia, attentional deviance, and psychopathology. Schizophr Bull. 1993;19:141–153. doi: 10.1093/schbul/19.1.141. [DOI] [PubMed] [Google Scholar]
- 20.Meehl PE. Manual for Use With Checklist of Schizotypic Signs. (No. PR-73-5). Minneapolis, MN: University of Minnesota Research Laboratories of the Department of Psychiatry; 1964. [Google Scholar]
- 21.Hoch PH, Cattell JP. The diagnosis of pseudoneurotic schizophrenia. Psychiatr Q. 1959;33:17–43. doi: 10.1007/BF01659427. [DOI] [PubMed] [Google Scholar]
- 22.Lewandowski KE, Barrantes-Vidal N, Nelson-Gray RO, Clancy C, Kepley HO, Kwapil TR. Anxiety and depression symptoms in psychometrically identified schizotypy. Schizophr Res. 2006;83:225–235. doi: 10.1016/j.schres.2005.11.024. [DOI] [PubMed] [Google Scholar]
- 23.Jackson DN. A sequential system for personality scale development. In: Spielberger CN, editor. Current Topics in Clinical and Community Psychology, Vol. 2. New York, NY: Academic Press; 1970. pp. 61–96. [Google Scholar]
- 24.Edell WS. The Wisconsin Psychosis-Proneness Scales. In: Miller GA, editor. The Behavioral High-Risk Paradigm in Psychopathology. New York, NY: Springer-Verlag; 1995. [Google Scholar]
- 25.Fernandes LOL, Miller GA. Compromised performance and abnormal psycho-physiology associated with the Wisconsin Psychosis-Proneness Scales. In: Miller GA, editor. The Behavioral High-Risk Paradigm in Psychopathology. New York, NY: Springer-Verlag; 1995. [Google Scholar]
- 26.Chapman LJ, Chapman JP, Kwapil TR, Eckblad M, Zinser MC. Putatively psychosis-prone subjects 10 years later. J Abnorm Psychol. 1994;103:171–183. doi: 10.1037//0021-843x.103.2.171. [DOI] [PubMed] [Google Scholar]
- 27.Kwapil TR. Social anhedonia as a predictor of the development of schizophrenia-spectrum disorders. J Abnorm Psychol. 1998;107:558–565. doi: 10.1037//0021-843x.107.4.558. [DOI] [PubMed] [Google Scholar]
- 28.Costa PT, Jr, McCrae RR. NEO-PI-R Professional Manual. Odessa, Fla: PAR; 1992. [Google Scholar]
- 29.Weissman M. The Social Adjustment Scale-Self Report. North Tonawanda, NY: MHS; 1999. [Google Scholar]
- 30.First MB, Spitzer RL, Gibbon M, Williams JBW. Structured Clinical Interview for DSM-IV Axis I Disorders—Nonpatient Edition (SCID-I/NP) New York, NY: Biometrics Research Department; 1995. [Google Scholar]
- 31.Kwapil TR. A longitudinal study of drug and alcohol use by psychosis-prone and impulsive-nonconforming subjects. J Abnorm Psychol. 1996;105:114–123. doi: 10.1037//0021-843x.105.1.114. [DOI] [PubMed] [Google Scholar]
- 32.World Health Organization. International Personality Disorder Examination (IPDE) Manual DSM-IV Module. New York, NY: Cambridge University Press; 1995. [Google Scholar]
- 33.Kety SS, Rosenthal D, Wender PH, Schulsinger F. The types and prevalence of mental illness in the biological and adoptive family members of adopted schizophrenics. In: Rosenthal D, Kety SS, editors. The Transmission of Schizophrenia. Elmsford, NY: Pergamon Press; 1968. [Google Scholar]
- 34.Kendler KS. Familial aggregation of schizophrenia and schizophrenia-spectrum disorders. Evaluation of conflicting results. Arch Gen Psychiatry. 1988;45:377–383. doi: 10.1001/archpsyc.1988.01800280095013. [DOI] [PubMed] [Google Scholar]
- 35.Gottesman II. Schizophrenia genesis: The origins of madness. San Francisco, Calif: Freeman; 1991. [Google Scholar]
- 36.Chapman LJ, Chapman JP. Scales for rating psychotic and psychotic-like experiences as continua. Schizophr Bull. 1980;6:476–489. [PubMed] [Google Scholar]
- 37.Kwapil TR, Chapman LJ, Chapman J. Validity and usefulness of the Wisconsin Manual for rating psychotic-like experiences. Schizophr Bull. 1999;25:363–375. doi: 10.1093/oxfordjournals.schbul.a033384. [DOI] [PubMed] [Google Scholar]
- 38.Kraepelin E. Dementia Praecox and Paraphrenia. Edinburgh, Scotland: Livingstone; 1919. [Google Scholar]
- 39.Bleuler EP. Dementia Praecox or the Group of Schizophrenias. In: Zinkin J, editor. New York, NY: International Universities Press; 1950. [Google Scholar]
- 40.Gillies H. The clinical diagnosis of early schizophrenia. In: Rodger TF, Mabry RM, Roy JR, editors. Topics in Psychiatry. London, UK: Cassell; 1958. pp. 47–56. [Google Scholar]
- 41.Endicott J, Spitzer RL, Fleiss JL, Cohen J. The Global Assessment Scale: a procedure for measuring overall severity of psychiatric disturbance. Arch Gen Psychiatry. 1976;33:766–771. doi: 10.1001/archpsyc.1976.01770060086012. [DOI] [PubMed] [Google Scholar]
- 42.Cohen J. A power primer. Psychol Bull. 1992;112:155–159. doi: 10.1037//0033-2909.112.1.155. [DOI] [PubMed] [Google Scholar]
- 43.Chapman JP, Chapman LJ, Kwapil TR. Scales for the measurement of schizotypy. In: Raine A, Lencz T, Mednick S, editors. Schizotypal Personality Disorder. Cambridge, England: Cambridge University Press; 1995. pp. 79–106. [Google Scholar]
- 44.Chapman LJ, Chapman JP, Miller EN. Reliabilities and intercorrelations of eight measures of proneness to psychosis. J Consult Clin Psychol. 1982;50:187–195. doi: 10.1037//0022-006x.50.2.187. [DOI] [PubMed] [Google Scholar]
- 45.Anderson JC, Gerbing DW. The effect of sampling error on convergence, improper solutions, and goodness-of-fit indices for maximum likelihood confirmatory factor analysis. Psychometrika. 1984;49:55–173. [Google Scholar]
- 46.Bentler PM, Chou CP. Practical issues in structural modeling. Sociol Methods Res. 1987;16:78–117. [Google Scholar]
- 47.Bentler PM, Bonnet DG. Significance tests and goodness of fit in the analysis of covariance structures. Psychol Bull. 1980;88:588–606. [Google Scholar]
- 48.Browne MW, Cudeck R. Alternative ways of assessing model fit. In: Collins LM, Horn JL, editors. Testing Structural Equation Models. Thousand Oaks, Calif: Sage; 1993. pp. 136–162. [Google Scholar]
- 49.Wilcox RR, Muska J. Inferences about correlations when there is heteroscedasticity. Br J Math Stat Psychol. 2001;54:39–47. doi: 10.1348/000711001159410. [DOI] [PubMed] [Google Scholar]
- 50.Raine A, The SPQ. A scale for the assessment of schizotypal personality based on DSM-III-R criteria. Schizophr Bull. 1991;17:555–564. doi: 10.1093/schbul/17.4.555. [DOI] [PubMed] [Google Scholar]
- 51.Claridge G, Broks P. Schizotypy and hemisphere function: I. Theoretical considerations and the measurement of schizotypy. Pers Individ Dif. 1984;8:303–312. [Google Scholar]
- 52.Mason O, Claridge G, Jackson M. New scales for the assessment of schizotypy. Pers Individ Dif. 1995;18:7–13. [Google Scholar]
- 53.Rust J. Handbook of the Rust Inventory of Schizotypal Cognitions. London, UK: PsychCorp; 1989. [Google Scholar]
- 54.Claridge G. Theoretical background issues. In: Claridge G, editor. Schizotypy: Implications for Illness and Health. Oxford, UK: Oxford University Press; 1997. [Google Scholar]
- 55.Lenzenweger MF, Korfine L. Confirming the latent structure and base rate of schizotypy: a taxometric analysis. J Abnorm Psychol. 1992;101:567–571. doi: 10.1037//0021-843x.101.3.567. [DOI] [PubMed] [Google Scholar]
- 56.Lenzenweger MF, McLachlan G, Rubin DB. Resolving the latent structure of schizophrenia endophenotypes using expectation-maximization-based finite mixture modeling. J Abnorm Psychol. 2007;116:16–29. doi: 10.1037/0021-843X.116.1.16. [DOI] [PubMed] [Google Scholar]
- 57.Verdoux H, van Os J, Maurice-Tison S. Increased occurrence of depression in psychosis-prone subjects. Compr Psychiatry. 1999;40:462–468. doi: 10.1016/s0010-440x(99)90091-3. [DOI] [PubMed] [Google Scholar]
- 58.Cardno AG, Marshall EJ, Coid B, et al. Heritability estimates for psychotic disorders: the Maudsley twin psychosis series. Arch Gen Psychiatry. 1999;56:162–168. doi: 10.1001/archpsyc.56.2.162. [DOI] [PubMed] [Google Scholar]
- 59.Ebel H, Gross G, Klosterkotter J, Huber J. Basic symptoms in schizophrenic and affective psychoses. Psychopathology. 1999;22:224–232. doi: 10.1159/000284602. [DOI] [PubMed] [Google Scholar]
- 60.Emsley RA, Oosthuizen PP, Joubert AF, Roberts MC, Stein DJ. Depressive and anxiety symptoms in patients with schizophrenia and schizophreniform disorder. J Clin Psychiatry. 1999;60:747–751. doi: 10.4088/jcp.v60n1105. [DOI] [PubMed] [Google Scholar]
- 61.Costa PT, Jr, Widiger TA. Personality Disorders and the Five-Factor Model of Personality. Washington, DC: American Psychological Association; 1994. [Google Scholar]
- 62.Barrantes-Vidal N. Creativity & madness revisited from current psychological perspectives. J Conscious Stud. 2004;11:58–78. [Google Scholar]
- 63.McCreery C. Hallucinations and arousability: pointers to a theory of psychosis. In: Claridge G, editor. Schizotypy: Implications for Illness and Health. Oxford, UK: Oxford University Press; 1997. [Google Scholar]
- 64.Barrantes-Vidal N, Fañanás L, Rosa A, Caparrós B, Riba MD, Obiols JE. Neurocognitive, behavioural and neurodevelopmental correlates of schizotypy clusters in adolescents from the general population. Schizophr Res. 2003;61:293–302. doi: 10.1016/s0920-9964(02)00321-3. [DOI] [PubMed] [Google Scholar]
- 65.Pope CA, Kwapil TR. Dissociative experiences in hypothetically psychosis-prone college students. J Nerv Ment Dis. 2000;188:530–536. doi: 10.1097/00005053-200008000-00009. [DOI] [PubMed] [Google Scholar]
- 66.Diaz MA, Dickerson LA, Kwapil TR. A two-year follow-up assessment of schizotypic young adults. Schizophr Res. 2003;60:167–168. [Google Scholar]
- 67.Kwapil TR, Crump RA, Pickup DR. Assessment of psychosis proneness in African-American college students. J Clin Psychol. 2002;58:1601–1614. doi: 10.1002/jclp.10078. [DOI] [PubMed] [Google Scholar]
- 68.Eysenck HJ, Eysenck SBG. Manual of the Eysenck Personality Questionnaire. San Diego, Calif: EdITS Publishers; 1975. [Google Scholar]
- 69.Chapman LJ, Chapman JP, Numbers JS, Edell WS, Carpenter BN, Beckfield D. Impulsive nonconformity as a trait contributing to the prediction of psychotic-like and schizotypal symptoms. J Nerv Ment Dis. 1984;172:681–691. doi: 10.1097/00005053-198411000-00007. [DOI] [PubMed] [Google Scholar]
- 70.Chapman JP, Chapman LJ, Kwapil TR. Does the Eysenck Psychoticism Scale predict psychosis: a ten-year longitudinal study. Pers Individ Dif. 1994;17:369–375. [Google Scholar]
- 71.Freeman D, Dunn G, Garety PA. The psychology of persecutory ideation I: a questionnaire survey. J Nerv Ment Dis. 2005;193:302–308. doi: 10.1097/01.nmd.0000161687.12931.67. [DOI] [PubMed] [Google Scholar]
- 72.Fenigstein A, Vanable PA. Paranoia and self-consciousness. J Pers Soc Psychol. 1992;62:129–138. doi: 10.1037//0022-3514.62.1.129. [DOI] [PubMed] [Google Scholar]
- 73.McGlashan TH, Miller TJ, Woods SW, Rosen JL, Hoffman RE, Davidson L. Structured Interview for Prodromal Syndromes. New Haven, Conn: Yale School of Medicine; 2001. [Google Scholar]
- 74.Clinic Pace. Comprehensive Assessment of At Risk Mental States (CAARMS) Melbourne, Australia: University of Melbourne; 2000. [Google Scholar]