

Abstract
In this work we investigate how the intrinsic spatial resolution varies with the number of digitized readout channels for a 64 (8×8) channel detector using a statistics-based positioning algorithm. We report results for both 6 mm and 8 mm thick crystals. Three channel reduction schemes are explored. The simplest scheme is row and column summing (R-C sum) of the photomultiplier tube channels. The second method is to only use channels with signals above a 1% threshold of the total signal (1% thres). The third method is to acquire a subset of PMT channels determined by the maximum signal channel (zone mask). The full width at half maximum (FWHM) intrinsic spatial resolution results for the central and corner sections of the detector are presented for each of the methods. All methods except R-C sum performed well for the central section of the detector. The 1% thres and zone mask schemes showed significant improvement for the corner section of the 6 mm thick crystal. All methods using a single depth look-up table had difficulty in the corner region for the 8 mm thick crystal. We believe this is caused by depth dependent edge effects on the light response function. Initial results using a depth dependent look-up table show improved positioning performance.
Keywords: Continuous crystal, high spatial resolution, PET detector, statistics-based positioning
I. Introduction
DISCRETE crystal detector modules have traditionally been used to achieve high spatial resolution for small animal positron emission tomography (PET) scanners [1]–[8]. However, cost goes up considerably as one uses smaller and smaller cross-section crystals. We have previously investigated a continuous miniature crystal element (cMiCE) detector composed of a 50 mm by 50 mm by 8 mm thick slab of LYSO coupled to a 52 mm square, 64-channel flat panel photomultiplier tube (PMT, Hamamatsu H8500, Japan) as a lower cost alternative to high resolution discrete crystal designs [9]. A statistics based positioning (SBP) algorithm [10], similar to previously proposed Maximum-likelihood (ML) methods [11]–[13], is used which improves the positioning characteristics of the detector versus using standard or modified Anger positioning schemes. This improvement is most dramatic near the edges and corners of the crystal.
The goal of this work is to investigate the intrinsic spatial resolution of a detector module using our SBP method, as the number of readout channels is reduced. Three channel reduction schemes are explored. The simplest scheme is row and column summing (R-C sum) of the PMT channels. This reduces the number of PMT channels that need to be digitized from 64 down to 16. The second method is to only use channels with signals above a 1% threshold of the total signal (1% thres). The third method is to acquire a subset of PMT channels determined by the maximum signal channel (zone mask). For the latter two methods, it is likely that all 64 channels will still need to be digitized; however, each of the approaches may lead to better intrinsic spatial resolution, as well as faster event processing.
II. Materials and Methods
A. cMiCE Detector Assembly and Data Acquisition
Two cMiCE detectors were evaluated in this work. The first detector was composed of a 50 mm by 50 mm by 6 mm thick Lu1.8 Y.2 SiO5 :Ce (LYSO) crystal (Saint Gobain, Newbury, Ohio) coupled to a 52 mm square, 64-channel flat panel PMT (Hamamatsu H8500, Japan). The two 50 mm by 50 mm surfaces of the crystal were polished and the four 6 mm by 50 mm surfaces of the crystal were roughened. The 50 mm by 50 mm entrance surface of the crystal (i.e., surface opposite the PMT) was painted with white latex paint and the 6 mm by 50 mm side surfaces were painted with black latex paint. The crystal was coupled to the PMT with BC-630 optical grease (Saint Gobain, Newbury, Ohio). The second detector was composed of a 50 mm by 50 mm by 8 mm thick LYSO crystal (Saint Gobain, Newbury, Ohio) coupled to a 52 mm square, 64-channel flat panel PMT (Hamamatsu H8500, Japan). Along with being thicker, one of the 50 mm by 50 mm surfaces was roughened. The roughened surface was positioned opposite the PMT and painted with white latex paint. The side surfaces and optical coupling between the crystal and PMT were the same as the 6 mm thick crystal. A sample detector module is pictured in Fig. 1. Preliminary results (not shown) using a 50 mm by 50 mm by 8 mm thick crystal with both large area sides polished were also acquired. However, the intrinsic spatial resolution performance was slightly better for the crystal with the one large area surface roughened.
Fig. 1.
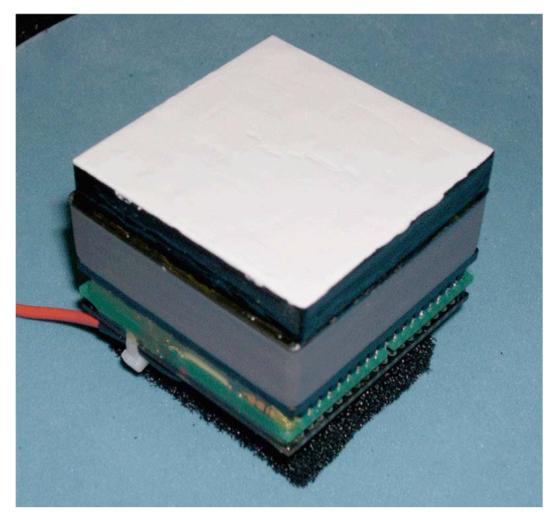
Picture of cMiCE detector with 6 mm thick LYSO crystal and white paint.
All 64 channels from the multi-anode, flat panel PMT were acquired for each coincidence event. Two 32-channel analog to digital converter (ADC) cards (N792 ADCs, CAEN, Italy) were used as part of a VME data acquisition system. The VME crate was connected to an Apple computer running OS X and the Orca software package [14] using a VME-PCI adapter card.
B. Statistics-based Positioning Method (SBP)
Suppose the distributions of observing PMT outputs M = M1, M2,..., Mn for scintillation position x, are independent normal distributions with mean, μ(x), and standard deviation σ(x).
The likelihood function for making any single observation mi from distribution Mi given x is:
| (1) |
The maximum likelihood estimator of the event position x is given by:
| (2) |
The SBP method requires that the light response function versus interaction location be characterized for the detector. Two SBP look-up tables (LUTs) corresponding to the mean and variance of the light probability density function (PDF) versus (x,y) position are created during the characterization process.
In addition to creating two-dimensional (i.e., x,y) LUTs, we have developed a Maximum-likelihood-based method for building LUTs with some depth of interaction (DOI) discrimination. The method to separate the data into different depth regions is described in [15]. After the data are sorted, SBP LUTs are generated for each depth region and the maximum likelihood estimator for event positioning is utilized as described above.
C. Reduced Readout Channel Implementations
Three channel reduction schemes are explored. All methods are implemented in software (i.e., all 64 channels are collected for each event). The simplest scheme is row and column summing (R-C sum) of the PMT channels. Since the PMT consists of an 8 by 8 array of anodes, row-column summing reduces the number of PMT channels that would need to be digitized from 64 down to 16. In our implementation we did gain balancing of the signals, based upon the manufacturer provided channel gains, prior to summing. The second method is to only use channels with signals above a 1% threshold of the total signal (1% thres). Again the channel signals were normalized prior to the threshold being applied. The third method is to acquire a subset of PMT channels determined by the maximum signal channel (zone mask). Three different zone masks were investigated (i.e., 9, 13, and 21 channel). They are illustrated in Fig. 2. For the latter two methods, it is likely that all 64 channels will still need to be digitized; however, each of the approaches may lead to better intrinsic spatial resolution, as well as faster event processing due to the reduction in the number of channels utilized for positioning. All 64 channels were summed for energy windowing for all positioning schemes used. A 400 keV lower energy threshold was applied to the data.
Fig. 2.
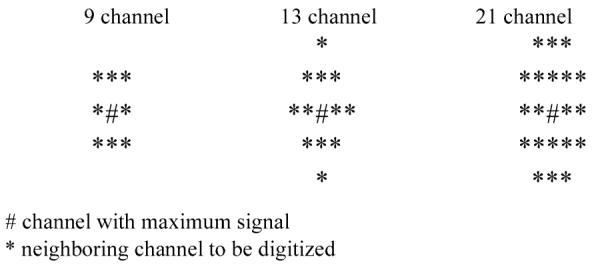
A mask around the central maximum channel is used to determine which channels to use for positioning. 9, 13 and 21 channel masks are shown.
In addition to the reduced readout channel implementations, we also did positioning using standard and 21 channel zone-based Anger positioning. We also did positioning using 64 channel, two depth DOI LUTs for the 8 mm thick crystal.
D. Detector Calibration and Testing
Just over one fourth of each of the cMiCE detector modules was characterized using a focused point flux perpendicular to the front surface of the crystal, as illustrated in Fig. 3. The point flux was produced using a 0.25 mm diameter Na-22 point source in coincidence with a 2 mm by 2 mm cross-section detector. The coincidence detector was placed at a distance to create a point spot flux on the surface of the crystal with a calculated full width at half maximum (FWHM) of 0.52 mm. The coincidence point flux assembly was mounted on a computerized, two axis linear stage for detector characterization. LUTs of the mean and variance of the light probability density function for each channel versus spot position were generated to characterize the detector. Data were collected using 0.95 (1.0) mm steps in both the X and Y directions, for the 6 (8)mm thick crystal. The LUTs were then interpolated into 0.225 (0.25) mm bins using spline interpolation.
Fig. 3.
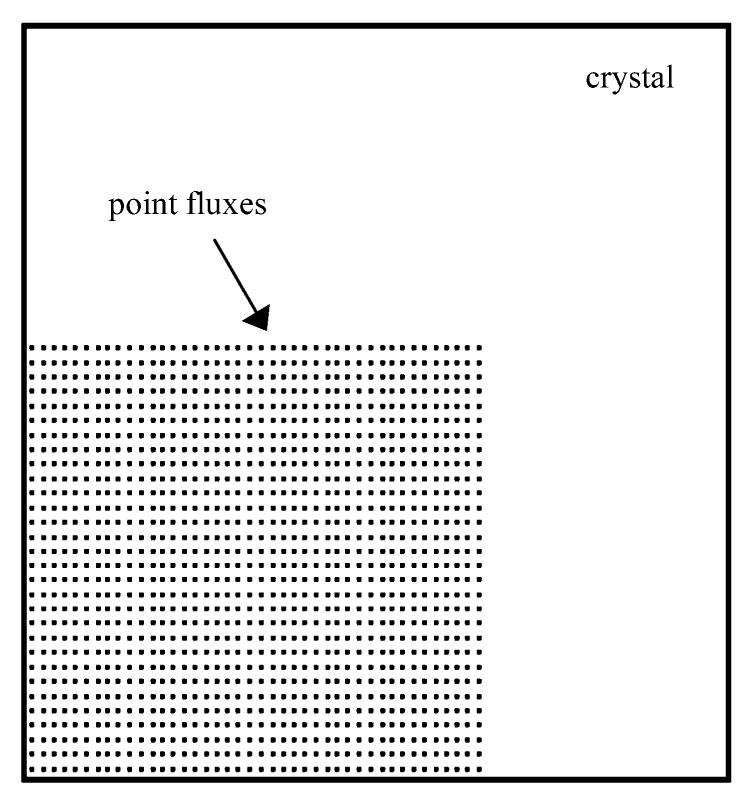
Illustration of locations of point fluxes on surface of 50 mm by 50 mm by 6 (8) mm LYSO crystal for LUT generation. The crystal is represented by the square.
The intrinsic spatial resolution of the detector was evaluated for the central region of the detector (i.e., a 13 by 13 array of points for the 6 mm thick crystal and a 13 by 11 array of points for the 8 mm thick crystal) and for the corner region of the detector (i.e., 11 by 11 array of points).
III. Results
A sample point response function for a 6 mm thick crystal is illustrated in Fig. 4. The measured FWHM of the response function is 1.1 mm. To better view the intrinsic spatial resolution results for a two-dimensional array of point fluxes, we chose to show the results as contour plots representing the FWHM of the point fluxes. The results for the 6 mm thick crystal are illustrated in Fig. 5. The results for the 8 mm thick crystal are illustrated in Fig. 6. For display purposes, a subset of contours (i.e., with ∼2mm spacing in x and y) is displayed in the figures.
Fig. 4.
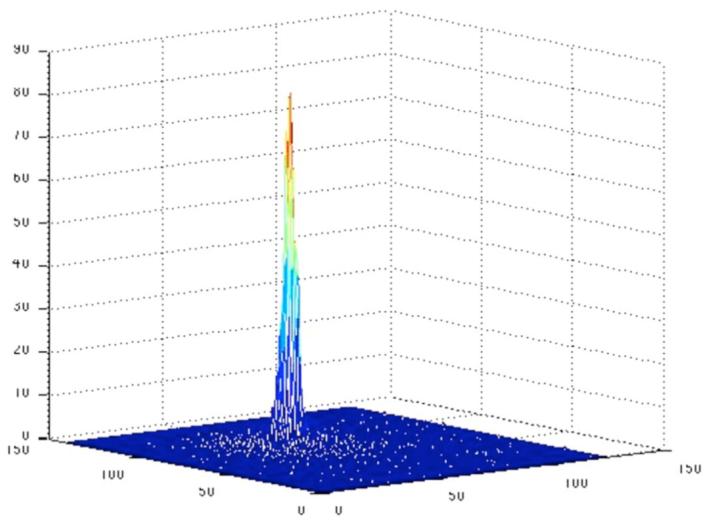
Two-dimensional surface plot of 64-channel SBP results for 6 mm thick crystal. FWHM of the illustrated point response is 1.1 mm.
Fig. 5.

Contour plots illustrating the FWHM of the point fluxes with 1.9 mm center-to-center spacing to within ∼3.5 mm of the edge of the 6 mm thick crystal detector. (a) 64 channel; (b) 21 channel mask; (c) 13 channel mask; (d) 9 channel mask; (e) 1% energy threshold; (f) row-column summing; (g) standard Anger; (h) 21 channel mask Anger.
Fig. 6.

Contour plots illustrating the FWHM of the point fluxes with 2.0 mm center-to-center spacing to within ∼3.5 mm of the edge of the 8 mm thick crystal detector. (a) 64 channel; (b) 21 channel mask; (c) 13 channel mask; (d) 9 channel mask; (e) 1% energy threshold; (f) row-column summing; (g) standard Anger; (h) 64 channel, dual-depth of interaction look-up table.
The intrinsic spatial resolution values averaged over all points in the center and corner regions for the 6 and 8 mm thick crystals are listed in Tables I and II. Note that these results are not adjusted for the size of the point flux. The standard deviation of the intrinsic spatial resolution for all the points in each region is also provided.
TABLE I.
6 mm Thick LYSO Crystal Results (To Within ∼3.5 mm of the Crystal Edge)
| Method | Section | X FWHM (mm) |
Y FWHM (mm) |
|---|---|---|---|
| 64 channel | center | 1.22±0.15 | 1.18±0.16 |
| corner | 1.42±0.30 | 1.40±0.29 | |
| 21 channel | center | 1.19±0.12 | 1.17±0.12 |
| mask | corner | 1.42±0.22 | 1.37±0.23 |
| 13 channel | center | 1.23±0.13 | 1.20±0.13 |
| mask | corner | 1.41±0.22 | 1.37±0.22 |
| 9 channel | center | 1.41±0.24 | 1.36±0.23 |
| mask | corner | 1.43±0.28 | 1.40±0.29 |
| 1% thres | center | 1.21±0.14 | 1.16±0.17 |
| corner | 1.38±0.23 | 1.37±0.23 | |
| R-C sum | center | 1.25±0.19 | 1.23±0.25 |
| corner | 1.50±0.38 | 1.44±0.34 | |
| Standard | center | 1.24±0.09 | 1.23±o.12 |
| Anger | corner | - | - |
| Anger | center | 1.47±0.11 | 1.45±0.13 |
| (21 channels) | corner | - | - |
TABLE II.
8 mm Thick LYSO Crystal Results (To Within ∼3.4 mm of the Crystal Edge)
| Method | Section | X FWHM (mm) |
Y FWHM (mm) |
|---|---|---|---|
| 64 channel | center | 1.30±0.16 | 1.35±0.13 |
| corner | 1.49±0.48 | 1.62±0.47 | |
| 21 channel | center | 1.32±0.12 | 1.30±0.12 |
| mask | corner | 1.53±0.41 | 1.58±0.42 |
| 13 channel | center | 1.38±0.15 | 1.37±0.12 |
| mask | corner | 1.57±0.42 | 1.61±0.48 |
| 9 channel | center | 1.46±0.19 | 1.44±0.19 |
| mask | corner | 1.55±0.41 | 1.57±0.41 |
| 1% thres | center | 1.29±0.33 | 1.32±0.12 |
| corner | 1.42±0.64 | 1.60±0.45 | |
| R-C sum | center | 1.35±0.33 | 1.40±0.22 |
| corner | 1.41±0.73 | 1.69±0.65 | |
| Standard | center | 1.35±0.10 | 1.37±0.10 |
| Anger | corner | - | - |
| 2 depth LUT | center | 1.27±0.11 | 1.30±0.09 |
| corner | 1.47±0.43 | 1.51±0.59 |
The intrinsic spatial resolution for the corner section of the crystal includes data points to within ∼3.5 mm of the crystal’s edge. For some points near the edge of the crystal, the positioning performance degrades and the contours become very irregular. Therefore the corner section average results are difficult to interpret just using the values listed in Tables I and II. To get a more complete understanding of the positioning performance, it is important to look also at the contour plots where the uniformity of response is easier to visualize.
IV. Discussion
All positioning methods worked well for the central section of the crystal except row-column summing. While the average intrinsic spatial resolution using row-column summing was similar to the other methods, the variability in the intrinsic spatial resolution versus location was larger as illustrated in the contour plots.
The positioning performance degraded for both the 6 mm and 8 mm thick crystal detectors near the corner of the detector. This is because of truncation of the light signal as well as other effects. Intrinsic spatial resolution was improved using a channel mask or 1% signal threshold for the 6 mm thick crystal. A similar improvement was not observed for the 8 mm thick crystal; however, using a 64 channel, 2-depth DOI LUT for positioning significantly improved the intrinsic spatial resolution. A discussion of each of these results is provided.
Reducing the number of readout channels via thresholding or using a channel mask improved the positioning performance, especially for the corner section of the 6 mm thick detector. For Anger positioning applying a mask or a threshold improves positioning performance by eliminating very noisy channels from the position calculation. For SBP positioning, we believe that the main reason we are seeing improved performance is because of a mismatch between the true light response PDF and our model, which assumes a Gaussian distribution. Because of depth of interaction effects the PDFs for PMT channels near the point of interaction are usually skewed [15]. Therefore the variance of the signal for a given mean value is greater than it would be for a normal distribution. On the other hand, the measured signals for channels distant from the point of interaction are not depth dependent and so their PDFs are more symmetric and better match the Gaussian model. From (2), a larger variance tends to decrease the weight a given signal has on the position estimate. Therefore when using all PMT channels, channels far from the point of interaction (i.e., with the least amount of spatial information) can have a greater weight on positioning than the channels closest to the point of interaction (i.e., which should have the most spatial information). On the other hand if the number of channels used gets too small, too much of the tails of the light distribution function gets truncated and the intrinsic spatial resolution also degrades.
All of the single depth LUT methods had difficulty in the corner region of the 8 mm thick crystal. We believe that this is because edge effects enhance the depth dependence of the light response function. The positioning performance for the 8 mm thick crystal was significantly improved using the dual-depth LUT. As further work we will investigate whether additional improvements can be achieved using a channel mask or thresholding along with a dual-depth LUT.
As previously stated, an added benefit of using the zone mask or 1% threshold methods is faster processing time. The relative event processing times for the different channel reduction techniques versus using all 64 signal channels are listed in Table III. The data were processed on an iMac with a 2 GHz G5 processor using Matlab and C++. An exhaustive search routine was used for position determination and the code was not optimized for speed. We have previously benchmarked our positioning algorithm using all 64 signal channels with a three step hierarchical search written in C++. That code was optimized and ran on a PC with a 3.2 GHz Pentium4 processor. Using this optimized implementation, it required 0.14 seconds to position 40 000 events.
TABLE III.
Relative Processing Times for Various Channel Reduction Schemes
| Method | Relative Processing Time |
|---|---|
| 64 channel | 1.0 |
| 21 channel mask | 0.56 |
| 13 chennel mask | 0.45 |
| 9 chennel mask | 0.39 |
| 1% threshold | 0.60 |
| R-C sum | 0.23 |
In this work, the LUTs were obtained by measurements with a step size of ∼1 mm in both x and y directions. The data were then interpolated to ∼0.25 mm bins. Using a sampling interval of 1 mm in both x and y will require ∼2500 points to fully characterize the light response function for the detector. If the sampling interval is increased to 2 mm in each direction, the number of sample points required decreases by a factor of 4. In addition, if multiple point fluxes can be acquired simultaneously the number of data sets required to characterize the detector can be further decreased. We have built a multi-source calibration device and are currently assessing how many point fluxes can be used in the calibration procedure. We are also investigating what sampling interval is required to accurately characterize the detector’s light response function. Preliminary results indicate that for the central section of the detector 2 mm sampling will provide similar intrinsic spatial resolution positioning as 1 mm sampling. However, 2 mm sampling is too coarse for the corner sections of the crystal. Thus we are investigating methods to optimize the characterization of our cMiCE detectors both in terms of time to calibrate the detector and positioning performance.
While the 6 mm thick LYSO detector has better intrinsic spatial resolution performance, the advantage of using an 8 mm thick LYSO detector is an increase in coincidence detection efficiency of about 60%. This is a significant gain in detection efficiency for a relatively small sacrifice in intrinsic spatial resolution (i.e., 0.1 mm). While the optimum choice of the detector is mostly likely going to be task dependent, we are very encouraged by the performance of the 8 mm thick crystal detector when used with the dual-depth LUTs.
V. Conclusion
In summary, using a reduced number of PMT channels (i.e., zone mask or channel threshold) for event positioning provided equivalent or slightly better intrinsic spatial resolution results for our cMiCE detector. Reducing the number of channels used for positioning will also have a positive benefit on the event processing bandwidth of the system. Unfortunately, row-column summing did not work well. For the 8 mm thick crystal detector using a dual-depth, empirically derived LUT significantly improved resolution performance for the corner section of the crystal. Thus our dual-depth cMiCE detector implementation will provide improved detector positioning performance as well as improved system characteristics by reducing parallax errors resulting from DOI effects in the detectors.
Acknowledgments
This work was supported in part by NIH-NIBIB Grants R21/R33 EB001563 and R01 EB002117.
Footnotes
Color versions of one or more of the figures in this paper are available online at http://ieeexplore.ieee.org.
References
- [1].Cherry SR, Shao Y, Silverman RW, et al. MicroPET: A high resolution PET scanner for imaging small animals. IEEE Trans. Nucl. Sci. 1997 Jun.44(3):1161–1166. [Google Scholar]
- [2].Tai YC, Chatziioannou AF, Yang Y, et al. MicroPET II: Design, development, and initial performance of an improved microPET scanner for small animal imaging. Phys. Med. Biol. 2003;48:1519–1537. doi: 10.1088/0031-9155/48/11/303. [DOI] [PubMed] [Google Scholar]
- [3].Seidel J, Vaquero JJ, Green MV. Resolution uniformity and sensitivity of the NIH ATLAS small animal PET scanner: Comparison to simulated LSO scanners without depth-of-interaction capability. IEEE Trans. Nucl. Sci. 2003 Oct.50(5):1347–1350. [Google Scholar]
- [4].Surti S, Karp JS, Perkins AE, Freifelder R, Muehllehner G. Design evaluation of A-PET: A high sensitivity animal PET camera. IEEE Trans. Nucl. Sci. 2003 Oct.50(5):1357–1363. [Google Scholar]
- [5].Rouze NC, Schmand M, Siegel S, Hutchins GD. Design of a small animal PET imaging system with 1 microliter volume resolution. IEEE Trans. Nucl. Sci. 2004 Jun.51(3):757–763. [Google Scholar]
- [6].Ziemons K, Auffray E, Barbler R, et al. The ClearPET project: Development of a 2nd generation high-performance small animal PET scanner. Nucl. Instrum. Methods Phys. Res. A. 2005;A537:307–311. [Google Scholar]
- [7].DelGuerra A, Domenico G, Scandola M, Zavattini G. YAPPET: First results of a small animal positron emission tomograph based on YAP:Ce finger crystals. IEEE Trans. Nucl. Sci. 1998 Dec.45(6):3105–3108. [Google Scholar]
- [8].Miyaoka RS, Janes ML, Lee K, Park B, Kinahan PE, Lewellen TK. Development of a single detector ring micro crystal element scanner (MiCES): QuickPET II. Mol. Imag. 2005;4:117–127. doi: 10.1162/15353500200504154. [DOI] [PubMed] [Google Scholar]
- [9].Ling T, Lee K, Miyaoka RS. Performance comparisons of continuous miniature crystal element (cMiCE) detectors. IEEE Trans. Nucl. Sci. 2006 Oct.53(5):2513–2518. [Google Scholar]
- [10].Joung J, Miyaoka RS, Lewellen TK. cMiCE: A high resolution animal PET using continuous LSO with a statistics based positioning scheme. Nucl. Instrum. Methods Phys. Res. A. 2002 Aug.A489(1–3):584–589. [Google Scholar]
- [11].Milster TD, Aarsvold JN, Barrett HH, et al. A full-field modular gamma camera. J. Nucl. Med. 1990 May;31(5):632–639. [PubMed] [Google Scholar]
- [12].Gray RM, Macovski A. Maximum a posteriori estimation of position in scintillation cameras. IEEE Trans. Nucl. Sci. 1976 Feb.NS-23(1):849–852. [Google Scholar]
- [13].Clinthorne NH, Rogers WL, Shao L, Koral KF. A hybrid maximum likelihood position computer for scintillation cameras. IEEE Trans. Nucl. Sci. 1987 Feb.NS-34(1):97–101. [Google Scholar]
- [14].Howe MA, Cox GA, Harvey PJ, McGirt F, Rielage K, Wilkerson JF, Wouters JM. Sudbury neutrino observatory neutral current detector acquisition software overview. IEEE Trans. Nucl. Sci. 2004 Jun.51(3):878–883. [Google Scholar]
- [15].Ling T, Lewellen TK, Miyaoka RS. Depth of interaction decoding for a continuous crystal detector. Phys. Med. Biol. 2007 Apr.52:2213–2228. doi: 10.1088/0031-9155/52/8/012. [DOI] [PubMed] [Google Scholar]