

Abstract
Helminth infections are of significant concern in veterinary and human medicine. The drugs available for chemotherapy are limited in number and the extensive use of these drugs has led to the development of resistance in parasites of animals and humans (Geerts and Gryseels, 2000; Kaplan, 2004; Osei-Atweneboana et al., 2007). The cyclooctadepsipeptide, emodepside, belongs to a new class of anthelmintic that has been released for animal use in recent years. Emodepside has been proposed to mimic the effects of the neuropeptide PF1 on membrane hyperpolarization and membrane conductance (Willson et al., 2003). We investigated the effects of PF1 on voltage-activated currents in Ascaris suum muscle cells. The whole cell voltage-clamp technique was employed to study these currents. Here we report two types of voltage-activated inward calcium currents: transient peak (Ipeak) and a steady-state (Iss). We found that 1 μM PF1 inhibited the two calcium currents. The Ipeak decreased from −146 nA to −99 nA (P = 0.0007) and the Iss decreased from −45 nA to −12 nA (P = 0.002). We also found that PF1 in the presence of calcium increased the voltage-activated outward potassium current (from 521 nA to 628 nA (P = 0.004)). The effect on the potassium current was abolished when calcium was removed and replaced with cobalt; it was also reduced at a higher concentration of PF1 (10 μM). These studies demonstrate a mechanism by which PF1 decreases the excitability of the neuromuscular system by modulating calcium currents in nematodes. PF1 inhibits voltage-activated calcium currents and potentiates the voltage-activated calcium-dependent potassium current. The effect on a calcium-activated-potassium channel appears to be common to both PF1 and emodepside (Guest et al., 2007). It will be of interest to investigate the actions of emodepside on calcium currents to further elucidate the mechanism of action.
Keywords: PF1, AF3, Ascaris suum, Voltage-activated currents, Calcium currents, Potassium currents
1. Introduction
There is a group of 13 parasitic and bacterial infectious diseases listed as neglected tropical diseases in the Millennium Declaration of the United Nations (Hotez et al., 2007). Ascariasis is the most common parasitic infection in the list, with an estimated 807 million people infected and 4.2 billion people at risk (de Silva et al., 2003; Bethony et al., 2006). Helminth infections are also a welfare and economic concern in animals (Coles, 2001; Wolstenholme et al., 2004).
Chemotherapy is widely used to control these parasitic infections. The drugs available for chemotherapy are limited in number and the extensive use of these drugs has led to the development of resistance in parasites of animals and humans (Geerts and Gryseels, 2000; Kaplan, 2004; Osei-Atweneboana et al., 2007). The cyclooctadepsipeptide, emodepside, belongs to a new class of anthelmintic that has been released for animal use in recent years (Harder et al., 2003). Emodepside has been proposed to mimic the effects of PF1 (Willson et al., 2003), an inhibitory FMRFamide like neuropeptide (FLP) in nematodes (McVeigh et al., 2006).
FLPs have been isolated from both free living and parasitic nematodes (Geary et al., 1992, 1999; Husson et al., 2005; Li, 2005; McVeigh et al., 2006). There are more than 31 nematode flp genes that have been identified and found responsible for the synthesis of more than 90 FLPs (McVeigh et al., 2005). FLPs are associated with all the major neuronal systems in nematodes (Stretton et al., 1991; Brownlee et al., 1996; Brownlee and Walker, 1999; Geary and Kubiak, 2005). PF1 (SDPNFLRFamide) is a peptide that was originally isolated from an acetone extract of Panagrellus redvivius (Geary et al., 1992). PF1 has marked paralytic and hyperpolarizing effects on Ascaris suum muscles (Franks et al., 1994; Bowman et al., 2002). Although PF1 has not been recovered from A. suum, Yew et al. (2005) have isolated related peptides with the C-terminal PNFLRFamide from A. suum. PF1 has been reported to antagonize the effects of acetylcholine and levamisole induced contractions (Franks et al., 1994; Geary et al., 1999). The effects of PF1 appear to be mediated by nitric oxide in A. suum (Bowman et al., 1995). The hyperpolarizing effect of PF1 is abolished by a combination of potassium channel antagonists and nitric oxide synthase (NOS) inhibitors. It has been shown that nematode NOS is partially dependent on calmodulin and completely dependent on calcium (Bowman et al., 1995, 2002). These effects suggest a role for calcium for the mode of action of PF1.
Voltage-gated calcium channels play a major part in regulation of calcium entry from extracellular sources in nematodes (Jeziorski et al., 2000). Entry of calcium through ion channels plays an important role in the physiological processes of contraction, secretion, synaptic transmission and signal transduction pathways (Catterall et al., 2005). Voltage-gated calcium channels are modulated positively and negatively by G-protein coupled receptors in many species (Tedford and Zamponi, 2006) including neuropeptide receptors in A. suum (Verma et al., 2007).
In this manuscript we investigate the effects of PF1 on voltage-activated calcium and potassium currents in A. suum muscle cells. We found that PF1 reduced peak and steady-state inward calcium currents as well as increased voltage-activated potassium currents. These observations show that the inhibitory effects of PF1 also include effects on voltage-activated calcium currents. If PF1 does in fact mimic emodepside (Willson et al., 2003), our observations suggest that emodepside will also affect voltage-activated calcium and potassium currents (Guest et al., 2007).
2. Materials and methods
2.1. Collection of worms
Adult A. suum were obtained weekly from the Tyson’s pork packing plant at Storm Lake City, Iowa, USA. Worms were maintained in Locke’s solution (Composition (mM): NaCl 155, KCl 5, CaCl2 2, NaHCO3 1.5 and glucose 5) at a temperature of 32 °C. The Locke’s solution was changed daily and the worms were used within 4 days of collection.
2.2. Muscle preparation
One cm muscle tissue flaps were prepared by dissecting the anterior part of the worm, 2–3 cm caudal to the head. A body muscle flap preparation was then pinned onto a Sylgard™-lined 2 ml Petri-dish. The intestine was removed to expose the muscle cells (Trailovic et al., 2005). The preparation was continuously perfused, unless otherwise stated, with APF-Ringer solution, composition (mM): NaCl 23, Na-acetate 110, KCl 24, CaCl2 6, MgCl2 5, glucose 11, and HEPES 5; NaOH was used to adjust the pH to 7.6. To study inward currents calcium-Ringer solution was prepared by adding 4-aminopyridine (4-AP) (5 mM) to APF-Ringer solution to reduce potassium currents and adjusting the pH to 7.6 by NaOH. The preparation was maintained in the experimental chamber at 34 °C using a Warner heating collar (DH 35) and heating the incoming perfusate with a Warner instruments (SH 27B) in-line heating system (Hamden, CT, USA). The perfusate was applied at 4–6 ml/min through a 19-gauge needle placed directly over the muscle bag recorded from. The calcium substitution experiments were conducted using cobalt-Ringer, composition (mM): NaCl 23, Na-acetate 110, KCl 24, CoCl2 6, MgCl2 5, glucose 11, HEPES 5 and 4-aminopyridine 5; NaOH was used to adjust the pH to 7.6. PF1 (1 μM) and AF3 (1 μM), were applied in APF-Ringer, calcium-Ringer or cobalt-Ringer as described in Section 3.
2.3. Electrophysiology
Two-micropipette voltage-clamp and current-clamp techniques were employed to examine the electrophysiological effects in the A. suum muscle bag region (Fig. 1A). Borosilicate capillary glass (Harvard Apparatus, Holliston, MA, USA) micropipettes were pulled on a Flaming Brown Micropipette puller (Sutter Instrument Co., Novato, CA, USA) and filled with 3 M potassium acetate or a mixture of 1.5 M potassium acetate and 1.5 M cesium acetate. The cesium acetate was included in the pipette solution to block outward potassium currents when recording calcium currents. Current-clamp micropipettes and the voltage-sensing micropipettes for voltage-clamp had a resistance of 20–30 MΩ; the current-injecting micropipette for voltage-clamp had a resistance of 3–4 MΩ. The recordings were obtained by impaling the bag region of the A. suum muscle with both micropipettes. All experiments were performed using an Axoclamp 2B amplifier, a 1320A Digidata interface and pClamp 8.2 software (Molecular Devices, Sunnyvale, CA, USA). All data were displayed and analysed on a Pentium IV-based desktop computer.
Fig. 1.

Ascaris suum muscle bag preparation for recording current-clamp and voltage-clamp experiments. (A) Diagram of the location of two micropipettes for making current-clamp and voltage-clamp recordings from bag region of A. suum somatic muscle. The current-injecting pipette and the voltage-sensing pipette are shown. (B) Current-clamp recording showing 40 nA, 0.5 s, current pulses (upper trace) inducing change in membrane potential (lower trace). (C) Voltage-clamp recording showing depolarising step-voltage from a holding potential of −35 mV to 0 mV (upper trace) producing a current response (leak subtracted lower trace). Note the presence of the voltage-activated transient inward current (Ipeak) and a sustained inward current (Iss).
Current-clamp experiments were performed by injecting a hyperpolarizing pulse of 40 nA for 500 ms at 0.30 Hz through the current-injecting micropipette and the voltage sensing micropipette recorded the change in membrane potential (Fig. 1B). Each set of experiments was repeated on preparations from separate worms to get the desired number of observations.
For voltage-clamp, we kept the resistance of the current-injecting micropipette low (3–4 MΩ) and the amplifier gain high (>100). The phase lag was set to 1.5 ms in all the experiments to limit oscillation. In addition, muscles closer to the nerve cord were selected for experimental study, as these were spherical cells with short arms which help to keep the space clamp effective. Muscle cells close to the nerve cord were also found to possess consistently bigger calcium currents.
For activation of calcium currents, muscle cells were held at −35 mV during the voltage-clamp experiments and stepped through a series of voltage-steps of 5 mV each: to −25 mV, −20 mV, −15 mV, −10 mV, −5 mV, 0 mV, +5 mV, +10 mV, +15 mV, and +20 mV (Fig. 1C) and lasted 40 ms. The currents displayed were leak-subtracted, by steps 1/10th of the test step with opposite polarity, using pClamp 8.2 software. The inward calcium currents were recorded at the peak (Ipeak) of the currents and the steady-state currents were recorded as an average at 25, 30, and 35 ms. Potassium currents were recorded as an average of the current values at 20, 35, and 40 ms for +20 mV voltage step in the plateau phase.
Drugs were applied initially under current-clamp before effects on voltage-activated currents were tested under voltage-clamp. Cells with uniform membrane potentials more negative than −25 mV over a period of 40 min and resting conductance of less than 2.5 μS over the course of an experiment were selected for the voltage-clamp and current-clamp studies.
We used linear regression and extrapolation to estimate the reversal potential for different experiments. Then we calculated conductance changes from the inward currents and driving forces (Erev−V) to obtain the activation curve (Verma et al., 2007). The activation curve was then fitted by the Boltzmann equation.
2.4. Drugs
PF1 (SDPNFLRFamide) and AF3 (AVPGVLRFamide) (98% purity, EZBiolab, Westfield, IN) 10 mM stock solutions were prepared in double distilled water every week and kept in Ependorf tubes at −12 °C. PF1 and AF3 stock solutions were thawed just before use to make up the 1 μM or 10 μM working solutions. All other chemicals were obtained from Sigma–Aldrich, St. Louis, MO.
2.5. Statistical analysis
Currents were plotted against the step potential to determine current–voltage relationships. All the statistical analysis was done using Graph Pad Prism software (version 4.0, San Diego, CA, USA). Paired t-tests were employed to test the statistical significance of the change in current responses in control and test recordings; significance levels were set at P < 0.05.
3. Results
3.1. Hyperpolarizing effect of PF1
Fig. 2A shows a typical recording of the effects of PF1 on membrane potential and input conductance; in this cell the resting membrane potential was −32 mV and input conductance was 2.3 μS. Application of 1 μM PF1 produced a hyperpolarization of 5 mV and conductance increase of 0.1 μS. The effect did not wash off within 25 min.
Fig. 2.

Effect of PF1 under current-clamp. (A) Representative trace showing change in membrane potential record of somatic muscle cells in current clamp before, during and after application of PF1 (1 μM). (B) Bar chart of the mean ± standard error of the mean membrane potential responses observed from different preparations. There was a significant hyperpolarization after PF1 application under all experimental conditions; the comparisons were made between the membrane potential before and after application of PF1 under different conditions. The comparison of responses between different conditions was not significant. PF1 (1 μM, n = 6) −5.0 ± 0.8 mV; PF1 (10 μM, n = 6) −6.25 ± 0.7 mV; PF1 (1 μM, n = 5) in the presence of cobalt (6 mM) −6.4 ± 1.0 mV and PF1 (1 μM, n = 10) in presence of 4-AP (5 mM) −3.2 ± 0.4 mV, respectively. (paired t-test, **P ≤ 0.01, *P ≤ 0.05).
Similar results were obtained in a total of seven preparations. Fig. 2B summarises the effects on membrane potential. The effect of 1 μM PF1 on membrane potential was statistically significant and the mean hyperpolarization was 5.0 ± 0.8 mV (P = 0.004). When we applied a higher concentration of PF1 (10 μM), the mean hyperpolarizing effect on membrane potential was 6.2 ± 0.7 mV (n = 6).
Previous studies (Maule et al., 1995; Walker et al., 2000) have suggested that PF1 mediates its effects on membrane potential via a potassium conductance. We tested the effects of a high concentration of 4-AP. We found (Fig. 2B) that 5 mM 4-AP reduced but did not abolished the effects of 1 μM PF1 on membrane potential: 3.0 ± 0.4 mV (P = 0.01, n = 11). However, 4-AP does not block all types of potassium channels in A. suum (Martin et al., 1992). In order to further investigate the effects of PF1 we pursued our investigation of effects of PF1 on voltage-activated currents using voltage-clamp.
3.2. Effects of PF1 on voltage-activated potassium and calcium currents
Fig. 3A (see also Supplementary Fig. S1) shows currents activated by voltage-steps from the holding potential of −35 mV to 0 mV and +20 mV. The step-potential of 0 mV (Fig. 3A) shows activation of the transient calcium current, Ipeak (Verma et al., 2007). The step potential to +20 mV (Fig. 3A) shows activation of the outward potassium current, O (Thorn and Martin, 1987).
Fig. 3.

Effect of PF1 on voltage-activated currents. (A) Representative traces showing voltage-activated currents in control, during PF1 (1 μM) application and post-wash. Two currents observed outward potassium currents (O) and transient inward calcium current (Ipeak). Note the increase in the plateau of outward current and the decrease in the Ipeak current. (APF-Ringer no calcium or potassium channel block). (B) Current–voltage plot of the mean potassium current before, during and after PF1 (1 μM) application. Control:
 PF1 (1 μM):
 Post-wash:
 (C) Current–voltage plot of the calcium transient inward current (I) before, during and after PF1 (1 μM) application. Control:
PF1 (1 μM):
Post-wash:
(D) Long-lasting potentiation of the mean (O) potassium current before, during and after PF1 (1 μM) application (paired t-test, n = 6, **P ≤ 0.01, *P ≤ 0.05). (E) Inhibition of the peak calcium transient inward current (Ipeak) before, during and after PF1 (1 μM) application (paired t-test, n = 6, **P ≤ 0.01, *P ≤ 0.05).
(C) Current–voltage plot of the calcium transient inward current (I) before, during and after PF1 (1 μM) application. Control:
PF1 (1 μM):
Post-wash:
(D) Long-lasting potentiation of the mean (O) potassium current before, during and after PF1 (1 μM) application (paired t-test, n = 6, **P ≤ 0.01, *P ≤ 0.05). (E) Inhibition of the peak calcium transient inward current (Ipeak) before, during and after PF1 (1 μM) application (paired t-test, n = 6, **P ≤ 0.01, *P ≤ 0.05).
One μM PF1 produced an effect on the currents that increased slowly over a period of 10 min. In the representative recording (Fig. 3A) PF1 increased the potassium current from 241 nA to 310 nA and the calcium transient current decreased from −100 nA to −72 nA. Despite 20 min of continuous wash, the potassium current continued to increase to 445 nA but in contrast, the calcium transient current (Ipeak) returned towards control values, −84 nA after 20 min.
Fig. 3B shows the effect of PF1 on the current–voltage plot of the potassium currents. Fig. 3C shows the effect of PF1 on the current–voltage plot of calcium transient currents. Notice again that the effect on the potassium currents is not reversed on washing but the effect on the calcium current is partially reversed on washing. This difference in wash-out suggests different regulation of the two currents. Fig. 3D and E summarises the time-dependent effects on the potassium currents and the calcium currents in six different preparations. It can be seen by comparing Fig. 3D and E that the percentage increase in the potassium currents for the six recordings after 8 min application of PF1, 14 ± 4% (P = 0.02, n = 6), was smaller than the percentage decrease of the calcium currents, 38 ± 17% (P = 0.001, n = 6). We can also see that during the wash period the potassium current continues to increase; but the decrease in the calcium currents is not maintained. Thus, we observed the effects of PF1 on the two currents and the effect on the calcium currents was proportionately bigger than on the potassium currents.
3.3. Effect of PF1 on transient inward and steady-state currents
Because there was a larger percentage effect on the calcium currents, we decided to investigate effects of PF1 on calcium currents in isolation. We did this by using cesium in the recording electrodes and 4-AP in the bath solution to block outward potassium currents (Verma et al., 2007).
Fig. 4A is a representative recording showing the calcium current at −5 mV. The current is characterised by the presence of a transient peak (Ipeak) and a steady-state component (Iss). Fig. 4A also shows effects of 1 μM PF1 on these two components. The Ipeak decreased from −132 nA to −112 nA and the Iss decreased from −48 nA to −24 nA. Fig. 4B and C show effects of 1 μM PF1 on the current voltage plots from the same experiment. Note that maximum Ipeak is seen at 0 mV whereas the maximum Iss is seen at +5 mV suggesting they are two distinct currents. Also notice in the I–V plot that, proportionately, PF1 has a bigger effect on Iss than on Ipeak. Similar observations were made in 10 other experiments. Fig. 4D shows that the decrease for Ipeak was 35 ± 6% (P = 0.001, n = 10). Fig. 4E shows that the decrease in the Iss was 66 ± 6% (P < 0.001, n = 10). Despite a long period of washing for more than 20 min, we found that the effects of PF1 were not completely reversible.
Fig. 4.

Effect of PF1 on voltage-activated calcium currents. (A) Voltage-activated inward currents, control and during the application of PF1 (1 μM) (red); peak inward currents (Ipeak) and steady-state current (Iss). Note decrease in the Ipeak and the Iss currents. Recordings were made in calcium-Ringer solution with cesium acetate in recording micropipettes. (B) Current–voltage plot of the Ipeak before, during and after PF1 (1 μM) application. Control:
PF1 (1 μM):
Post-wash:
(C) Current–voltage plot of Iss before, during and after PF1 (1 μM) application. Control:
PF1 (1 μM):
Post-wash:
(D) Inhibition of the Ipeak current during and after PF1 (1 μM) application (paired t-test, n = 10, **P ≤ 0.01, *P ≤ 0.05). (E) Long-lasting inhibition of the mean Iss current during and after PF1 (1 μM) application (paired t-test, n = 9, **P ≤ 0.01, *P ≤ 0.05) (For interpretation of the references to colour in this figure legend, the reader is referred to the web version of this paper.).
3.4. Effect of PF1 in the presence of cobalt on the outward voltage-activated potassium current
We have seen effects of PF1 on isolated calcium currents. Our next step was to examine effects of PF1 on the potassium currents isolated from the calcium currents. To accomplish this we bathed the preparation in solutions where extracellular calcium was replaced by cobalt.
Fig. 5A shows representative traces of the effect of PF1 on the potassium current. In this particular experiment, the current plateau slightly increased from 901 nA to 947 nA after PF1 application. Fig. 5B shows the current–voltage plots from this experiment. Fig. 5C shows a bar chart of peak outward currents obtained from six preparations before, during and at 20 min post-wash following PF1 application. It is evident that the increase produced by PF1 does not reach statistical significance in the absence of calcium. This is in contrast with the significant increase seen in the presence of calcium (Fig. 3).
Fig. 5.

Lack of effect of PF1 (1 μM) in presence of cobalt. (A) Representative traces showing the effect of PF1 (1 μM) on voltage-activated outward currents in cobalt-APF. There was no change in the voltage-activated (outward) potassium currents during and after PF1 application. Recordings were made in cobalt-Ringer solution no potassium channel blockers. (B) Current–voltage plot of the mean (O) potassium currents before, during and after application of PF1 (1 μM). Control:
PF1 (1 μM):
Post-wash:
(C) There was no change in mean potassium current during and after PF1 (1 μM) application in presence of cobalt (paired t-test, n = 6, **P ≤ 0.01, *P ≤ 0.05).
3.5. Effects of high concentrations of PF1 on calcium and potassium currents
We also investigated the effect of higher concentrations of PF1 on the calcium and potassium currents. In order to look at effects on these currents we again used APF-Ringer solution (calcium is present but it lacks 4-AP). Fig. 6A (see also Supplementary Fig. S2) shows a representative trace of the effects of 10 μM PF1. PF1 produced an inhibitory effect on the Ipeak calcium current: at −5 mV, the current decreased from −70 nA to −46 nA. The Ipeak currents continued to decrease to −41 nA throughout the 20-min post-wash period. The current–voltage plot (Fig. 6C) shows the effect of PF1 on the Ipeak calcium currents. The calcium currents consistently failed to return towards control levels when this higher concentration of PF1 was used (Fig. 6E).
Fig. 6.

Effect of higher concentration of PF1. (A) Representative traces showing voltage-activated currents; mean potassium currents (O); peak inward currents (Ipeak). Voltage-activated currents: control, during PF1 (10 μM) application and post-wash. Note the increase in the peak outward current and the decrease in the Ipeak. Recordings were made in APF-Ringer solution. (B) Current–voltage plot of the mean potassium currents (O) during and after application of PF1 (10 μM). Control:
PF1 (1 μM):
Post-wash:
(C) Current–voltage plot of the Ipeak currents during and after application of PF1 (10 μM). Control:
PF1 (1 μM):
Post-wash:
The biggest effect is on the Ipeak current. (D) No significant potentiation of the mean (O) potassium current during and after PF1 (10 μM) application. (E) Significant inhibition of the Ipeak current after PF1 (10 μM) application (paired t-test, n = 5, **P ≤ 0.01, *P ≤ 0.05).
The effect of 10 μM PF1 on the potassium current was small (Fig. 6B and D). The average increase in potassium currents for the five recordings after 9 min was 3 ± 2% (P = 0.2, n = 5); this contrasts with the more dramatic decrease in the calcium current which averaged 40 ± 11% (P = 0.003, n = 5) (Fig. 6D and E). Thus 10 μM PF1 compared to 1 μM PF1 produced a smaller increase in the potassium current but a bigger decrease in calcium current (Ipeak).
3.6. AF3 reverses the effects of PF1 on calcium currents
Fig. 7 shows a summary of the effects of 1 μM AF3 on voltage-activated inward currents. Fig. 7A shows a representative trace of effects on currents activated at −5 mV. Ipeak increased from −113 nA in the control to −158 nA after AF3 application. The Iss increased from −22 nA to −39 nA. Fig. 7B and C shows current–voltage plots for Ipeak and Iss: notice that the peaks of these plots occur near ~0 mV for Ipeak and ~+5 mV for Iss. When the percentage increases were averaged over nine preparations, it was clear that the biggest effect was on the steady-state current. The average potentiation was 21 ± 7% (P = 0.03) for Ipeak and the average potentiation for Iss was 48 ± 8% (P = 0.0003). The effects of AF3 washed off gradually over a period of 20 min.
Fig. 7.

Effect of AF3 on voltage-activated inward currents. (A) Voltage-gated transient-inward currents recorded before and 9 min after AF3 application. Note the increase in the amplitude of the Ipeak and the Iss current. Recordings were made in calcium-Ringer solution with cesium acetate in recording micropipettes. (B) Ipeak current–voltage relationship for the experiment shown in A. Control:
AF3 (1 μM):
Post-wash:
(C) Iss current–voltage relationship for the experiment shown in A. Control:
AF3 (1 μM):
Post-wash:
(D) Potentiation of the Ipeak current after AF3 (1 μM) application (paired t-test, n = 9, **P ≤ 0.01, *P ≤ 0.05). (E) Long lasting potentiation of the Iss current after AF3 application (paired t-test, n = 9, **P ≤ 0.01, *P ≤ 0.05).
We described earlier the inhibitory effects of PF1 on calcium currents and how they failed to reverse on washing. In order to test the maintained viability of the preparation we followed application of PF1 with application of AF3 (Fig. 8). We found that AF3 reversed the inhibitory effects of PF1 on Ipeak and Iss. Fig. 8A (see also Supplementary Fig. S3) shows a representative recording, at −5 mV, of the effects of PF1 on the control calcium currents and its reversal by AF3. The effects on the current–voltage plots of Ipeak and Iss are shown in Fig. 8B and C.
Fig. 8.

AF3 triggers the recovery of PF1-inhibited currents. (A) Voltage-activated inward currents records: control; PF1 (1 μM) (red) and; AF3 (1 μM). Note the decrease in amplitude of the Ipeak and the Iss currents after PF1 application and recovery of currents after AF3 application. Recordings were made in calcium-Ringer solution with cesium acetate in recording micropipettes. (B) Ipeak current step–voltage relationship for the experiment shown in (A). Control:
PF1 (1 μM):
 AF3 (1 μM):
 Postwash:
(C) Iss current step–voltage relationship for the experiment shown in (A). Control:
PF1 (1 μM):
AF3 (1 μM):
Post-wash:
(D) Inhibition of the Ipeak current after PF1 and recovery after AF3 application (paired t-test, n = 5, **P ≤ 0.01, *P ≤ 0.05). (E) Inhibition of the Iss current after PF1 application and recovery after AF3 application. Note that AF3 potentiated the Iss current (paired t-test, n = 5, **P ≤ 0.01, *P ≤ 0.05).
Postwash:
(C) Iss current step–voltage relationship for the experiment shown in (A). Control:
PF1 (1 μM):
AF3 (1 μM):
Post-wash:
(D) Inhibition of the Ipeak current after PF1 and recovery after AF3 application (paired t-test, n = 5, **P ≤ 0.01, *P ≤ 0.05). (E) Inhibition of the Iss current after PF1 application and recovery after AF3 application. Note that AF3 potentiated the Iss current (paired t-test, n = 5, **P ≤ 0.01, *P ≤ 0.05).
Fig. 8D and E summarise the effects of PF1 and then AF3 application on Ipeak and Iss. The average decrease in Ipeak from five experiments after application of PF1 was 26 ± 7% (P = 0.02) which recovered to 89 ± 6% (P = 0.0005) after AF3 application. These effects were statistically significant. The average decrease in Iss after PF1 application was 60 ± 10% (P = 0.001) which recovered to 104 ± 28% (P = 0.04) after AF3 application.
Fig. 9A and B shows the activation curves for the experiment shown in Fig. 8. The activation curve was obtained using the Boltzmann equation:
Fig. 9.

Activation curves for Ipeak & Iss. (A) Activation curves for Ipeak currents before and during application of PF1 & AF3. Control:
PF1 (1 μM):
AF3 (1 μM):
 (B) Activation curves for Iss currents before and during application of PF1 & AF3. Control:
PF1 (1 μM):
AF3 (1 μM):
(C) Change in Gmax of Ipeak currents after AF3 application. (D) Change in Gmax of Iss currents after AF3 application.
(B) Activation curves for Iss currents before and during application of PF1 & AF3. Control:
PF1 (1 μM):
AF3 (1 μM):
(C) Change in Gmax of Ipeak currents after AF3 application. (D) Change in Gmax of Iss currents after AF3 application.
Where G is the conductance change, Gmax is the maximum conductance change, V50 is the half maximum step-voltage, V is the step voltage and KSlope is the slope factor. Fig. 9A represents the activation curve for Ipeak currents. The control activation curve had a Gmax of 3.6 ± 0.04 μS; V50 of −20.8 ± 1.5 mV and KSlope of 3.2 ± 0.6. During PF1 application, Gmax was 3.0 ± 0.05 μS; V50 was −19 ± 0.8 mV and KSlope was 3.04 ± 0.5. Following AF3, Gmax was 4.9 ± 0.03 μS; V50 was −25.6 ± 0.5 mV and KSlope was 4.7 ± 1.1.
Fig. 9B is the activation curve for Iss currents. The control activation curve had a Gmax of 4.2 ± 0.06 μS; V50 was −0.7 ± 0.2 mV and KSlope was 3 ± 0.2. During PF1 application, Gmax was 2.9 ± 0.1 μS; V50 was −0.9 ± 0.4 mV and KSlope was 3.1 ± 0.3. Following AF3, Gmax was 6.4 ± 0.1 μS; V50 was −4.4 ± 0.3 mV and KSlope was 3.8 ± 0.3. For four averaged recordings the effect of PF1 and AF3 on Gmax of Iss was statistically significant (Table 1 and Fig. 9D). The effect of AF3 but not PF1 on Gmax of Ipeak was statistically significant (Table 1 and Fig. 9C). The effect of PF1 and AF3 on V50 of Ipeak but not the V50 of Iss was statistically significant (Table 1). The effect of PF1 on Gmax of Iss but the lack of effect on Gmax of Ipeak suggests that the two currents are separate with different kinetic properties.
Table 1.
Average values of the activation curves for Ipeak and Iss calcium currents fitted by Boltzmann equation (n = 4 preparations from separate worms, aP ≤ 0.005; bP ≤ 0.01; cP ≤ 0.05)
| Peak current
|
Steady-state current
|
|||||
|---|---|---|---|---|---|---|
| Control | PF1 | AF3 | Control | PF1 | AF3 | |
| Gmax(μS) | 2.8 ± 0.3 | 2.8 ± 0.2 | 3.9 ± 0.4c | 3.5 ± 0.9 | 2 ± 0.8a | 5.4 ± 1.1a |
| V50(mV) | −17 ± 1.7 | −15 ± 1.9c | −21 ± 1.4c | −2.5 ± 2.6 | −0.82 ± 1.9 | −2.2 ± 2.7 |
| KSlope(mV) | 3.5 ± 0.3 | 4.2 ± 0.5 | 4.3 ± 0.9 | 3.5 ± 0.7 | 2.4 ± 0.5c | 4.4 ± 1.1c |
These averages are for the experiments where AF3 was used to trigger the recovery of PF1 inhibited calcium-currents (n = 5).
4. Discussion
PF1 was first recovered and identified from Panagrellus redivivus (Geary et al., 1992) and then from Caenorhabditis elegans (Rosoff et al., 1992). In A. suum four PNFLRFamides (AQDPNFL/IRFamide, ATDPNFL/IRFamide, APKPNFL/IRFamide and ENEKKAVPGVLTRFamide) have been proposed (Yew et al., 2005). One hundred nM–100 μM PF1 produces a long lasting flaccid paralysis of A. suum body-wall muscle strips and a 3 mV hyperpolarization (Franks et al., 1994; Bowman et al., 1995; Maule et al., 1995). The hyperpolarization is independent of extracellular chloride and is blocked by a combination of potassium channel antagonists and NOS inhibitors: 4-AP, tetra-ethyl-ammonium (TEA) and 7-nitroindazole (Bowman et al., 2002). During an investigation of the effects of PF1, Bowman et al. (1995) noted the complete dependence of A. suum NOS activity on calcium. Bowman et al. (2002) suggested that a possible explanation for the requirement for a combination of 4-AP, TEA and 7-nitroindazole to block PF1 hyperpolarizations is that PF1 opens a calcium channel in the nematode muscle membrane which activates the calcium sensitive NOS; the NO produced gates a membrane potassium channel to cause the hyperpolarization and relaxation.
In our studies we examined the effects of PF1 on voltage-activated calcium currents. However, we found that the PF1 did not increase the calcium currents but actually inhibited them (Fig. 4). We also found that PF1, in the presence of calcium, increased the voltage-activated potassium current (Fig. 3). Interestingly, the effect on the voltage-activated potassium current was abolished when calcium was removed and replaced with cobalt and was reduced at a higher concentration of PF1 (Figs. 5 and 6). Our observations support the requirement for the presence of calcium for effects of PF1. Fig. 10 is a summary diagram of the effects of PF1 on the calcium and potassium currents.
Fig. 10.
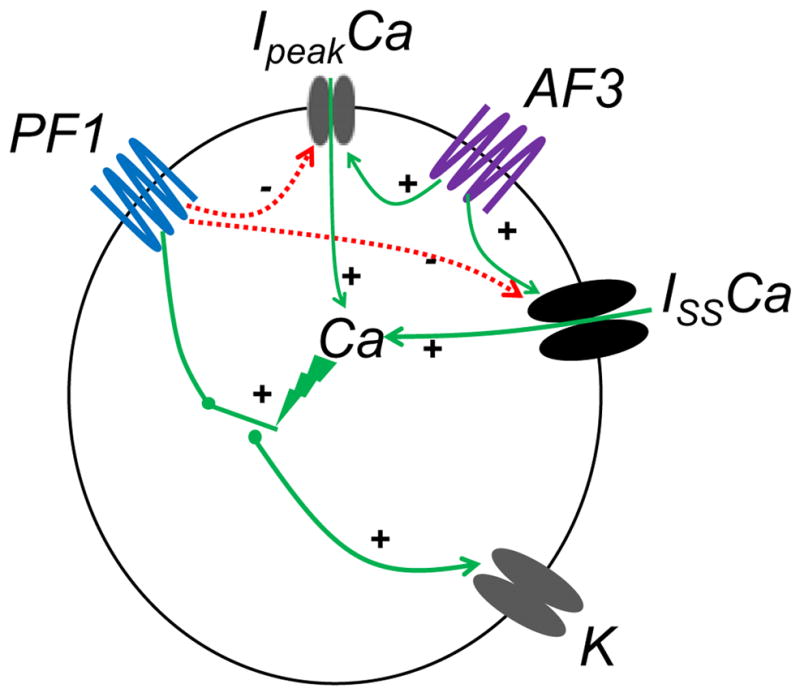
Summary diagram of the effects of PF1 and AF3 on voltage-activated currents. PF1 inhibits the opening of voltage-activated calcium channels (Ipeak and Iss) and stimulates opening of potassium channels (K) but only in the presence of calcium. AF3 stimulates opening of voltage-activated calcium channels (Ipeak and Iss). Calcium is required to allow the inhibitory effect of PF1 on potassium currents. If sufficient calcium is not present (for example due to the presence of cobalt in the bathing solution or if a high concentration of PF1 is used inhibiting the voltage-activated currents) the effect of PF1 on voltage-activated potassium current is prevented.
The presence of voltage-activated calcium currents has been demonstrated in A. suum muscle cells (Martin et al., 1992; Verma et al., 2007). Here we have investigated the effects of the neuropeptides, PF1 and AF3, on transient (Ipeak) and steady-state (Iss) calcium currents. In C. elegans, several genes coding for calcium channels have been identified. There are low voltage-activated channels (CCA-1; T-type, Shtonda and Avery, 2005) and high voltage-activated channels ([UNC-2; R-type; Schafer and Kenyon, 1995 and EGL-19; L-type; Jospin et al. (2002)). Different classes of calcium channels have not been genetically identified in A. suum.
Ipeak in A. suum is most like (Verma et al., 2007) C. elegans UNC-2 type currents (Schafer and Kenyon, 1995); they are activated by potentials −30 to +30 mV and inactivated in the 50–80 ms range. Verma et al. (2007) demonstrated that AF2, an excitatory neuropeptide, produces an increase in the Ipeak current. Removal of calcium and addition of cobalt abolishes the Ipeak in A. suum muscles, indicating that calcium is the major charge carrier of this current.
egl-19 encodes the L-type calcium channel in pharynx and body wall muscles in C. elegans (Lee et al., 1997). L-type calcium currents in C. elegans have a fast and a slow component but the components are not pharmacologically separate (Jospin et al., 2002). The Iss current in A. suum is similar to the L-type calcium current as it has a high voltage threshold for activation (peaks ~+5 mV) and is long lasting in nature (~30 ms). The Iss current is abolished by cobalt and the absence of calcium, consistent with calcium being the major charge carrier.
The neuropeptide AF3 was first recovered from A. suum by Cowden and Stretton (1995) and found to stimulate contraction of A. suum muscle strips (Trim et al., 1997). We used AF3 to study voltage-activated currents and found that it increased Ipeak and Iss calcium currents. Previous investigations of the action of AF3 have demonstrated that it exerts a depolarising effect which is blocked by cobalt (Trim et al., 1997; Brownlee and Walker, 1999), an action consistent with our observations on the voltage-activated calcium currents. We exploited the stimulatory effects of AF3 on the calcium currents to counter the actions of PF1 which are not otherwise easily reversed on washing (Franks et al., 1994). Our concern was to confirm that the calcium currents had not declined because of failing viability of the preparation. It is interesting to note that AF3 had its biggest percentage effect on the Iss but the neuropeptide AF2 has its biggest effect on the Ipeak (Verma et al., 2007). The different actions by these two neuropeptides, on Ipeak and Iss, imply that they can be modulated separately and that the two currents have separate origins and physiological functions. It is possible that Iss currents are similar to C. elegans EGL-19 L-type calcium currents that have been found in body wall, enteric, egg laying and pharyngeal muscles (Lee et al., 1997; Jospin et al., 2002). EGL-19 has been demonstrated to maintain the plateau phase of action potentials of pharyngeal muscles (Shtonda and Avery, 2005). The UNC-2 type calcium currents in C. elegans have similarities to the Ipeak current and are associated with neurotransmitter release and calcium-dependent action potentials in pharyngeal muscles (Schafer and Kenyon, 1995; Mathews et al., 2003). We do, however, caution that we have not conclusively separated the Ipeak and Iss calcium currents in A. suum and there is a possibility that the two currents are due to the same channel with different levels of inactivation as described by Dick et al. (2008).
Emodepside, a semisynthetic derivative of PF1022A, is a novel cyclo-octadepsipeptide anthelmintic (Harder et al., 2003; von Samson-Himmelstjerna et al., 2005). Emodepside has potent paralytic effects on A. suum body wall muscles (Willson et al., 2003) and has a wide range of effects on C. elegans inhibiting development, locomotion, egg laying and feeding (Bull et al., 2007).
Martin et al., 1992 demonstrated that PF1022A does not produce its effect on A. suum muscles by mimicking the inhibitory neurotransmitter GABA or by antagonizing nicotinic receptors. It has been demonstrated that the parent compound, PF1022A, interacts with latrophilin receptors (Saeger et al., 2001). The latrophilin receptors are G-protein coupled receptors involved in the regulation of transmitter release from dense core vesicles (Davletov et al., 1998). It has been suggested that emodepside induces latrophilin-mediated release of transmitters by a pathway that involves UNC-13-dependent vesicle priming in C. elegans (Willson et al., 2004).
Another proposed mechanism of action of emodepside has been to mimic the effects of PF1 or to induce the release of PF1 (Willson et al., 2003). Both PF1 and emodepside produce relaxation, slow hyperpolarization and a small change in input conductance of A. suum muscle cells (Bowman et al., 2002; Willson et al., 2003). It has also been shown that the effects of PF1 in A. suum muscles are calcium-dependent (Franks et al., 1994; Bowman et al., 1995) as are the effects of emodepside (Harder et al., 2003). Potassium channel blockers reduce hyperpolarization induced by both PF1 and emodepside (Harder et al., 2003).
We found that the PF1 did not increase the voltage-activated calcium currents but inhibited them. Our observations also demonstrated the importance of entry of calcium for an effect on voltage-activated potassium currents. Fig. 10 is a summary diagram showing the actions of PF1: PF1 cannot stimulate the potassium channel unless sufficient calcium is present in the cell. At high concentrations of PF1, calcium entry may be so reduced that it prevents an effect of PF1 on the potassium currents. We have shown that PF1 inhibits voltage-activated calcium currents and potentiates voltage-activated potassium currents. The action of emodepside in C. elegans has been shown to depend upon the SLO-1 pathway. SLO-1 is a calcium-activated-potassium channel (Guest et al., 2007). The effect on a calcium-activated-potassium channel appears to be common to both PF1 and emodepside. It will be of interest to investigate the actions of emodepside on calcium currents to further elucidate the mechanism of action of emodepside.
Supplementary Material
Supplementary data associated with this article can be found, in the online version, at doi:10.1016/j.ijpara.2008.07.007.
Supplementary Fig. S1. Effect of PF1 on voltage-activated currents.
Supplementaary Fig. S2. Effect of higher concentration of PF1.
Supplementary Fig. S3. AF3 triggers the recovery of PF1-inhibited currents.
Acknowledgments
The project was supported by Grant No. R 01 AI 047194 from the National Institute of Allergy and Infectious Diseases to R.J.M. The content is solely the responsibility of the authors and does not necessarily represent the official views of the National Institute of Allergy and Infectious Diseases of the National Institutes of Health.
References
- Bethony J, Brooker S, Albonico M, Geiger SM, Loukas A, Diemert D, Hotez PJ. Soil-transmitted helminth infections: ascariasis, trichuriasis, and hookworm. Lancet. 2006;367:1521–1532. doi: 10.1016/S0140-6736(06)68653-4. [DOI] [PubMed] [Google Scholar]
- Bowman JW, Winterrowd CA, Friedman AR, Thompson DP, Klein RD, Davis JP, Maule AG, Blair KL, Geary TG. Nitric oxide mediates the inhibitory effects of SDPNFLRFamide, a nematode FMRFamide-related neuropeptide, in Ascaris suum. J Neurophysiol. 1995;74:1880–1888. doi: 10.1152/jn.1995.74.5.1880. [DOI] [PubMed] [Google Scholar]
- Bowman JW, Friedman AR, Thompson DP, Maule AG, Alexander-Bowman SJ, Geary TG. Structure–activity relationships of an inhibitory nematode FMRFamide-related peptide, SDPNFLRFamide (PF1), on Ascaris suum muscle. Int J Parasitol. 2002;32:1765–1771. doi: 10.1016/s0020-7519(02)00213-8. [DOI] [PubMed] [Google Scholar]
- Brownlee DJ, Fairweather I, Holden-Dye L, Walker RJ. Nematode neuropeptides: localization, isolation and functions. Parasitol Today. 1996;12:343–351. doi: 10.1016/0169-4758(96)10052-1. [DOI] [PubMed] [Google Scholar]
- Brownlee DJ, Walker RJ. Actions of nematode FMRFamide-related peptides on the pharyngeal muscle of the parasitic nematode, Ascaris suum. Ann NY Acad Sci. 1999;897:228–238. [Google Scholar]
- Bull K, Cook A, Hopper NA, Harder A, Holden-Dye L, Walker RJ. Effects of the novel anthelmintic emodepside on the locomotion, egg-laying behaviour and development of Caenorhabditis elegans. Int J Parasitol. 2007;37:627–636. doi: 10.1016/j.ijpara.2006.10.013. [DOI] [PubMed] [Google Scholar]
- Catterall WA, Perez-Reyes E, Snutch TP, Striessnig J. International union of pharmacology. XLVIII Nomenclature and structure–function relationships of voltage-gated calcium channels. Pharmacol Rev. 2005;57:411–425. doi: 10.1124/pr.57.4.5. [DOI] [PubMed] [Google Scholar]
- Coles GC. The future of veterinary parasitology. Vet Parasitol. 2001;98:31–39. doi: 10.1016/s0304-4017(01)00421-6. [DOI] [PubMed] [Google Scholar]
- Cowden C, Stretton AOW. Neuropeptides isolated from the nematode Ascaris suum. Pepides. 1995;16:491–500. doi: 10.1016/0196-9781(94)00211-n. [DOI] [PubMed] [Google Scholar]
- Davletov BA, Meunier FA, Ashton AC, Matsushita H, Hirst WD, Lelianova VG, Wilkin GP, Dolly JO, Ushkaryov YA. Vesicle exocytosis stimulated by α-latrotoxin is mediated by latrophilin and requires both external and stored Ca2+ EMBO J. 1998;17:3909–3920. doi: 10.1093/emboj/17.14.3909. [DOI] [PMC free article] [PubMed] [Google Scholar]
- de Silva NR, Brooker S, Hotez PJ, Montresor A, Engels D, Savioli L. Soil-transmitted helminth infections: updating the global picture. Trends Parasitol. 2003;19:547–551. doi: 10.1016/j.pt.2003.10.002. [DOI] [PubMed] [Google Scholar]
- Dick IE, Tadross MR, Liang H, Tay LH, Yang W, Yue DT. A modular switch for spatial Ca2+ selectivity in the calmodulin regulation of CaV channels. Nature. 2008;451:830–834. doi: 10.1038/nature06529. [DOI] [PMC free article] [PubMed] [Google Scholar]
- Franks CJ, Holden-Dye L, Williams RG, Pang FY, Walker RJ. A nematode FMRFamide-like peptide, SDPNFLRFamide (PF1), relaxes the dorsal muscle strip preparation of Ascaris suum. Parasitology. 1994;108(Pt 2):229–236. doi: 10.1017/s0031182000068335. [DOI] [PubMed] [Google Scholar]
- Geary TG, Price DA, Bowman JW, Winterrowd CA, Mackenzie CD, Garrison RD, Williams JF, Friedman AR. Two FMRFamide-like peptides from the free-living nematode Panagrellus redivivus. Peptides. 1992;13:209–214. doi: 10.1016/0196-9781(92)90098-n. [DOI] [PubMed] [Google Scholar]
- Geary TG, Marks NJ, Maule AG, Bowman JW, Alexander-Bowman SJ, Day TA, Larsen MJ, Kubiak TM, Davis JP, Thompson DP. Pharmacology of FMRFamide-related peptides in helminths. Ann NY Acad Sci. 1999;897:212–227. doi: 10.1111/j.1749-6632.1999.tb07893.x. [DOI] [PubMed] [Google Scholar]
- Geary TG, Kubiak TM. Neuropeptide G-protein-coupled receptors, their cognate ligands and behavior in Caenorhabditis elegans. Trends Pharmacol Sci. 2005;26:56–58. doi: 10.1016/j.tips.2004.12.006. [DOI] [PubMed] [Google Scholar]
- Geerts S, Gryseels B. Drug resistance in human helminths: current situation and lessons from livestock. Clin Microbiol Rev. 2000;13:207–222. doi: 10.1128/cmr.13.2.207-222.2000. [DOI] [PMC free article] [PubMed] [Google Scholar]
- Guest M, Bull K, Walker RJ, Amliwala K, O’Connor V, Harder A, Holden-Dye L, Hopper NA. The calcium-activated potassium channel, SLO-1, is required for the action of the novel cyclo-octadepsipeptide anthelmintic, emodepside, in Caenorhabditis elegans. Int J Parasitol. 2007;37:1577–1588. doi: 10.1016/j.ijpara.2007.05.006. [DOI] [PubMed] [Google Scholar]
- Harder A, Schmitt-Wrede HP, Krucken J, Marinovski P, Wunderlich F, Willson J, Amliwala K, Holden-Dye L, Walker R. Cyclooctadepsipeptides – an anthelmintically active class of compounds exhibiting a novel mode of action. Int J Antimicrob Agents. 2003;22:318–331. doi: 10.1016/s0924-8579(03)00219-x. [DOI] [PubMed] [Google Scholar]
- Hotez PJ, Molyneux DH, Fenwick A, Kumaresan J, Sachs SE, Sachs JD, Savioli L. Control of neglected tropical diseases. N Engl J Med. 2007;357:1018–1027. doi: 10.1056/NEJMra064142. [DOI] [PubMed] [Google Scholar]
- Husson SJ, Clynen E, Baggerman G, De Loof A, Schoofs L. Discovering neuropeptides in Caenorhabditis elegans by two dimensional liquid chromatography and mass spectrometry. Biochem Biophys Res Commun. 2005;335:76–86. doi: 10.1016/j.bbrc.2005.07.044. [DOI] [PubMed] [Google Scholar]
- Jeziorski MC, Greenberg RM, Anderson PA. The molecular biology of invertebrate voltage-gated Ca2+ channels. J Exp Biol. 2000;203:841–856. doi: 10.1242/jeb.203.5.841. [DOI] [PubMed] [Google Scholar]
- Jospin M, Jacquemond V, Mariol MC, Segalat L, Allard B. The L-type voltage-dependent Ca2+ channel EGL-19 controls body wall muscle function in Caenorhabditis elegans. J Cell Biol. 2002;159:337–348. doi: 10.1083/jcb.200203055. [DOI] [PMC free article] [PubMed] [Google Scholar]
- Kaplan RM. Drug resistance in nematodes of veterinary importance: a status report. Trends Parasitol. 2004;20:477–481. doi: 10.1016/j.pt.2004.08.001. [DOI] [PubMed] [Google Scholar]
- Lee RY, Lobel L, Hengartner M, Horvitz HR, Avery L. Mutations in the alpha1 subunit of an L-type voltage-activated Ca2+ channel cause myotonia in Caenorhabditis elegans. Embo J. 1997;16:6066–6076. doi: 10.1093/emboj/16.20.6066. [DOI] [PMC free article] [PubMed] [Google Scholar]
- Li C. The ever-expanding neuropeptide gene families in the nematode Caenorhabditis elegans. Parasitology. 2005;131(Suppl):S109–S127. doi: 10.1017/S0031182005009376. [DOI] [PubMed] [Google Scholar]
- Martin RJ, Thorn P, Gration KA, Harrow ID. Voltage-activated currents in somatic muscle of the nematode parasite Ascaris suum. J Exp Biol. 1992;173:75–90. doi: 10.1242/jeb.173.1.75. [DOI] [PubMed] [Google Scholar]
- Mathews EA, Garcia E, Santi CM, Mullen GP, Thacker C, Moerman DG, Snutch TP. Critical residues of the Caenorhabditis elegans unc-2 voltagegated calcium channel that affect behavioral and physiological properties. J Neurosci. 2003;23:6537–6545. doi: 10.1523/JNEUROSCI.23-16-06537.2003. [DOI] [PMC free article] [PubMed] [Google Scholar]
- Maule AG, Geary TG, Bowman JW, Marks NJ, Blair KL, Halton DW, Shaw C, Thompson DP. Inhibitory effects of nematode FMRFamide-related peptides (FaRPs) on muscle strips from Ascaris suum. Invert Neurosci. 1995;1:255–265. doi: 10.1007/BF02211027. [DOI] [PubMed] [Google Scholar]
- McVeigh P, Leech S, Mair GR, Marks NJ, Geary TG, Maule AG. Analysis of FMRFamide-like peptide (FLP) diversity in phylum Nematoda. Int J Parasitol. 2005;35:1043–1060. doi: 10.1016/j.ijpara.2005.05.010. [DOI] [PubMed] [Google Scholar]
- McVeigh P, Geary TG, Marks NJ, Maule AG. The FLP-side of nematodes. Trends Parasitol. 2006;22:385–396. doi: 10.1016/j.pt.2006.06.010. [DOI] [PubMed] [Google Scholar]
- Osei-Atweneboana MY, Eng JK, Boakye DA, Gyapong JO, Prichard RK. Prevalence and intensity of Onchocerca volvulus infection and efficacy of ivermectin in endemic communities in Ghana: a two-phase epidemiological study. Lancet. 2007;369:2021–2029. doi: 10.1016/S0140-6736(07)60942-8. [DOI] [PubMed] [Google Scholar]
- Rosoff ML, Burglin TR, Li C. Alternatively spliced transcripts of the flp-1 gene encode distinct FMRFamide-like peptides in Caenorhabditis elegans. J Neurosci. 1992;12:2356–2361. doi: 10.1523/JNEUROSCI.12-06-02356.1992. [DOI] [PMC free article] [PubMed] [Google Scholar]
- Saeger B, Schmitt-Wrede HP, Dehnhardt M, Benten WP, Krucken J, Harder A, Von Samson-Himmelstjerna G, Wiegand H, Wunderlich F. Latrophilin-like receptor from the parasitic nematode Haemonchus contortus as target for the anthelmintic depsipeptide PF1022A. FASEB J. 2001;15:1332–1334. doi: 10.1096/fj.00-0664fje. [DOI] [PubMed] [Google Scholar]
- Schafer WR, Kenyon CJ. A calcium-channel homologue required for adaptation to dopamine and serotonin in Caenorhabditis elegans. Nature. 1995;375:73–78. doi: 10.1038/375073a0. [DOI] [PubMed] [Google Scholar]
- Shtonda B, Avery L. CCA-1, EGL-19 and EXP-2 currents shape action potentials in the Caenorhabditis elegans pharynx. J Exp Biol. 2005;208:2177–2190. doi: 10.1242/jeb.01615. [DOI] [PMC free article] [PubMed] [Google Scholar]
- Stretton AO, Cowden C, Sithigorngul P, Davis RE. Neuropeptides in the nematode Ascaris suum. Parasitology. 1991;102(Suppl):S107–S116. doi: 10.1017/s0031182000073339. [DOI] [PubMed] [Google Scholar]
- Tedford HW, Zamponi GW. Direct G protein modulation of Cav2 calcium channels. Pharmacol Rev. 2006;58:837–862. doi: 10.1124/pr.58.4.11. [DOI] [PubMed] [Google Scholar]
- Thorn P, Martin RJ. A high-conductance calcium-dependent chloride channel in Ascaris suum muscle. Q J Exp Physiol. 1987;72:31–49. doi: 10.1113/expphysiol.1987.sp003053. [DOI] [PubMed] [Google Scholar]
- Trailovic SM, Clarke SL, Robertson AP, Martin RJ. Brief application of AF2 produces long lasting potentiation of nAChR responses in Ascaris suum. Mol Biochem Parasitol. 2005;139:51–64. doi: 10.1016/j.molbiopara.2004.10.001. [DOI] [PubMed] [Google Scholar]
- Trim N, Holden-Dye L, Ruddell R, Walker RJ. The effects of the peptides AF3 (AVPGVLRFamide) and AF4 (GDVPGVLRFamide) on the somatic muscle of the parasitic nematodes Ascaris suum and Ascaridia galli. Parasitology. 1997;115(Pt 2):213–222. doi: 10.1017/s0031182097001224. [DOI] [PubMed] [Google Scholar]
- Verma S, Robertson AP, Martin RJ. The nematode neuropeptide, AF2 (KHEYLRF-NH2), increases voltage-activated calcium currents in Ascaris suum muscle. Br J Pharmacol. 2007;151:888–899. doi: 10.1038/sj.bjp.0707296. [DOI] [PMC free article] [PubMed] [Google Scholar]
- von Samson-Himmelstjerna G, Harder A, Sangster NC, Coles GC. Efficacy of two cyclooctadepsipeptides, PF1022A and emodepside, against anthelmintic-resistant nematodes in sheep and cattle. Parasitology. 2005;130:343–347. doi: 10.1017/s0031182004006523. [DOI] [PubMed] [Google Scholar]
- Walker RJ, Franks CJ, Pemberton D, Rogers C, Holden-Dye L. Physiological and pharmacological studies on nematodes. Acta Biol Hung. 2000;51:379–394. [PubMed] [Google Scholar]
- Willson J, Amliwala K, Harder A, Holden-Dye L, Walker RJ. The effect of the anthelmintic emodepside at the neuromuscular junction of the parasitic nematode Ascaris suum. Parasitology. 2003;126:79–86. doi: 10.1017/s0031182002002639. [DOI] [PubMed] [Google Scholar]
- Willson J, Amliwala K, Davis A, Cook A, Cuttle MF, Kriek N, Hopper NA, O’Connor V, Harder A, Walker RJ, Holden-Dye L. Latrotoxin receptor signaling engages the UNC-13-dependent vesicle-priming pathway in C. elegans. Curr Biol. 2004;14:1374–1379. doi: 10.1016/j.cub.2004.07.056. [DOI] [PubMed] [Google Scholar]
- Wolstenholme AJ, Fairweather I, Prichard R, von Samson-Himmelstjerna G, Sangster NC. Drug resistance in veterinary helminths. Trends Parasitol. 2004;20:469–476. doi: 10.1016/j.pt.2004.07.010. [DOI] [PubMed] [Google Scholar]
- Yew JY, Kutz KK, Dikler S, Messinger L, Li L, Stretton AO. Mass spectrometric map of neuropeptide expression in Ascaris suum. J Comp Neurol. 2005;488:396–413. doi: 10.1002/cne.20587. [DOI] [PubMed] [Google Scholar]
Associated Data
This section collects any data citations, data availability statements, or supplementary materials included in this article.
Supplementary Materials
Supplementary data associated with this article can be found, in the online version, at doi:10.1016/j.ijpara.2008.07.007.
Supplementary Fig. S1. Effect of PF1 on voltage-activated currents.
Supplementaary Fig. S2. Effect of higher concentration of PF1.
Supplementary Fig. S3. AF3 triggers the recovery of PF1-inhibited currents.