Abstract
Higher eukaryotes must adapt a totipotent genome to specialized cell types with a stable but limited repertoire of functions. One potential mechanism for lineage restriction is changes in chromatin, and differentiation-related chromatin changes have been observed for individual genes1–2. We have taken a genome-wide view of histone H3 lysine-9 dimethylation (H3K9Me2). We find that differentiated tissues exhibit surprisingly large K9-modified regions (up to 4.9 Mb), that are highly conserved between human and mouse, and differentiation-specific, covering only ~4% of the genome in undifferentiated mouse embryonic stem (ES) cells, compared to 31% in differentiated ES cells, ~46% in liver and ~10% in brain. They require histone methyltransferase G9a, and are inversely related to expression of genes within them, and we term them Large Organized Chromatin K9-modifications (LOCKs). LOCKs are substantially lost in cancer cell lines, and they may provide a cell type-heritable mechanism for phenotypic plasticity in development and disease.
We first examined human placenta, using ChIP-on-chip assays, i.e. chromatin immunoprecipitation (ChIP) with antibody to H3K9Me2 followed by hybridization to genomic microarrays3. We immunoprecipitated without formalin cross-linking of DNA to protein, or to sonication to dissociate nucleosomes, contrary to typical ChIP protocols, which was critical for these experiments. We used micrococcal nuclease (MNase)-digested native chromatin and validated the procedure independently with an antibody to a second modification, H3K27Me3 (Supplementary Fig. 1). After ChIP, DNA was purified, labeled, and hybridized to the ENcylopedia Of DNA Elements (ENCODE) array and a custom array (Supplementary Table 1), covering ~2% of the human genome. H3K9Me2 revealed a dramatic clustering of modifications over relatively large genomic regions, up to 2.9 Mb (Fig. 1 and Supplementary Fig. 2). For example, 7 Mb of human chromosome 15, harboring an imprinted gene cluster associated with Prader-Willi and Angelman syndromes, contained two such regions of ~2 Mb each (Fig. 1). Interestingly, the paternally expressed imprinted genes were clustered within and near the edges of these regions, while maternally expressed imprinted genes were clustered between them (Fig. 1), suggesting a potential role in gene repression. On the two arrays, ~20% of the genome was located within large heterochromatin H3K9Me2 regions in placenta (Supplementary Data 1). We validated the ChIP-on-chip data by quantitative ChIP real-time PCR for 19 sites both within and outside these regions, confirming in all cases the array hybridizations (Supplementary Fig. 3). Supporting a functional role for these large K9-methylated regions, they were frequently bounded by known binding sites4 for CTCF (Fig. 1, Supplementary Fig. 2), a known insulator that establishes boundaries between euchromatin and heterochromatin5. 37 of 53 (70%) boundaries were within 100 kb of at least one CTCF binding site (P = 0.0001 based on 10,000 iterations). This does not contradict the major function of CTCF as an enhancer insulator, as the overwhelming majority of CTCF sites (83%) did not border these regions.
Figure 1. LOCK-like clustering of histone H3 lysine-9 dimethylation (H3K9Me2) in human placenta.
Freshly purified native chromatin digested with micrococcal nuclease was immunoprecipitated with antibody to H3K9Me2 and hybridized to human genomic tiling arrays (ChIP-on-chip), revealing two LOCK-like clusters of ~2 Mb each in the chromosome 15 Prader-Willi/Angelman syndromes imprinted gene region. The X axis represents genomic positions and the Y axis gives log2 ratios of ChIP over input signal. The gray dots represent individual probe data, and the red line denotes the smoothed curve by sliding windows. The orange bars in the middle show locations of known CTCF binding sites and gene annotations are given on the bottom. The paternally expressed genes (Mkrn3, Ndn, Snrpn and Gabrb3) are localized within and near the edges of LOCK, whereas the maternally expressed genes (Ube3a and Atp10a) are localized between the LOCKs. CTCF binding sites are largely located at the boundaries of the LOCKs.
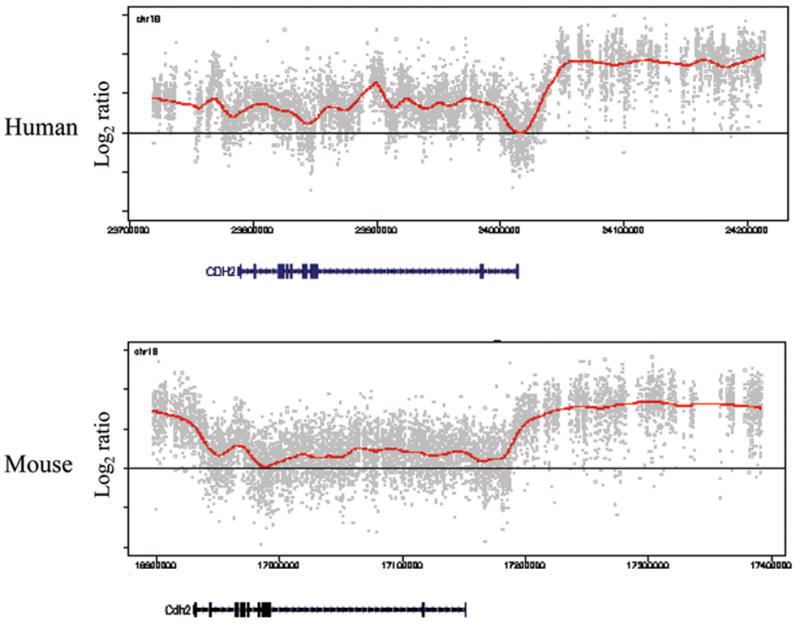
We repeated the experiments on a mouse ENCODE array, as well as a custom mouse array with regions syntenic to the human custom array (Fig. 2, Supplementary Fig. 4). 87.5% of the human modified regions were syntenic to modified regions in the mouse (P = 0, based on 10,000 iterations). We tested whether this higher order K9-methylation is specifically associated with differentiation, by comparing the results in undifferentiated mouse ES cells with in vitro randomly differentiated ES cells. We differentiated ES cells by removing leukemia inhibitory factor (LIF) and growing without feeder cells, which leads to a mixed population of partially differentiated cells6, confirmed by real-time quantitative PCR with six lineage-specific markers (Supplementary Fig. 5). Strikingly, in the whole mouse genome, large-scale modifications were minimal to absent in undifferentiated ES cells, but arose on their differentiation (e.g., Fig. 3a), comprising only 4% of the genome of undifferentiated ES cells, compared to 31% in differentiated ES cells. We extended this analysis to two adult mouse tissues, liver and brain, 45.6% of the genome showing higher-order modification in the liver, and 9.8% in the brain (Supplementary Table 2). The average size of the modified regions also increased from undifferentiated ES cells (43 kb) to differentiated ES cells (93 kb), and was comparatively large in the liver (235 kb), which also contained the largest modified regions (4.9 Mb, Supplementary Data 2). Because of their differentiation- and tissue-specificity, we refer to these regions as Large Organized Chromatin K9-modifications, or LOCKs.
Figure 2. H3K9Me2 LOCKs are conserved between human and mouse.

ChIP-on-chip data of the ENCODE region ENr213 in human placenta and its syntenic region in mouse liver. Dots and curves are as in Fig. 1. The location of H3K9Me2 LOCKs is highly consistent between human and mouse. The LOCK on the right part of the figure begins at the 3′end of the CDH2 gene in both human and mouse. See also Supplementary Fig. 4.
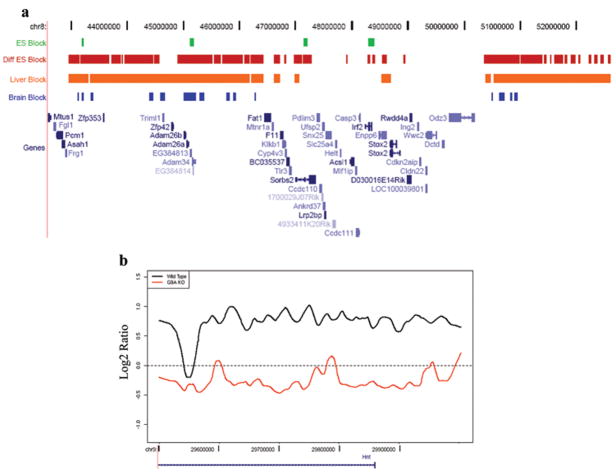
Figure 3. H3K9Me2 LOCKs arise during differentiation.
a, Depicted is a summary of data from a 10 Mb region of mouse chromosome 8. Locations of LOCKs in undifferentiated mouse embryonic stem (ES) cells, differentiated ES cells, liver and brain are denoted by green, red, orange and blue bars, respectively. b, LOCKs are almost completely absent in differentiated G9a knockout ES cells, compared to wild type ES cells. The black and red lines represent smoothed curves of H3K9Me2 in differentiated WT and G9a knockout ES cells, respectively. See also Supplementary Fig 6.
We then tested whether LOCK formation was dependent on G9a, the dominant methyltransferase in H3K9 dimethylation7, by comparing differentiated G9a knockout ES to control differentiated ES cells prepared concurrently. Strikingly, differentiated ES cells deficient in G9a lacked > 90% of LOCKs compared to wild type differentiated ES cells (Fig. 3b, Supplementary Fig. 6, Supplementary Data 3). Nevertheless, rare LOCKs were found in G9a-deficient differentiated ES cells (Supplementary Fig. 6), indicating that H3K9Me2 is not entirely dependent on G9a. To exclude that LOCK loss in G9a-decicient cells was due to less differentiation compared to WT, we examined 6 lineage-specific markers using qRT-PCR in WT and G9a−/− cells, showing similar patterns (Supplementary Fig. 7). We then assayed expression of 10 genes within LOCKs lost in G9a-deficient ES cells, by qRT-PCR. Strikingly, 8 of 10 were over-expressed in G9a−/−comparing to WT (Supplementary Fig. 8), indicating that LOCK loss in G9a−/− was functionally related to gene regulation.
Unlike H3K9Me2, H3K9Me3 did not show LOCK-like distribution in ChIP-chip experiments on differentiated WT and G9a −/− ES cells, using the Mouse ENCODE array, and the locations of the H3K9Me3 marks did not overlap those of H3K9Me2 LOCKs. In the WT cells, only 8 of 157 H3K9Me3 marks were in H3K9Me2 LOCKs, which is underrepresented compared with a random pattern (P = 0.0013). Interestingly, however, in the differentiated G9a knockout cells, the few LOCKs that appeared in those cells were enriched for H3K9Me3 marks (22 of 175, P < 0.001; Supplementary Data 4), indicating that in the absence of G9a an independent mechanism provides silencing marks in which H3K9Me2 LOCKs and H3K9Me3 marks overlap. We cannot rule out that absence of H3K9me3 LOCKs could be related to transient methylation-demethylation cycles. We also examined 6 loci within H3K9Me2 LOCKs lost in differentiated G9a −/− cells, using individual H3K27Me3 ChIP-qPCR. Neither WT nor G9a −/− differentiated ES cells were enriched for H3K27Me3 in the region of these LOCKs (Supplementary Fig. 9).
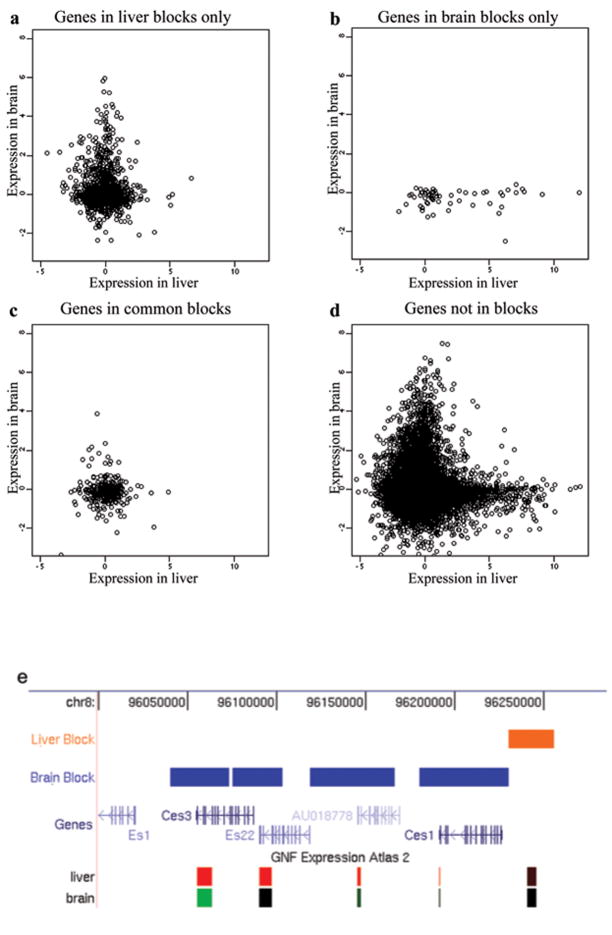
We then asked whether tissue-specific LOCKs were associated with differential gene expression in tissues, by comparing LOCK localization in liver and brain to an independent gene expression dataset8. Genes that lay within LOCKs in the liver but not in the brain were largely silenced in liver, but showed a broad range of expression in brain (P = 0.002, Fig. 4a). Similarly, genes in LOCKs in brain but not liver were largely silenced in brain, but showed a broad range of expression in liver (P = 10−9, Fig. 4b). Genes that lay within LOCKs in both tissues were silenced in both (Fig. 4c), while genes not in LOCKs in either liver or brain showed a broad range of expression in both tissues (Fig. 4d; P = 0.0002 and 0.005 for liver and brain, respectively). Genes within LOCKs and genes marked by H3K9Me2 individually were also found to show a similar relationship to gene silencing (Supplementary Table 3). Furthermore, tissue-specific silencing of genes in LOCKs often fell within functional gene clusters. For example, in a ~200 kb gene cluster belonging to the type-B carboxylesterase/lipase family, all of the genes that lay within LOCKs in the brain were silenced in the brain but highly expressed in the liver (Fig. 4e). Thus, H3K9Me2 LOCKs are strongly associated with tissue-specific gene silencing where they occur in gene regions.
Figure 4. Tissue-specific H3K9Me2 LOCKs are associated with differential gene expression in liver and brain.
Levels of gene expression in liver (X axis) and brain (Y axis) of genes in liver LOCKs only (a), genes in brain LOCKs only (b), genes in LOCKs common to liver and brain (c) and genes not in LOCKs in liver or brain (d). Genes that lay within LOCKs in the liver but not in the brain were largely silenced in liver, but showed a broad range of expression in brain (P = 0.002). Similarly, genes in LOCKs in brain but not liver, while fewer in number were largely silenced in brain, but showed a broad range of expression in liver (P = 10−9). Genes that lay within LOCKs in both tissues were silenced in both, while genes not in LOCKs in either liver or brain were broadly expressed in both tissues (P = 0.0002 and 0.005 for liver and brain, respectively). e, an example of a gene clusters in a tissue-specific LOCK. Expression levels of transcripts are based on the GNF Atlas track from UCSC genome browser. This region is marked by brain LOCKs, and correspondingly, the genes under LOCKs are silenced (green) in brain but highly expressed (red) in liver.
We performed functional annotation analysis with the DAVID tools9 on genes in tissue-specific LOCKs. In the genes within liver-specific LOCKs, all of the top 15 GO terms were related to non-liver functions, while the top 15 GO terms in brain LOCKs were associated with non-brain functions (Supplementary Tables 4, 5). Furthermore, genes in brain-specific LOCKs were preferentially expressed in the liver, and vice versa (P < 0.001, Supplementary Table 6), indicating that tissue-specific LOCKs were inversely related to tissue-specific function and gene expression.
We then investigated gene density of the LOCKs and CpG density of promoters of genes within the LOCKs. In undifferentiated ES cells, the gene density (genes per Mb) in LOCKs was 10.8, only slightly lower than non-LOCKs (12.8). However, in differentiated cells, the gene density of LOCKs was 4.4 in differentiated ES, 3.7 in liver and 5.4 in brain, much lower than those of non-LOCKs (16.6 in differentiated ES, 23.5 in liver and 15.2 in brain). Furthermore, the CpG density of the promoter regions of genes within LOCKs was relatively CpG-poor in all four cell types (Supplementary Fig. 10).
Finally, we performed a pilot experiment to ask whether LOCKs were abnormal in cancer. The fraction of genome within LOCKs in the cancer cell lines (3.0% in HCT116, 2.4% in HeLa) was dramatically less than that in heterogeneous placental tissue (10.6%) and homogeneous lymphoblastoid cells (11.1%). We validated this result by qPCR at three sites in these cells, as well as in two hematopoietic tumor lines, KG-1 and Ramos, which showed a pattern similar to the other tumor lines (Supplementary Fig. 11).
In summary, we have found that mammalian cells acquire large regions of H3K9 dimethylation during differentiation, which affect at least 30% of the genome. These regions are evolutionarily conserved, G9a-dependent, and linked to changes in gene expression in a tissue-specific manner, and they are substantially lost in human cancer cell lines. These results have important implications for the epigenetic regulation of gene expression. While organization of the genome into euchromatin and heterochromatin has been known for 80 years at the level of metaphase chromosomes10, the present data show that regional chromatin structure, over many hundreds of kilobases, is regulated during differentiation, and is associated with gene silencing over large regions. The term “Large Organized Chromatin K9-modifications” or LOCKs seems appropriate as they are much larger in scale than the relatively localized gene-associated modifications reported previously, and “organized” suggests a relationship to differentiation without implying cause and effect.
These results also strikingly complement the discovery of Guelen et al., of large nuclear lamina-associated domains (LADs) in humans11. 82% of the H3K9Me2 LOCKs identified in placenta in the present study overlap with the locations of LADs in fibroblasts identified by Guelen et al.11. While they did not observe enrichment of H3K9Me2, that study relied on published ChIP-chip data12. It is nevertheless that experiments to identify nuclear lamina-binding chromosome regions, or to identify regions of large scale heterochromatin, generate similar chromosomal maps. Regions not in LOCKs could also correspond to looped-out regions of actively transcribed genes suggested by chromosome conformation capture experiments13–15.
The observation of gain of LOCKs upon differentiation also supports the idea of a dramatic heterochromatinization during development, which is consistent with recent evidence that the chromatin of undifferentiated ES cells is less condensed and has higher plasticity compared to differentiated cells1,16–17. Our observation is also consistent with a recent report showing global transcription in undifferentiated ES cells compared to the differentiated counterparts18. The loss of LOCKs in cancer cells, compared to comparably proliferative lymphoblastoid cell lines, suggests an epigenetic mechanism (un-LOCKing?) for altered gene expression in cancer in addition to those already known. It will be interesting to further explore how LOCKs might relate generally to the altered phenotypic plasticity that underlies the epigenetic basis of human disease19.
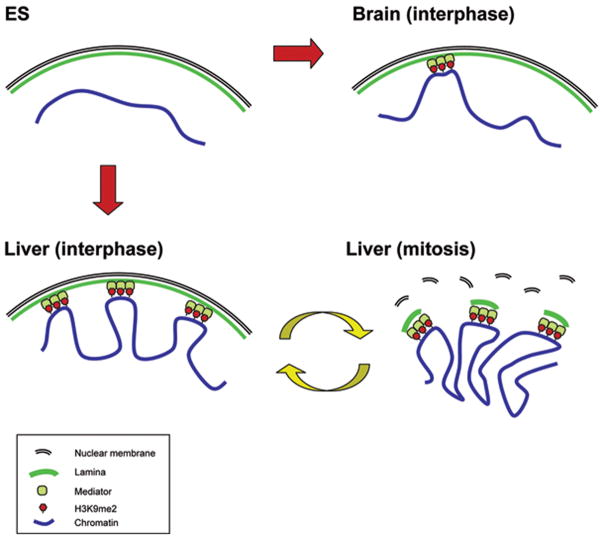
Previous reports indicate that gene-poor regions are closer to the nuclear periphery than gene-rich regions20–22. Our observations of low gene density of LOCKs in differentiated cells, together with the substantial overlap of LOCKs with lamin B-associated regions suggest a close link between LOCKs and nuclear architecture, as well as a substantial change of nuclear architecture upon differentiation. Furthermore, recent evidence suggests that the association of some genes with the nuclear membrane is reestablished after cell division23–24. Our data thus suggest a potential mechanism of the epigenetic memory of nuclear organization in differentiation (Fig. 5). In this model, in undifferentiated ES cells, only a small fraction of the genome is within LOCKs, and their nuclear positioning may be relatively apart from the nuclear membrane and show global expression. After differentiation, a much larger fraction of the genome is within LOCKs in a tissue-specific manner. The chromosome may be repositioned through the association of LOCKs and nuclear lamina, forming lineage-specific nuclear architectures. LOCKs could enhance and stabilize this interaction by providing the cooperative participation of multiple nearby sites to overcome the mechanical shearing and torsional forces on the chromosome that would inhibit its anchoring to the nuclear membrane. Genes within LOCKs would be largely or potentially silenced. Thus, the existence of relatively large complexes of post-translationally modified chromatin could facilitate nuclear lamina reassociation through mitosis maintaining nuclear architecture through cell division for repressed genomic regions. The causal mechanisms of these relationships, and in particular the mediators of interaction between LOCKs and the nuclear lamina, will be important questions for further study.
Figure 5. A model of epigenetic memory of cell type-specific higher-order chromatin structure mediated by H3K9Me2 LOCKs.
In undifferentiated ES cells (upper left), the genome is largely unmarked by H3K9Me2 LOCKs, chromosomal positioning is relatively apart from the nuclear membrane and shows global expression. In differentiated cells such as brain (upper right) and liver (lower left), large fractions of the genome are marked by H3K9Me2 LOCKs in a tissue-specific manner. The chromosome may be repositioned through the association of H3K9Me2 and nuclear lamina through unknown mediator proteins, forming lineage-specific nuclear architectures. During cell division, the lamina-LOCK association can be remembered in mitosis (lower right) and the nuclear architecture reestablished through a mechanism dependent on nuclear envelope breakdown and reformation23,24 and enhanced by contiguous sites of H3K9Me2 modification.
Methods Summary
Cell culture
ES cell lines including the G9a knockout were cultured based on the standard protocol of the ES core laboratory at Johns Hopkins University (see Full Methods for details). We differentiated ES cells for 18–24 days by removing leukemia inhibitory factor (LIF, Chemicon) from the medium and culturing in plates without feeder cells.
ChIP-on-chip
Chromatin was isolated without sonication or formalin cross linking, by digested with micrococcal nuclease (MNase, GE Healthcare, Piscataway, NJ), and then chromatin immunoprecipitation was performed with an antibody specific to H3K9Me2 (Abcam, Cambridge, MA). Details are provided in the supplementary methods. ChIP and input DNA were amplified, labeled by Cy5 and Cy3 respectively, and hybridized to NimbleGen tilling arrays as described4.
Data analysis
We first conducted within-array normalization to correct the probe sequence effects and position bias. Then we did partial quantile normalization to correct for bias across different arrays. The log2 ratios of Cy5 over Cy3 were smoothed by 15 kb sliding windows. LOCKs are defined as the genomic regions where smoothed values are above 97.5th quantile of log ratios in reference regions (see Full Methods for details). The pdf files containing all the pictures of LOCKs can be obtained through our website: http://rafalab.jhsph.edu/k9LOCKs/.
Supplementary Material
Note: Supplementary information is available on the Nature Genetics website.
Acknowledgments
We thank Sean Taverna, Karen Reddy, Rolf Ohlsson, and Carmen Sapienza for helpful discussions, and Sean Taverna and Winston Timp for assistance with illustration. This work was supported by NIH grant P50HG003233 to A.P.F.
Footnotes
Author Contributions
B.W. and A.P.F conceived the project. B.W. performed the experiments. H.W. analyzed the data with the guidance of R.I. Y.S. provided the mouse G9a knockout and control ES cell lines. A.P.F supervised the experiments and wrote the paper with B.W.
Author Information
Original ChIP-chip data are deposited at GEO (accession number pending). Correspondence and requests for material should be address to A.P.F. (afeinberg@jhu.edu)
References
- 1.Spivakov M, Fisher AG. Epigenetic signatures of stem-cell identity. Nat Rev Genet. 2007;8:263–71. doi: 10.1038/nrg2046. [DOI] [PubMed] [Google Scholar]
- 2.Atkinson SP, et al. Epigenetic marking prepares the human HOXA cluster for activation during differentiation of pluripotent cells. Stem Cells. 2008 doi: 10.1634/stemcells.2007-0497. [DOI] [PubMed] [Google Scholar]
- 3.Kim TH, et al. A high-resolution map of active promoters in the human genome. Nature. 2005;436:876–80. doi: 10.1038/nature03877. [DOI] [PMC free article] [PubMed] [Google Scholar]
- 4.Kim TH, et al. Analysis of the vertebrate insulator protein CTCF-binding sites in the human genome. Cell. 2007;128:1231–45. doi: 10.1016/j.cell.2006.12.048. [DOI] [PMC free article] [PubMed] [Google Scholar]
- 5.Wallace JA, Felsenfeld G. We gather together: insulators and genome organization. Curr Opin Genet Dev. 2007;17:400–7. doi: 10.1016/j.gde.2007.08.005. [DOI] [PMC free article] [PubMed] [Google Scholar]
- 6.Ward CM, Barrow K, Woods AM, Stern PL. The 5T4 oncofoetal antigen is an early differentiation marker of mouse ES cells and its absence is a useful means to assess pluripotency. J Cell Sci. 2003;116:4533–42. doi: 10.1242/jcs.00767. [DOI] [PubMed] [Google Scholar]
- 7.Tachibana M, et al. G9a histone methyltransferase plays a dominant role in euchromatic histone H3 lysine 9 methylation and is essential for early embryogenesis. Genes Dev. 2002;16:1779–91. doi: 10.1101/gad.989402. [DOI] [PMC free article] [PubMed] [Google Scholar]
- 8.Su AI, et al. A gene atlas of the mouse and human protein-encoding transcriptomes. Proc Natl Acad Sci U S A. 2004;101:6062–7. doi: 10.1073/pnas.0400782101. [DOI] [PMC free article] [PubMed] [Google Scholar]
- 9.Dennis G, Jr, et al. Integrated Discovery. Genome Biol. 2003;4:P3. [PubMed] [Google Scholar]
- 10.Heintz E. Das heterochromatin der moose. Jahresber Wiss Botanik. 1928;69:762–818. [Google Scholar]
- 11.Guelen L, et al. Domain organization of human chromosomes revealed by mapping of nuclear lamina interactions. Nature. 2008 doi: 10.1038/nature06947. [DOI] [PubMed] [Google Scholar]
- 12.O’Geen H, et al. Genome-wide analysis of KAP1 binding suggests autoregulation of KRAB-ZNFs. PLoS Genet. 2007;3:e89. doi: 10.1371/journal.pgen.0030089. [DOI] [PMC free article] [PubMed] [Google Scholar]
- 13.Zhao Z, et al. Circular chromosome conformation capture (4C) uncovers extensive networks of epigenetically regulated intra- and interchromosomal interactions. Nat Genet. 2006;38:1341–7. doi: 10.1038/ng1891. [DOI] [PubMed] [Google Scholar]
- 14.Cai S, Lee CC, Kohwi-Shigematsu T. SATB1 packages densely looped, transcriptionally active chromatin for coordinated expression of cytokine genes. Nat Genet. 2006;38:1278–88. doi: 10.1038/ng1913. [DOI] [PubMed] [Google Scholar]
- 15.Fraser P, Bickmore W. Nuclear organization of the genome and the potential for gene regulation. Nature. 2007;447:413–7. doi: 10.1038/nature05916. [DOI] [PubMed] [Google Scholar]
- 16.Pajerowski JD, Dahl KN, Zhong FL, Sammak PJ, Discher DE. Physical plasticity of the nucleus in stem cell differentiation. Proc Natl Acad Sci U S A. 2007;104:15619–24. doi: 10.1073/pnas.0702576104. [DOI] [PMC free article] [PubMed] [Google Scholar]
- 17.Wiblin AE, Cui W, Clark AJ, Bickmore WA. Distinctive nuclear organisation of centromeres and regions involved in pluripotency in human embryonic stem cells. J Cell Sci. 2005;118:3861–8. doi: 10.1242/jcs.02500. [DOI] [PubMed] [Google Scholar]
- 18.Efroni S, et al. Global transcription in pluripotent embryonic stem cells. Cell Stem Cell. 2008;2:437–47. doi: 10.1016/j.stem.2008.03.021. [DOI] [PMC free article] [PubMed] [Google Scholar]
- 19.Feinberg AP. Phenotypic plasticity and the epigenetics of human disease. Nature. 2007;447:433–40. doi: 10.1038/nature05919. [DOI] [PubMed] [Google Scholar]
- 20.Goetze S, et al. The three-dimensional structure of human interphase chromosomes is related to the transcriptome map. Mol Cell Biol. 2007;27:4475–87. doi: 10.1128/MCB.00208-07. [DOI] [PMC free article] [PubMed] [Google Scholar]
- 21.Cremer M, et al. Inheritance of gene density-related higher order chromatin arrangements in normal and tumor cell nuclei. J Cell Biol. 2003;162:809–20. doi: 10.1083/jcb.200304096. [DOI] [PMC free article] [PubMed] [Google Scholar]
- 22.Schneider R, Grosschedl R. Dynamics and interplay of nuclear architecture, genome organization, and gene expression. Genes Dev. 2007;21:3027–43. doi: 10.1101/gad.1604607. [DOI] [PubMed] [Google Scholar]
- 23.Reddy KL, Zullo JM, Bertolino E, Singh H. Transcriptional repression mediated by repositioning of genes to the nuclear lamina. Nature. 2008;452:243–7. doi: 10.1038/nature06727. [DOI] [PubMed] [Google Scholar]
- 24.Anderson DJ, Hetzer MW. The life cycle of the metazoan nuclear envelope. Curr Opin Cell Biol. 2008;20:386–92. doi: 10.1016/j.ceb.2008.03.016. [DOI] [PMC free article] [PubMed] [Google Scholar]
Associated Data
This section collects any data citations, data availability statements, or supplementary materials included in this article.
Supplementary Materials
Note: Supplementary information is available on the Nature Genetics website.


