Abstract
Purpose
To provide an analysis of conditional survival (CS) in rectal cancer patients. Cancer survival is typically reported in terms of survival from time of diagnosis. CS can provide improved prognostic information for patients surviving a given period after diagnosis.
Methods
Data from 36,321 rectal cancer patients diagnosed between 1988 and 1998 were analyzed using the Surveillance, Epidemiology, and End Results (SEER 17) database. Observed 5-year CS rates according to disease stage, age, sex, and race were calculated using the life-table method.
Results
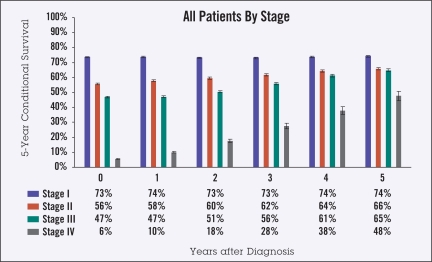
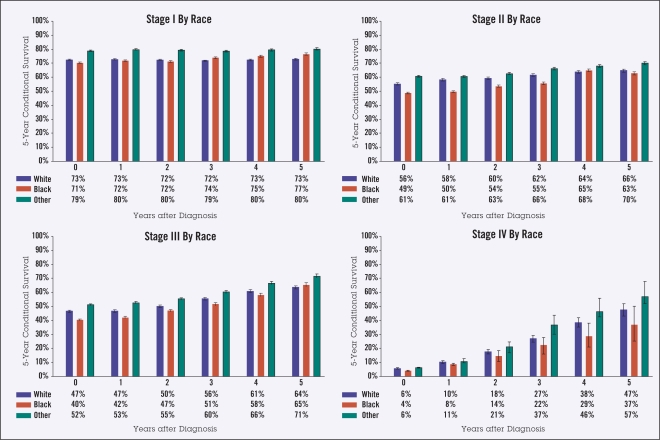
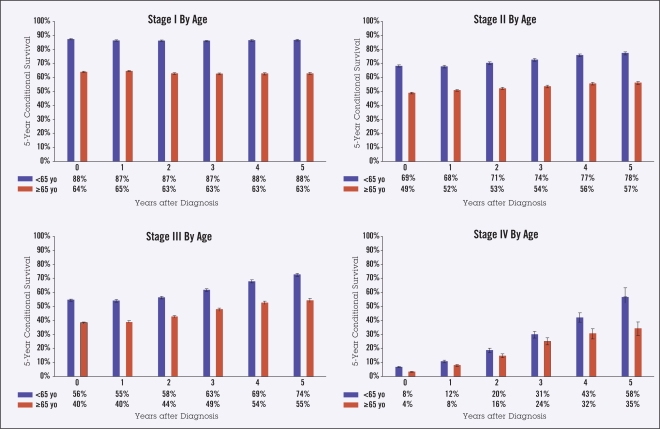
As survival from diagnosis increased from 0 to 5 years, the 5-year observed CS changed from 73% to 74% for stage I disease, 56% to 66% for stage II, 47% to 65% for stage III, and 6% to 48% for stage IV. Patients aged 65 years and over at diagnosis had lower CS than those under 65 years, both at diagnosis (45% vs. 61%) and at 5 years from diagnosis (59% vs. 81%). Men had slightly lower 5-year survival than women, both at diagnosis (50% vs. 53%) and after 5 years (68% vs. 71%). Black patients had slightly lower survival than white patients for nearly all time points and stages.
Conclusion
For rectal cancer patients who survive a given period of time after diagnosis, the largest increases in CS are in patients with advanced stage disease and for those under 65 years of age. CS can provide more accurate prognostic information for rectal cancer patients who survive a given period after diagnosis.
Survival estimates for cancer patients are most commonly reported as survival from the time of diagnosis. Survival probability changes, however, for patients who survive a given period of time after diagnosis, and their prognosis is more accurately described using conditional survival (CS). CS, which is based on the concept of conditional probability, accounts for the fact that hazard rates can change over time. For many cancer types, hazard rates decline at some point (eg, after the first few years) after diagnosis. For patients surviving past a given duration from diagnosis, subsequent prognosis can be quite different from prognosis at the time of diagnosis. CS can therefore be a more accurate measure of survival probability for many surviving cancer patients.
Conditional survival is of practical value to patients, providers, and researchers.1,2 Cancer patients who are followed for several years after their diagnosis may wish to know how their prognosis is changing over time. Indeed, if a cancer patient’s CS has risen to the extent that it is comparable to expected survival among the general population, it provides a more objective basis upon which to deem a patient “cured” of their disease. Providers can make use of CS information to more objectively determine appropriate frequency of follow-up visits and level of aggressiveness of surveillance testing. When designing clinical trials, clinical researchers may find CS useful in helping to determine sufficient follow-up times for trial end points. Although CS provides a more accurate quantification of prognosis for long-term survivors, it is important that this measure be used in combination with other estimates of mortality risk (eg, overall 5-year survival), since CS still provides only an estimate at a single point in time.
Several authors have reported studies on CS for various disease sites, including breast,3 colon,4 central nervous system,5,6 lung,7,8 and other advanced carcinomas.9 We have also reported CS analyses for various disease sites.10–24 To our knowledge, however, no published data exist on CS patterns in rectal carcinoma. The specific aim of this project was to investigate the CS of rectal cancer patients in the National Cancer Institute’s Surveillance, Epidemiology, and End Results (SEER 17) dataset.25
METHODS
Definition of Conditional Survival
Conditional survival is the probability of surviving an additional y years, given that the person has already survived x years, or CS(y/x). When S(t) is the traditional actuarial life-table survival at time t, CS can be expressed as:
For example, to compute the 5-year CS for a patient who has already survived 2 years from diagnosis, the survival at 5 + 2 years, S(7), is divided by the survival at 2 years, S(2). When a survival curve has a changing hazard rate over time, this will be reflected as a change in CS as more time elapses from the time of diagnosis.
Data Selection Criteria
The SEER program25 is a population-based cancer registry covering approximately 26% of the US population across several disparate geographic regions and is the largest publicly available domestic cancer dataset. SEER program registries collect data on patient demographics, cancer type and site, stage, first course of treatment, and follow-up vital status.
Using the SEER 17 database submitted in November 200525 and the SEER*Stat 6.2.4 software,26 we analyzed survival data from all patients diagnosed with rectal cancer between 1988 and 1998. Patients were limited to those diagnosed after 1988, since this was the earliest year that SEER cases were staged according to American Joint Committee on Cancer TNM staging criteria.27 Data through December 2003 were used to ensure a minimum 5 years of follow-up. Patients were selected who had a “site recode” data field of “Rectum and Rectosigmoid Junction.” We used the Case Selection options in SEER*Stat to restrict cases to “Actively Followed,” “Malignant Behavior,” “Exclude All Death Certificate Only and Autopsy Only,” and “Exclude Second and Later Primaries.”
Data Analysis
Conditional survival probabilities were calculated using SEER*Stat’s actuarial life-table method. We computed observed 5-year CS by disease stage at diagnosis, and also grouped results by age at diagnosis (< 65 years vs. ≥ 65 years), sex, and race (white, black, or other).
RESULTS
A total of 36,321 rectal cancer patients were included in the analysis. Disease stage was I in 12,608 (35%) patients, II in 9,009 (25%), III in 8,561 (23%), and IV in 6,143 (17%). Numbers of patients in each stage according to sex, age, and race are shown in Table 1.
Table 1.
Patient characteristics, by stage. (N=36,321)
| No. Patients (%) | ||||||||
|---|---|---|---|---|---|---|---|---|
| Stage I | Stage II | Stage III | Stage VI | |||||
| Age < 65 | 4,843 | (38) | 3,153 | (35) | 3,778 | (44) | 2,527 | (41) |
| Age ≥ 65 | 7,765 | (62) | 5,856 | (65) | 4,783 | (56) | 3,616 | (59) |
| Men | 6,866 | (54) | 5,177 | (57) | 4,871 | (57) | 3,625 | (59) |
| Women | 5,742 | (46) | 3,832 | (43) | 3,690 | (43) | 2,518 | (41) |
| White | 10,475 | (83) | 7,613 | (85) | 7,026 | (82) | 5,084 | (83) |
| Black | 900 | (7) | 638 | (7) | 611 | (7) | 547 | (9) |
| Other | 1233 | (10) | 758 | (8) | 924 | (11) | 512 | (8) |
| Totals | 12,608 | (100) | 9,009 | (100) | 8,561 | (100) | 6,143 | (100) |
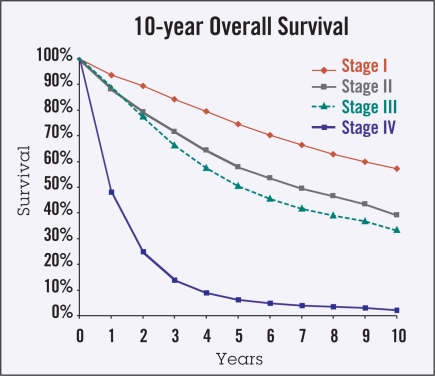
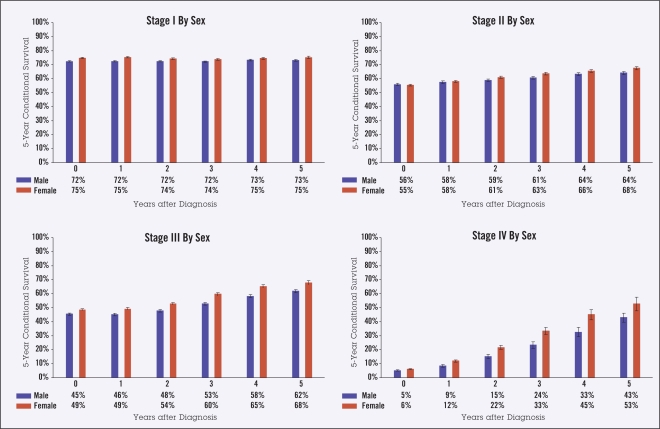
Ten-year actuarial overall survival data (Figure 1) were used to calculate 5-year observed CS in the categories of stage, age, gender, and race (Figures 2–5). Overall, though higher-stage patients had lower CS at diagnosis compared to lower-stage patients, higher-stage patients had greater increases in CS as more time elapsed from diagnosis (from 73% to 74% for stage I disease, 56% to 66% for stage II, 47% to 65% for stage III, and 6% to 48% for stage IV) (Figure 2). Patients 65 years of age and older had lower CS than those under age 65 at all times following diagnosis, showing an average difference of 45% vs. 61% at diagnosis and maintaining a difference of 59% vs. 81% at 5 years from diagnosis. This difference appeared to increase over time for stage IV patients (Figure 3). For all stages of disease, men had slightly lower 5-year survival than women, both at diagnosis (50% vs. 53%) and after 5 years (68% vs. 71%). The largest differences by sex were in stage IV patients (Figure 4). The largest differences according to race were in stage IV disease, with black patients having lower CS compared to white and “other” patients, particularly with greater time from diagnosis (Figure 5). Patients in the “other” category with stage IV disease showed the greatest improvement in CS over time.
Figure 1.
Ten-year Kaplan-Meier overall survival curves by disease stage. These data were used to calculate the 5-year observed conditional survival probabilities.
Figure 2.
Five-year observed conditional survival (CS) by disease stage at diagnosis in all patients. Error bars show standard error.
Figure 5.
Five-year observed conditional survival (CS) by race according to disease stage. Error bars show standard error.
Figure 3.
Five-year observed conditional survival (CS) by age < 65 and age > 65 years according to disease stage. Error bars show standard error.
Figure 4.
Five-year observed conditional survival (CS) by sex according to disease stage. Error bars show standard error.
DISCUSSION
As time progresses from diagnosis, CS provides more accurate prognostic information than more commonly reported static survival statistics, such as 5-year overall survival. Patient risk is not static, however, and the measure of CS reflects this fact by quantifying changing risk over time.1,9 The current analysis showed that CS increased with increasing time of survival from diagnosis in rectal cancer patients with higher stages of disease, with this trend being evident in analyses according to age, gender, and race.
Conditional survival information is potentially of great interest to patients, clinicians, and researchers. When patients inquire about their current prognosis, they should be given an accurate risk assessment that accounts for time already survived since diagnosis. The ability of patients to more realistically quantify their change in prognosis over time may be of great psychologic/emotional benefit. Accordingly, every effort should be made to communicate this changing risk profile in terms that are meaningful to the patient. Five-year CS probability is an easily understandable measure that can be used to convey a patient’s current risk profile.
Clinicians can also make use of CS data to implement a more evidence-driven approach to planning post-therapy surveillance based on a patient’s changing risk. Physicians often taper follow-up visit frequency after 2 to 3 years, but often do so without evidence to support the practice. The determination of optimum follow-up testing frequency and duration should be based on the patient’s disease risk, rather than simply on custom or tradition. For instance, the CS data presented here indicate that survival for patients with stage III rectal cancer who survive more than 3 years from diagnosis is comparable to that at diagnosis for patients with stage II disease. Consequently, if one uses a particular follow-up schedule for stage II patients for x years, stage III patients should be similarly followed for x + 3 years.
In clinical trial design, study duration is predicted, in part, based on the estimated length of follow-up needed to see a significant result in a given end point. These study duration estimates have important implications regarding projected economic costs of a trial and timeliness in answering questions the trial is designed to ask. It has been proposed that surrogate end points for overall survival, such as disease-free survival, are appropriate in some situations —eg, as a means to accelerate the completion of adjuvant clinical trials.28 Examination of how CS data change over time may be an important element in ascertaining an appropriate trial follow-up time since it effectively quantifies the remaining risk to a patient after a given survival time.
It is imperative that physicians characterize, interpret, and communicate patient risk profiles as accurately as possible. Models such as Adjuvant! Online29 and Memorial Sloan-Kettering Cancer Center risk nomograms30–34 are very useful tools for initial risk stratification. We currently are investigating the incorporation of a CS component into a similar predictive model that would allow re-evaluation of a patient’s prognosis as it changes over time. Use of such a model could improve disease management by allowing follow-up practices to be based on patients’ changing risk.
Conditional survival also may assist in detecting differences in subgroup survival patterns.5,9 In other studies of CS, it has been found that patients with poorer initial prognoses exhibit the greatest increases in CS as they survive for longer periods of time from diagnosis.3,5,7,8 The current analysis indicates that this is also true for rectal cancer, with CS appearing to increase most for patients under 65 years of age with advanced-stage disease.
Although CS generally increased over time for all patient groups examined in this study, CS increases are not necessarily observed for all cancer types. In analyses of disease at other sites, a CS decline has been observed for certain population subsets, such as the elderly, patients with unfavorable tumor histology, and those with poor performance status.7,8,18 Consequently, CS trends over time cannot be predicted from point estimates made at the time of diagnosis, such as 5-year overall survival. A full Kaplan-Meier survival plot must be examined in order to determine the trend of CS over time; in essence, the shape of the Kaplan-Meier plot influences whether CS increases or decreases over time. CS calculations yield convenient numeric values that provide snapshots of risk dynamics over time in a manner readily comprehended by both providers and patients.
The SEER dataset, while somewhat limited geographically, is the best large-scale pool of cancer patient data available, and its use allows us to make reasonable estimates of CS that are generally applicable for the US population. Nonetheless, several limitations of the analysis in this regard must be noted. Increased cohort size comes at the cost of increased treatment heterogeneity. Treatment data in SEER are limited (ie, no chemotherapy regimen or radiotherapy dose is recorded), so we did not attempt a subanalysis by treatment modality. Also, the sample size for some subgroups is small, as is reflected in the larger standard error value for findings in those subgroups, including black patients with stage IV disease. This precludes our ability to make more definite generalizations regarding the observed differences between some subgroups.
Since SEER does not include information on disease recurrence and since cause of death information therein is not always reliable, we are unable to analyze other important end points, such as time to recurrence and disease-free survival. Finally, historic survival data collected over an extended period of time may not reflect current practices in oncology.
Conditional survival should be considered within the individual context of patient care, where specific risk factors must be carefully considered. Although CS provides a more accurate quantification of prognosis for long-term survivors, it is important that this measure be used in combination with other estimates of mortality risk (such as 5-year overall survival), since it still provides only an estimate at a single point in time.
In summary, our data show that CS for rectal cancer patients changes over time. The greatest changes in CS occur according to stage, but change also is observed according to age, gender, and race. We hope that CS calculations will become more common in cancer reporting, and that extrapolation of CS from other epidemiologic and clinical trial data will permit improved risk assessment for rectal cancer patients.
Footnotes
Disclosures of Potential Conflicts of Interest
The authors disclosed no potential conflicts of interest.
REFERENCES
- 1.Henson DE, Ries LA. On the estimation of survival. Semin Surg Oncol. 1994;10:2–6. doi: 10.1002/ssu.2980100103. [DOI] [PubMed] [Google Scholar]
- 2.Gloeckler Ries LA, Reichman ME, Lewis DR, et al. Cancer survival and incidence from the Surveillance, Epidemiology, and End Results (SEER) program. Oncologist. 2003;8:541–552. doi: 10.1634/theoncologist.8-6-541. [DOI] [PubMed] [Google Scholar]
- 3.Henson DE, Ries LA, Carriaga MT. Conditional survival of 56,268 patients with breast cancer. Cancer. 1995;76:237–242. doi: 10.1002/1097-0142(19950715)76:2<237::aid-cncr2820760213>3.0.co;2-j. [DOI] [PubMed] [Google Scholar]
- 4.Merrill RM, Henson DE, Ries LA. Conditional survival estimates in 34,963 patients with invasive carcinoma of the colon. Dis Colon Rectum. 1998;41:1097–1106. doi: 10.1007/BF02239430. [DOI] [PubMed] [Google Scholar]
- 5.Davis FG, McCarthy BJ, Freels S, et al. The conditional probability of survival of patients with primary malignant brain tumors: surveillance, epidemiology, and end results (SEER) data. Cancer. 1999;85:485–491. [PubMed] [Google Scholar]
- 6.Hwang SL, Yang YH, Lieu AS, et al. The conditional survival statistics for survivors with primary supratentorial astrocytic tumors. J Neurooncol. 2000;50:257–264. doi: 10.1023/a:1006484220764. [DOI] [PubMed] [Google Scholar]
- 7.Merrill RM, Henson DE, Barnes M. Conditional survival among patients with carcinoma of the lung. Chest. 1999;116:697–703. doi: 10.1378/chest.116.3.697. [DOI] [PubMed] [Google Scholar]
- 8.Skuladottir H, Olsen JH. Conditional survival of patients with the four major histologic sub-groups of lung cancer in Denmark. J Clin Oncol. 2003;21:3035–3040. doi: 10.1200/JCO.2003.04.521. [DOI] [PubMed] [Google Scholar]
- 9.Kato I, Severson RK, Schwartz AG. Conditional median survival of patients with advanced carcinoma: surveillance, epidemiology, and end results data. Cancer. 2001;92:2211–2219. doi: 10.1002/1097-0142(20011015)92:8<2211::aid-cncr1565>3.0.co;2-w. [DOI] [PubMed] [Google Scholar]
- 10.Wang SJ, Luh JY, Thomas CR. Conditional survival of breast cancer patients. American Society of Breast Diseases, 29th Annual Symposium; April 14–16, 2005; Las Vegas, NV. [Google Scholar]
- 11.Wang SJ, Luh JY, Thomas CR. Conditional survival of ovarian cancer patients. American Radium Society, 87th Annual Meeting; April 30–May 4, 2005; Barcelona, Spain. [Google Scholar]
- 12.Wang SJ, Luh JY, Thomas CR. Conditional survival of patients with rectal cancer. Digestive Diseases Week; May 14–19, 2005; Chicago, IL. [Google Scholar]
- 13.Fuller CD, Wang SJ, Thomas CR. Conditional survival of gallbladder adenocarcinoma treated with radiotherapy: analysis from the SEER database. American Society for Therapeutic Radiology and Oncology, 47th Annual Meeting; October 16–20, 2005; Denver, CO. [Google Scholar]
- 14.Wang SJ, Luh JY, Fuller CD, et al. Impact of ethnicity on conditional survival of breast cancer patients: analysis from the SEER database. 28th Annual San Antonio Breast Cancer Symposium; December 8–11, 2005; San Antonio, TX. [Google Scholar]
- 15.Wang SJ, Fuller CD, Luh JY, et al. An analysis from the SEER database of conditional survival for gastric adenocarcinoma. ASCO Gastro-intestinal Cancers Symposium; January 26–28, 2006; San Francisco, CA. (abstr 25) [Google Scholar]
- 16.Wang SJ, Luh JY, Thomas CR. Conditional survival of prostate cancer patients. ASCO Prostate Cancer Symposium; February 24–26, 2006; San Francisco, CA. (abstr 277) [Google Scholar]
- 17.Klish DS, Wang SJ, Kimler BF, et al. Improved prognosis with time after diagnosis for patients with anal cancer. American Radium Society, 88th Annual Meeting; May 6–10, 2006; Wailea, HI. [Google Scholar]
- 18.Wang SJ, Zamboni BA, Thomas CR, et al. Conditional survival for patients with colon cancer: an analysis of National Surgical Adjuvant Breast and Bowel Project (NSABP) trials C-03 through C-06. 2006 ASCO Annual Meeting Proceedings. J Clin Oncol. 2006;24:18S. (abstr 6005) [Google Scholar]
- 19.Thomas CR, Fuller CD, Wang SJ. Conditional survival in gallbladder carcinoma: results from the SEER 11 dataset. 2006 ASCO Annual Meeting Proceedings. J Clin Oncol. 2006;24:18S. (abstr 4130) [Google Scholar]
- 20.Fuller CD, Wang SJ, Goldwein JW, et al. Conditional survival probability for head and neck squamous cell cancer: results from the SEER 11 dataset. 2006 ASCO Annual Meeting Proceedings. J Clin Oncol. 2006;24:18S. (abstr 5519) [Google Scholar]
- 21.Wang SJ, Fuller CD, Luh JY, et al. Older adolescents and young adults with cancer: conditional survival deficit. American Society for Therapeutic Radiology and Oncology, 48th Annual Meeting; November 5–9, 2006; Philadelphia, PA. [Google Scholar]
- 22.Wang SJ, Luh JY, Fuller CD, et al. Geographic variation in conditional survival for breast cancer patients: a SEER database analysis. 29th Annual San Antonio Breast Cancer Symposium; December 14–17, 2006; San Antonio, TX. [Google Scholar]
- 23.Wang SJ, Fuller CD, Thomas CR. Ethnic disparities in conditional survival of patients with nonsmall cell lung cancer. J Thorac Oncol. 2007;2:180–190. doi: 10.1097/JTO.0b013e318031cd4e. [DOI] [PubMed] [Google Scholar]
- 24.Kim E, Wang SJ, Fuller CD, et al. Conditional survival for patients with thymic carcinoma from the SEER database. American Thoracic Society International Conference; May 18–23, 2007; San Francisco, CA. [Google Scholar]
- 25.National Cancer Institute Surveillance, Epidemiology, and End Results (SEER) Program: (www.seer.cancer.gov) SEER*Stat Database: Incidence — SEER 17 Regs Public-Use, Nov 2005 Sub (1973–2003 varying), National Cancer Institute, DCCPS, Surveillance Research Program, Cancer Statistics Branch, released April 2006, based on the November 2005 submission.
- 26.National Cancer Institute Surveillance, Epidemiology, and End Results (SEER) Program: SEER*Stat software version 6.2.4. Available at: http://www.seer.cancer.gov/seerstat
- 27.American Joint Committee on Cancer: AJCC Cancer Staging Manual (ed 3),1988. Available at: http://www.cancerstaging.org/products/ajccproducts.html Accessed June 20, 2006.
- 28.Gill S, Sargent D. End points for adjuvant therapy trials: has the time come to accept disease-free survival as a surrogate end point for overall survival? Oncologist. 2006;11:624–629. doi: 10.1634/theoncologist.11-6-624. [DOI] [PubMed] [Google Scholar]
- 29.Ravdin P.Adjuvant! OnlineAvailable at: http://www.adjuvantonline.com Accessed June 20, 2006
- 30.Memorial Sloan-Kettering Cancer Center: Prediction Tools. Available at: http://www.mskcc.org/nomograms Accessed June 20, 2006
- 31.Kattan MW. Nomograms are superior to staging and risk grouping systems for identifying highrisk patients: preoperative application in prostate cancer. Curr Opin Urol. 2003;13:111–116. doi: 10.1097/00042307-200303000-00005. [DOI] [PubMed] [Google Scholar]
- 32.Van Zee KJ, Manasseh DM, Bevilacqua JL, et al. A nomogram for predicting the likelihood of additional nodal metastases in breast cancer patients with a positive sentinel node biopsy. Ann Surg Oncol. 2003;10:1140–1151. doi: 10.1245/aso.2003.03.015. [DOI] [PubMed] [Google Scholar]
- 33.Diblasio CJ, Kattan MW. Use of nomograms to predict the risk of disease recurrence after definitive local therapy for prostate cancer. Urology. 2003;62(suppl 1):9–18. doi: 10.1016/j.urology.2003.09.029. [DOI] [PubMed] [Google Scholar]
- 34.Brennan MF, Kattan MW, Klimstra D, et al. Prognostic nomogram for patients undergoing resection for adenocarcinoma of the pancreas. Ann Surg. 2004;240:293–298. doi: 10.1097/01.sla.0000133125.85489.07. [DOI] [PMC free article] [PubMed] [Google Scholar]


