Abstract
The high hemeozoin (beta-hemeatin) content of Plasmodium falciparum lysates imposes severe limitations on the analysis of the malarial proteome, in particular compromising the loading capacities of two-dimensional gels. Here we report on the adaptation of a recently developed solution-phase isoelectric focusing-based fractionation technique as a prefractionation strategy for efficient containment of hemeoglobin-derived products and complexity reduction, to facilitate the high-resolution gel-based quantitative analysis of plasmodial lysates.
Keywords: malaria, proteomics, serine hydroxymethyltransferase, two-dimensional gel electrophoresis, quantitation
Introduction
The post-genomic era has seen tremendous technological developments in the field of proteomics and mass spectrometry. However, despite the availability of a completed genome sequence for Plasmodium falciparum,1 many of these advances remain under-utilized in malaria research. The intracellular erythrocytic habitat of this lethal eukaryotic parasite results in lysates containing a high abundance of the charged hemeoglobin breakdown product hemeozoin, a beta-hemeatin based, hydrogen-bonded crystalline polymer,2 together with globin-derived molecules at different stages of proteolysis. This complex mixture we subsequently refer to for simplicity as hemeoglobin-derived products (HDP). In combination with high levels of contaminant host cell proteins and albumin (from the culture medium), these interfere with downstream processing, limiting quality spectral data acquisition to a comparatively small subset of proteins.3,4 Furthermore, the parasitophorous vacuolar membrane enclosing the intra-erythrocytic parasite and the associated tubovesicular network render a high proportion of the plasmodial proteome to be membrane associated, hydrophobic and hence poorly soluble in the absence of chaotropes.5 Parasite-specific optimization of standard proteomic methodologies is thus required if the full potential of recent technological advances is to be harnessed in this biological system. The resultant expansion of protein profiling abilities would enable the analysis and quantitative mining of the hitherto inaccessible, but functionally important, intermediate to low abundance components of the plasmodial proteome.
Accurate quantitation of differential protein expression is a crucial goal in post-genomics malaria research. We have previously described the first SILAC strategy for plasmodial proteins3 using isoleucine as a highly efficient labeling amino acid. The inability of the parasite to synthesize isoleucine, its absence in human hemeoglobin (the primary source of extracellular amino acids for the parasite), and its high abundance in the plasmodial proteome makes it an ideal label. However, application of this technique to the wider plasmodial proteome has been limited, in part due to its reliance on routine two-dimensional gel electrophoresis (2DE) for protein profiling and the concomitant restriction of analysis to highly abundant proteins of a limited molecular weight and pI range. Despite the emergence of promising alternative or complementary techniques based on various physicochemical properties of proteins (size, charge, solubility, hydrophobicity),6-9 2DE remains the most widely used protein profiling strategy for quantitative analysis of proteomes.10,11 Although modifications aimed at expansion of the profiling capabilities of 2DE (e.g., large format gels, narrow range pI gradients, improved sample preparation and staining protocols) have significantly increased resolution and throughput,10-12 quantitative mining of intermediate to low abundance proteins remains elusive. Furthermore, with P. falciparum, the problems pertaining to the specific nature of the lysate must be overcome to achieve wider quantitative profiling. Our previously developed protocol for plasmodial 2DE, particularly the use of a novel thiourea/sonication approach that significantly improves solubilization of plasmodial proteins,3 has now been corroborated by others.4 However, this protocol also destabilises the hemeozoin polymer complexes, resulting in contaminating HDP of varying molecular weights that hinder downstream applications. Importantly, we find that the “smear”, induced by the HDP and observed in 2D gels, is confined to a pI range of approximately pH 7-9 (Figure 1). Thus, an additional fractionation step based on isoelectric focusing (IEF) affords an attractive option for both compartmentalization of these products and complexity reduction, permitting concentration and thus much higher sample loading during subsequent 2DE.
Figure 1.
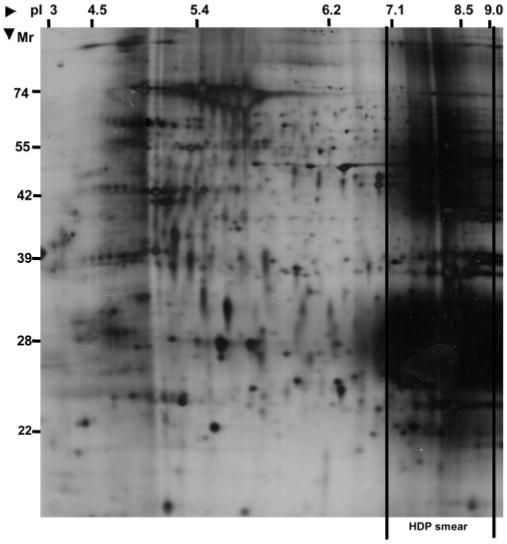
2D gel image of total P. falciparum lysate run on a wide range pI3-10 immobiline dry strip for first dimensional focusing. The approximate molecular weights and pI values were derived from protein identifications of the gel spots. Significant smearing resulting from the hemeoglobin-derived products (HDP) is seen in the basic region of the gel (pI 7.0-9.0). The high abundance of these products, while masking the basic plasmodial proteome, also limits protein loading capacities, resulting in poor spot intensity and resolution in other regions of the gel.
The recent development of an in-solution MicroSol IEF procedure,13-15 as implemented in the commercially available ZOOM-IEF fractionator, offers a flexible off-line system which could aid in the compartmentalization/removal of HDP from plasmodial samples. The limited number of fractions produced (<7) and minimal cross-contamination between fractions potentially make it an ideal front-end strategy for gel-based quantitative analysis of such samples. Here we demonstrate that this is the case, presenting an optimized proteomics workflow incorporating MicroSol IEF liquid fractionation coupled with 2DE and one-dimensional gel electrophoresis (1DE), enabling expanded protein profiling and quantitation of the plasmodial proteome. We validate the efficacy of the proposed workflow using the folate pathway enzyme serine hydroxymethyltransferase (SHMT),16,17 a protein known to be present in low to intermediate abundance, but the most highly expressed of the folate enzymes.18,19 Detailed characterization of this essential pathway at the level of protein expression has been impeded by the low intracellular abundance of its component enzymes. Having a theoretical pI of 8.29, the predicted position of SHMT on a 2D gel coincides with the HDP smear. This, coupled with its relatively low abundance in plasmodial lysates, makes it an ideal model protein to test the development of an optimized methodology to overcome these major problems and enable the reproducible identification and quantitation of SHMT and proteins of similar abundance from such lysates.
Materials and Methods
Parasite Culture
For routine culture, cloned HB3 parasite lines20 were grown asynchronously at 37 °C as described,21 in O+ erythrocytes in standard RPMI 1640 medium (Invitrogen) with 0.5% Albumax I (Invitrogen), 5 μg/mL hypoxanthine and supplements.
Heavy Isotope Labeling of Parasite Lines
In vitro parasite cultures were labeled with heavy isoleucine as described.3 Briefly, asynchronous P. falciparum cultures preincubated for 24 h in custom RPMI 1640 medium devoid of isoleucine (Invitrogen) were supplemented (30 mg/L) with either normal isoleucine (Sigma) or 13C6, 15N1-isoleucine (≥98% isotopic purity; Sigma Aldrich), for a further period of 72 h. Equal volumes of parallel labeled and unlabeled asynchronous cultures derived from a single parent culture were pooled for downstream analysis.
Sample Preparation
P. falciparum parasites were released from infected erythrocytes by lysis in 0.05% saponin in phosphate-buffered saline (PBS) and cold centrifugation at 8000 g for 5 min. The pellets were washed thrice in ice-cold PBS and spun at 12 000 g for 5 min. The pellet from a 90 mL culture at 5% hemeatocrit and ∼5% parasitaemia was resuspended in 5 mL of lysis buffer (8 M urea, 2 M thiourea, 2% CHAPS, 1% dithiothreitol (DTT)) and sonicated on dry ice using four bursts of 15 μm amplitude for 8 s interspersed with 30 s of cooling. Supernatants were clarified with centrifugation twice for 30 min at 12 000 g and 4 °C. Inclusion of protease inhibitors failed to significantly improve protein yields when all procedures were carried out at 4 °C.
Prefractionation Using the MicroSol-IEF Fractionator
A ZOOM-IEF fractionator (Invitrogen) was used for in-solution microscale fractionation. Five milliliters of clarified plasmodial lysate (∼0.6 mg/mL of total protein) with 0.2% carrier ampholytes (pH 3-10) was fractionated in a six chamber device separated by porous immobiline gel membranes with pH values of 3.0, 4.6, 5.4, 6.2, 7.0, and 10.0 (Invitrogen). Parasite lysate (680 μL; ∼0.4 mg) was loaded into each sample well. Anode and cathode chambers were loaded with 17 mL of the appropriate electrode buffer according to the manufacturer’s instructions (Anode buffer pH 3.0: urea 8.4 g, thiourea 3.0 g, Novex anode buffer (Invitrogen) 3.3 mL, made up to 20 mL with MilliQ H2O. Cathode buffer pH 10.4: urea 8.4 g, thiourea 3.0 g, Novex cathode buffer (Invitrogen) 2.0 mL, made up to 20 mL with MilliQ H2O). Fractionations were conducted at 100 V for 30 min, 200 V for 90 min followed by 600 V for 90 min at a current not exceeding 2 mA. The fractionated samples were retrieved via the port on each fraction chamber, diluted to twice their volume in MilliQ H2O and precipitated with four volumes of ice-cold acetone at −20 °C overnight. After centrifugation, air-dried fractionated protein precipitates were stored at −20 °C until further use. For optimal protein retrieval, a second wash of the sample chambers in 500 μL lysis buffer for 10 min on a rotary shaker was employed. Estimation of protein content was carried out using the Bradford protein assay (BioRad Laboratories).
ID and 2D Gel Electrophoresis
For 1DE analyses, routine 7% w/v SDS-PAGE vertical mini gels with 4% w/v stacking gels were used to separate fractions according to molecular weight. Protein precipitated from an equivalent of 50 μL of fractionated lysate was resuspended in 25 μL of SDS-containing sample buffer (60 mM Tris-HCl pH 6.8, 2% w/v SDS, 1% CHAPS, 3% v/v mercaptoethanol, 10% glycerol and a trace of bromophenol blue), heated at 95 °C for 5 min and loaded onto a single lane. Gels were stained with Colloidal Coomassie (0.1% Coomassie G-250, 10% (NH4)2SO4, 20% C2H5OH, 3% H3PO4) prior to analysis.
Acetone precipitated proteins from fraction pI 4.6-5.4 were used to investigate sensitivity and resolution of the downstream 2DE. Pooled fractions from three MicroSol-IEF runs were resuspended in 500 μL lysis buffer with 1% carrier ampholyte (pI 4.5-5.5), and applied to matched single pI Zoom Immobiline Drystrip gels (pI 4.5-5.4, 24 cm: Amersham). After a 10 h voltage rehydration at 30 V using the IPGphor isoelectric focusing system at 20 °C, the voltage was gradually ramped up in a step-and-hold manner to 8000 V over the next 5 h. The voltage was maintained at 8000 V for a total of 120 000 Vh. The strips were reduced and alkylated as described3 prior to loading onto second dimension 12% acrylamide gels.
Gels were fixed in 50% methanol, 15% acetic acid and stained using a mass spectrometry-compatible silver stained protocol described previously.3 Briefly, the gels were washed thrice in 50% ethanol for 30 min each, followed by a brief rinse (60 s) in 0.02% Na2S2O3. The gels were rinsed twice in MilliQ water and placed in cold 0.1% AgNO3 for 20 min. After three rinses in MilliQ water, 500 mL of developing solution was added (60 g/L Na2CO3, 5 mg/L Na2S2O3, 500 μL formaldehyde). The reaction was stopped with 300 mL of fixing solution and the gels stored at room temperature in 20% ethanol, 2% glycerol. MilliQ water and ultrapure-grade reagents were used throughout the procedure to minimize contamination of mass spectra.
In-Gel Trypsin Digestion
For analysis of the 1D Coomassie stained gels, bands were cut out (1or 3 mm pixels), washed twice in MilliQ H2O for 15 min and equilibrated for 30 min each in 1% DTT and 4.5% iodoacetamide in buffer (50 mM Tris-HCl pH 6.8, 6 M urea, 30% glycerol, 2% SDS) to ensure reduction and carbamidomethylation of cysteine residues. The gel pixels were subjected to two cycles of dehydration with 50% acetonitrile followed by rehydration with 50 mM NH4HCO3 for 15 min per cycle and digested overnight at 37 °C in ∼30 μL of sequencing grade trypsin (Promega; 1 μg in 100 μL of 50 mM NH4HCO3). The resulting tryptic peptides were extracted with two incubations in 50 μL of 70% acetonitrile for 30 min each, followed by 90% acetonitrile for 15 min. The supernatants were pooled and dried in a vacuum centrifuge. When silver-stained 2D gels were used, the excised spots were destained in 100 μL of freshly prepared 30 mM K3Fe(CN)6, 30 mM Na2S2O3 prior to the initial dehydration-rehydration cycles. Sample loss and plasticizer contamination of mass spectra was significantly minimized with the use of siliconized microfuge tubes/pipet tips and Teflon coated storage bottles.
Mass Spectrometric Analyses
Mass spectrometric analyses were carried out by matrix-assisted laser desorption/ionization (MALDI-TOF, Kratos Axima CFR) and nanoflow-liquid chromatography/electrospray ionization (LC–MS/MS, Bruker Esquire 3000plus Ion Trap). Processing of peptide mixtures for MALDI-TOF analysis was as previously described.22 The instrument was used in positive ion reflectron mode and calibrated using a series of four commercially available external calibrants (ProteoMass kit, Sigma: bradykinin fragment 1-7, monoisotopic mass 757.3997 Da; human angiotensin II, 1046.5423 Da; human ACTH fragment 18-39, 2465.1989 Da).
The LC–MS/MS analysis was carried out as described.3 Briefly, peptides were separated by chromatography on a 75 μm × 15 cm PepMap nanocolumn (LC Packings) at a flow rate of 250 nl/min using a gradient increasing from 5 to 95% acetonitrile in 0.1% formic acid over 60 min. The column effluent was sprayed directly into the ion trap which was set to scan the m/z range from 300 to 1500 in positive ion mode, capturing MS and MS2 data automatically. Individual spots excised from 2D gels were trypsin digested and analyzed by both MALDI-TOF and LC–MS/MS. Samples resolved on 1D gels were subjected to LC–MS/MS analysis alone. For certain SHMT identification experiments, the LC–MS/MS was set to favor the capture of mass spectra from the protein by the incorporation of an inclusion list informed by theoretical peptide digest data for P. falciparum SHMT.
Protein Identification Criteria
Data captured by either MALDI-TOF or LC–MS/MS were matched using the Mascot algorithm (Matrix Science, UK http://www.matrixscience.com) to an in-house nonredundant annotated protein database for P. falciparum (3D7 strain) containing 5411 sequences (4 064 568 residues). In both cases, carbamidomethylation of cysteine and oxidation of methionine residues were considered as variable modifications and a single missed cleavage was permitted. For MALDI-TOF data, peptide mass tolerance was set to ±0.2 Da, whereas for LC–MS/MS data, peptide mass tolerance was at ±1.5 Da, MS/MS ion mass tolerance was set at 0.8 Da and charge states (+1, +2, +3) were taken into account. Routine protein identification required sequence-confirmed data for a minimum of two peptides with recognition as the top ranking match in the Mascot MuDPIT scoring system. The criterion to ensure definitive quantitation was defined as requiring sequence confirmation of a minimum of three unique labeled peptide pairs from a given protein. The probability that the observed match between the experimental data and the database sequence is a random event was set to 0.05, and these criteria thus equate to false positive identification rates of 2.5 × 10⁻³ and 1.25 × 10⁻⁴, respectively. For quantitative analyses, average peak intensity and integrated peak areas under the isotopic distribution envelope of normal and heavy isoleucine labeled tryptic peptides were manually determined.
Results and Discussion
Application of MicroSol Fractionation to the P. falciparum Proteome
The ZOOM-IEF fractionator selected for this study combines the advantages of liquid fractionation with manageable fraction numbers (3-7), to make it ideally suited for technically demanding downstream gel-based protocols. For routine experimentation, a five fraction system separated by immobiline gel membranes with pH values of 3.0, 4.6, 5.4, 6.2, 7.0, and 10.0 was employed with the 7-10 fraction contained in two chambers linked with a spacer as shown schematically (Figure 2a). Total protein loads of ∼3 mg per run resulted in efficient fractionation with minimal overlap between adjacent fractions as visualized on a 1D gel (Figure 2b). To achieve similar fractionation efficiencies with higher protein loading (up to 6 mg), the final 600 V fractionation phase had to be extended by 30 min. Washing of sample chambers with lysis buffer for 10 min at the end of each run resulted in an approximate increase of 15% in the amount of protein retrieved (data not shown).
Figure 2.
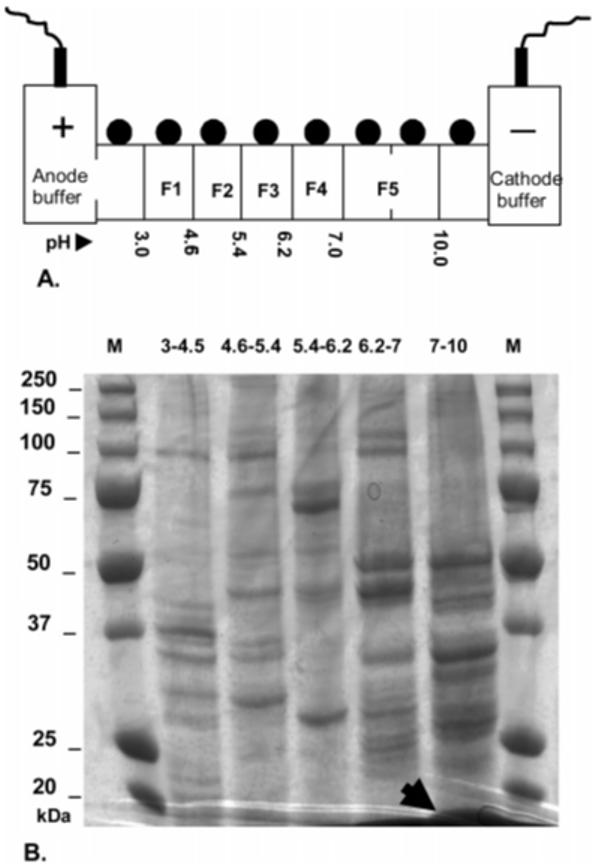
Use of solution isoelectric focusing for HDP containment. (A) Schematic representation of the ZOOM-IEF focusing device showing the 5 chamber arrangement used in this study. The high protein concentration due to compartmentalization of the high abundance HDP to fraction 5 (pI 7-10) required doubling of the volume of this chamber using a spacer. The pH values refer to the type of the membrane disk used at this point. First and last chambers were not loaded as per manufacturer’s instructions. (B) 1D gel loading of proteins precipitated from 50 μL of each of the five post-fractionation samples (F1: 3.0-4.5, F2: 4.6-5.4, F3: 5.4-6.2, F4: 6.2-7.0, F5: 7-10). The differential banding observed indicates efficient fractionation. The arrow shows the position and compartmentalization of HDP with unmasking of other proteins in the fraction. Lanes M: markers with molecular weights as indicated.
Use of MicroSol Fractionation for HDP Containment
The analysis of plasmodial lysates is impeded by the presence of the highly abundant HDP, primarily hemeozoin (beta-hemeatin). This unstable charged polymeric complex disintegrates to products of varying masses on routine 2D gel analysis. As depicted in Figure 1, the highly abundant HDP smear is, however, restricted to a pI range of 7-9, making an IEF-based fractionation method an attractive option for its containment. Indeed, HDP were efficiently restricted to the 7-10 fraction, as visualized on 1D gels (Figure 2b); moreover, the SDS sample protocol used for such gels resulted in the complete disruption of the hemeozoin polymer complex and restriction of the HDP to yield a dense band at around 15 kDa. This clarifies regions of the gel that would otherwise be obscured, permitting concentration and access to previously masked proteins in the basic region of the plasmodial proteome.
Gel-Based Analyses of Acidic Fractions
Different approaches were required for analysis of acidic (pI 3-7) and basic (pI 7-10) plasmodial fractions. The high-temperature SDS protocol required for disruption of the hemeozoin/HDP material was found to be incompatible with routine 2D gel analysis, resulting in increased streaking and distortion of the gel image. This, together with the poor resolution of basic proteins on 2D gels, necessitated the adoption of a 1DE-LC–MS approach for the analysis of plasmodial fractions with a pI > 7 (see below), whereas either 2DE- or 1DE-LC–MS strategies could be employed for the acidic fraction (pI < 7).
For acidic proteins (pI 3-7), where zoom 2D gel analysis was feasible, liquid prefractionation enabled concentration of fractions for optimal loading on matched narrow range gels. The enhanced spot resolution and high quality spectral data achieved resulted in a significant increase in the quantitative profiling capacity of a 2D gel-based approach. To compare our results with previous quantitative data published by this laboratory, the same stringent filter criteria were applied to all data sets (i.e., a minimum of 3 unique peptide sequences confirmed as the top ranking hit in a Mascot search for protein quantitation). The multiple detection of a given peptide, together with pI and molecular weight matching, significantly increased the capacity of the data to meet the stringent criteria required to achieve reproducible quantitation. All experiments were repeated 2-5 times, and data sets with the best sequence coverage values for the predefined filter criteria are presented in the Supporting Information (Appendices 1, 2, 3).
Acetone precipitated proteins from pI fraction 4.6-5.4 pooled from two MicroSol fractionation runs were used for loading onto 2D gels. Initial runs on broad range pI 3-10 dry strips confirmed the efficacy of fractionation with minimal contamination outside the expected pI range, as observed previously on 1D gels (Figure 3a). Figure 3b shows the high-resolution 2D gel image obtained by running concentrated fraction pI 4.6-5.4 on a matched pI 4.4-5.5 zoom gel. Although offering the obvious advantage of increasing loading concentrations, MicroSol fractionation also greatly minimized sample wastage, which is inevitable with total lysate loading on narrow range zoom gels.
Figure 3.
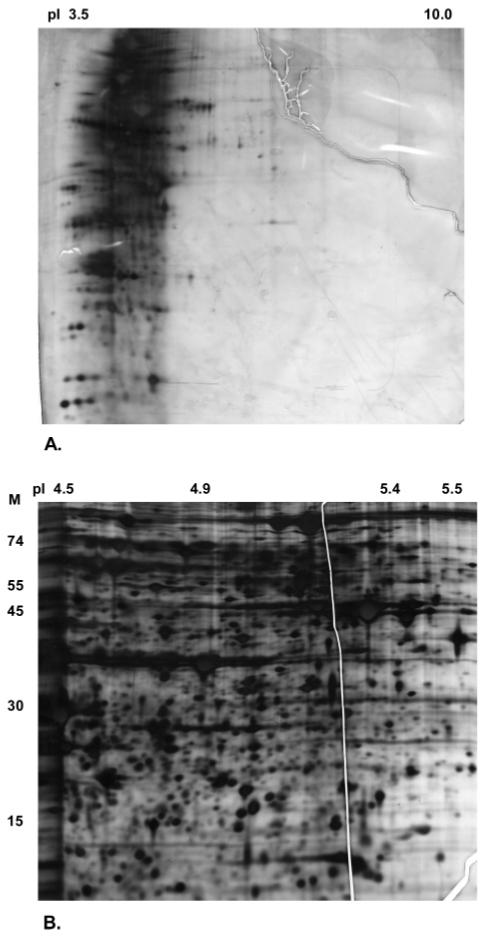
2DE analysis of isolectric focusing fraction F2. (A) Further analysis of fraction F2 (pI 4.6-5.4) demonstrating the restriction of the proteins to the expected pI 4.6-5.4 region and minimal protein overlap between fractions by loading on a wide range (pI 3-10) 2D gel. (B) High-resolution gel image of the same fraction obtained after concentration and analysis on a matched narrow range zoom 2D gel.
The extent by which sensitivity was increased by the inclusion of the prefractionation step was dependent upon the subsequent analysis method. This is illustrated by data obtained from the pI 4.6-5.4 fraction using both 2DE-LC–MS and 1DE-LC–MS. In the former case, we were able to identify 34 proteins that matched the specified quantitative criteria. By comparison, data obtained for the same fraction from analysis of all pixels derived from the equivalent 1D gel (using 1 mm gel pixels) yielded 91 nonredundant protein hits meeting the same criteria (Supporting Information, Appendices1 and 2). These comparative data thus showed an approximate 3-fold difference in profiling capacities between the two approaches. In combination, they yielded a total of 107 potentially quantifiable unique plasmodial proteins, with only 18 proteins shared between them (Figure 4).
Figure 4.
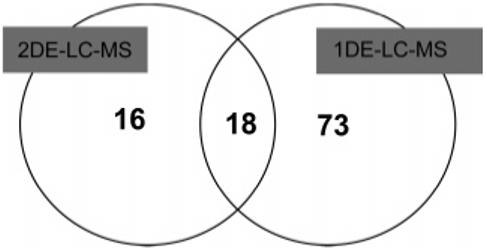
Comparison of 2DE- and 1DE-LC–MS approaches using MicroSol fraction F2 (pI 4.6-5.4) for quantitation of plasmodial proteins. The analysis was restricted to proteins matching a predefined stringent quantitative filter criterion (3 top matched unique peptides in a Mascot search using MuDPIT scoring) for protein identification. Although the 1DE-LC–MS approach offered a 3-fold expansion in the quantitative profiling capacity, only 18 of the total 107 proteins were identified using both techniques, making the two approaches complementary.
Analysis of Basic Fractions: Identification of P. falciparum SHMT
Using currently available protocols, we have failed to reproducibly identify the P. falciparum folate enzyme SHMT, which is expressed at low to intermediate levels in blood stage parasites. With a molecular weight of 49.7 kDa and a theoretical pI of 8.29, this protein is predicted to co-focus in the same pI interval as HDP, making it ideally suited for inclusion in a study to evaluate the potential benefits of HDP compartmentalization and as an archetype for analysis of the basic fractions. Furthermore, our previous work quantifying gene transcription in enzymes of the folate pathway has identified SHMT as the most abundant of the five folate pathway genes analyzed.18 Although the correlation between gene transcription and protein translation is not always predictable, SHMT was chosen as the most promising target protein in the pathway for optimizing and validating the efficacy of the proposed fractionation-based plasmodial proteomics workflow. This protein also serves as a paradigm for others expressed at similar levels.
A 1DE-LC–MS approach on fraction pI 7-10 was used, with the analysis focusing on a region around the expected theoretical molecular mass of SHMT (49.7 kDa). Trypsin digested peptides were eluted from 9 adjacent 1 mm pixels of 12% acrylamide gels over a mass range of 40-55 kDa as shown (Figure 5a, refer also to Supporting Information, Appendix 3). Initial post-fractionation experiments identified SHMT in the 49 kDa region of the gel with a sequence coverage of 7% and ≤2 unique peptides identified. Further protocol optimization and technique refinement to meet the stringent filter criteria for SHMT quantitation was validated against the sequence coverage of plasmodial SHMT as detailed below.
Figure 5.
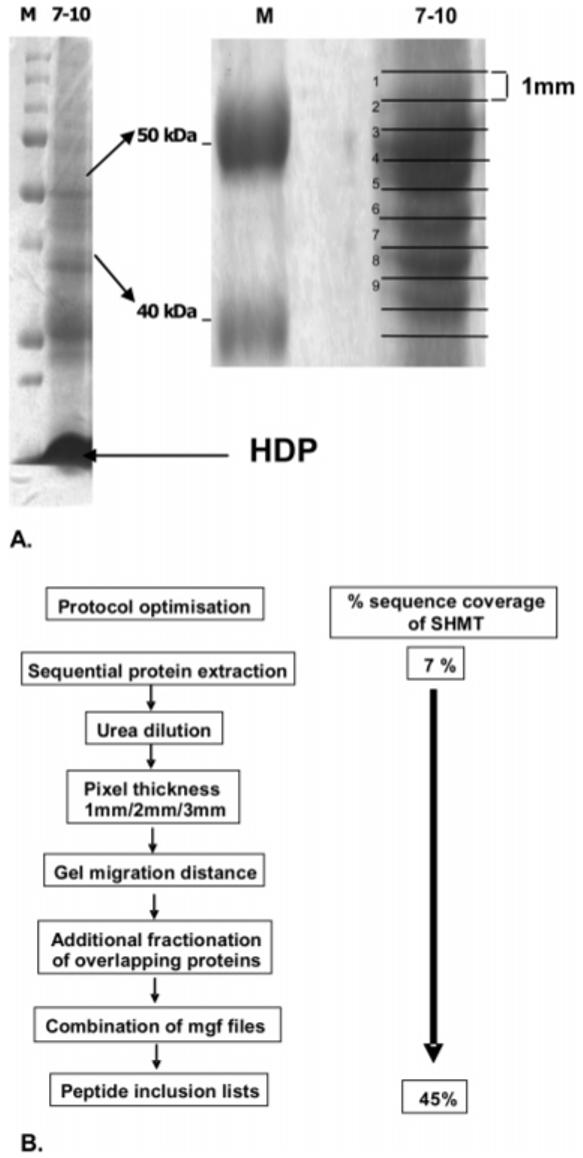
Analysis of the HDP containing fraction F5 (pI 7-10) for P. falciparum SHMT informed by the predicted molecular weight and pI of the protein (49.7 kDa, pI 8.29). (A) Pixels (1 mm) from the 40-55 kDa region of the gel were analyzed as shown, with SHMT being routinely identified in slice 3. HDP, hemeoglobin-derived products. (B) Series of protocol optimizations that led to progressive improvements in the unique peptide sequence coverage of plasmodial SHMT from 7 to 45%.
Sample-Specific Method Optimizations for Quantitative Analysis of P. falciparum SHMT
Preliminary optimizations focused on increasing protein concentrations in the analyzed gel pixels. The higher sample lysate volumes employed in the fractionation approach allowed the application of a sequential protein extraction protocol that improved nonredundant protein identification. A series of four 1 mL lysis buffer extractions were carried out on the plasmodial pellet, before the membranous proteins were extracted with sonication in 1 mL of lysis buffer, thus reducing carbamylation artefacts that could impede downstream processing. A 10 min lysis buffer wash of the fractionation chambers resulted in an approximately 15% increase in total protein concentration. Attempts to decrease resuspension volumes resulted in increased salt loads and protein loss through precipitation. The poor reproducibility observed with ion exchange and molecular weight cutoff minicolumns together with the significant protein losses observed, even in the presence of 2 M urea, excluded their use as further fractionation alternatives. Sample concentration with acetone precipitation frequently resulted in co-precipitation of urea crystals with horizontal streaking/distortion of gels. This problem was overcome by initial dilution of the fractionated sample in an equal volume of MilliQ H2O and the subsequent doubling of the acetone volumes.
As reported previously, the size of the pixel used for trypsin digestion is a parameter that could influence the number of proteins identified.14 While sequence coverage data for SHMT was increased to 15% in data sets obtained with 1 mm as opposed to 3 mm pixel analysis, the associated increase in analysis time might not be acceptable for a proteome-wide investigation. Furthermore, the higher chance of physical division of proteins between slices could result in lower scores for individual proteins. However, for optimization of the targeted method carried out in this study, a 1 mm pixel size was retained. To minimize the effect of potential loss of protein associated with the narrow slicing of the gel band, combination Mascot generic format (mgf) files were compiled for all of the adjacent slices in the defined molecular weight range and presented as a single file for the Mascot search.
With optimum loading, an improvement in sequence coverage was also observed with increased 1D separation distance. This was achieved by using lower concentration acrylamide mini gels (7%) run to obtain the maximum separation distance between the 40-55 kDa region of interest. The co-focusing of the abundant plasmodial protein elongation factor 1 alpha (48.9 kDa, pI 9.12) with SHMT also resulted in a degree of masking of the less abundant target protein. Through the inclusion of a pI 9.1 membrane disk to create an additional fraction and IEF chamber, we achieved effective separation of elongation factor 1 alpha from the target and further increased SHMT peptide coverage. The increase in sequence coverage that paralleled the sample-specific method optimization described above was further improved by targeted mass spectrometric peptide detection with inclusion lists for SHMT peptides as described below. This optimization procedure and the consequent effects on sequence coverage of SHMT are illustrated in Figure 5b.
Quantitation of P. falciparum SHMT
Known 50/50 mixtures of labeled and unlabeled plasmodial cultures were used to validate the efficacy of the fractionation-based proteome work flow for quantitation of plasmodial proteins described above. An inclusion list for isoleucine-labeled and nonlabeled SHMT peptides, selected on the basis of ion scores and frequency of detection from the optimization experiments, permitted the reproducible quantitation of the protein of interest, whereas a duplicate sample without the inclusion list captured the wider labeled proteome data.
To ensure the capture of a minimum of 3 labeled peptide pairs, mass/charge values for the three isoleucine containing peptides IAAVACQLK, NLDLVTNGTDNHLIVVDLR and AILLTDELQQK were calculated for labeled and unlabeled peptides, taking into account known post-translational modifications such as carbamidomethylation and methionine oxidation (Table 1). The Bruker Esquire ion trap was set to preferentially detect both labeled and unlabeled peptides predefined via the inclusion list of calculated m/z ratios, with a ±0.5 Da range. Mascot data searches that included the heavy isoleucine modification (13C6, 15N1-isoleucine residue: +7 Da mass increase) identified labeled peptide pairs for all three peptides, with AILLTDELQQK identified thrice (Supporting Information, Appendix 4).
Table 1.
Isoleucine Containing P. falciparum SHMT Peptides Selected for the Inclusion List Used in this Study
| peptide sequence | modification | mass addition (Da) | inclusion list m/z (expt)a |
|---|---|---|---|
| IAAVACQLK | carbamidomethyl (C) | + 57.92 | 972.54 (486.27++) |
| IAAVACQLK | carbamidomethyl (C) | + 57.92 | 979.59 (489.8++) |
| + heavy isoleucine | + 7.0 | ||
| NLDLVTNGTDNHLIVVDLR | none | - | 2120.17 (706.7+++) |
| NLDLVTNGTDNHLIVVDLR | heavy isoleucine | + 7.0 | 2127.17 (709.5+++) |
| AILLTDELQQK | none | - | 1270.71 (635.3++) |
| AILLTDELQQK | heavy isoleucine | + 7.0 | 1277.76 (638.8++) |
The predicted isoleucine-labeled masses were calculated as a mass addition of 7 Da (3.5++ m/z), and known post-translational modifications (e.g., carbamidomethylation/methionine oxidation) were accounted for as shown.
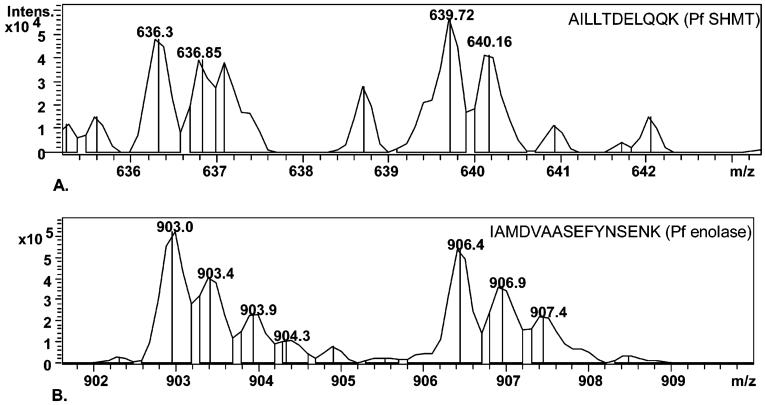
Quantitative analysis carried out manually was based on two parameters, namely, average intensity (based on average peak intensities of the isotopic distribution) and area under the isotopic envelope (summation of areas under each isotopic peak). Spectral and sequence data for SHMT peptide AILLTDELQQK are shown as an example (Figure 6a). Average intensity and area data for unlabeled and isotopically labeled SHMT peptides were found to be 1.24 (±0.26 SD) and 1.17 (±0.38 SD), respectively (Table 2a). Comparative quantitative analysis of the highly abundant plasmodial protein enolase from the same plasmodial lysate is also presented in Figure 6b and Table 2b. Ten labeled peptide pairs were detected from enolase with each peptide detected between 3 and 15 times (Supporting Information, Appendix 4). In this case, intensity and area values were 1.08 (±0.13 SD) and 1.13 (±0.19 SD). The high intensity, high-resolution spectral data observed with all enolase peptides thus indicate that the significant qualitative improvement facilitated by the new fractionation protocol also extends to quantitation of abundant proteins. Moreover, for both proteins, the data obtained were readily reproducible. Thus, when independently prepared 50/50 mixtures were analyzed, the equivalent ratios calculated for enolase were 1.03 (intensity) and 1.11 (area), whereas those for SHMT were 1.04 (intensity) and 1.09 (area). Our previous published data for the labeling time applied in this experiment has shown that up to 10% of residual unlabeled protein can remain in the labeled cultures.3 This would account for the fact that all calculated values are slightly above the ratio of 1.00 expected for a 50/50 mix of unlabeled and labeled cultures.
Figure 6.
Ion Trap spectral data for the 50/50 heavy isoleucine labeled proteins. (A) SHMT peptide pair (AILLTDELQQK: unlabeled m/z 636.3 ++ Da, labeled m/z 639.7 Da). (B) Comparative data for a labeled peptide pair from the highly abundant plasmodial enolase (IAMDVAASEFYNSENK: m/z unlabeled 903.0 ++ Da, labeled m/z 906.4 ++ Da). The Mascot search data and sequence confirmation data for the two proteins are included in the Supporting Information in Appendices 4 and 5, respectively.
Table 2.
Quantitative Analysis of P. falciparum SHMT and Enolase in 50/50 Isoleucine Labeled Asynchronous Culturesa
| SHMT peptides | intensityb (unlabeled) | intensity (labeled) | intensity ratiod unlab/lab | areac (unlabeled) | area (labeled) | area ratiod unlab/lab |
|---|---|---|---|---|---|---|
| IAAVACQLK | 10420.5 | 7009.5 | 1.48 | 2729.5 | 1733.5 | 1.57 |
| NLDLVTNGTDNHLIVVDLR | 6654 | 6893 | 0.96 | 1503 | 1329.5 | 1.13 |
| AILLTDELK 1 | 34907 | 28738 | 1.21 | 11089.5 | 12494 | 0.88 |
| AILLTDELK2 | 16942 | 16790 | 1.01 | 4220.5 | 5779 | 0.73 |
| AILLTDELK3 | 46062 | 29551 | 1.55 | 13551 | 8702 | 1.55 |
| Av | 1.24 | 1.17 | ||||
| SD | 0.26 | 0.38 |
| Enolase peptides | intensityb (unlabeled) | intensity (labeled) | intensity ratiod unlab/lab | areac (unlabeled) | area (labeled) | area ratiod unlab/lab |
|---|---|---|---|---|---|---|
| IDNLMVEELDGSK | 43747 | 53119 | 0.82 | 14597 | 17842 | 0.81 |
| TGAQLVDLYIDLVK | 70645 | 78265 | 0.90 | 24175 | 22481 | 1.07 |
| IEESLGNNAVFAGEK | 53278 | 42321 | 1.25 | 14265 | 13405 | 1.06 |
| KIDNLMVEELDGSK | 109725 | 102055 | 1.07 | 35754 | 34561 | 1.03 |
| DVQIVGDDLLVTNPTR | 125742 | 116527 | 1.07 | 39532 | 37666 | 1.04 |
| IAMDVAASEFYNSENK | 417155 | 369467 | 1.12 | 136575 | 135000 | 1.01 |
| AAVPSGASTGIYEALELR | 338710 | 279393 | 1.21 | 114339 | 83727 | 1.36 |
| LSFQEFMIVPVGAPSFK | 106882 | 95358 | 1.12 | 35785 | 30549 | 1.17 |
| LIGMNCTEQK | 95768 | 79331 | 1.20 | 32917 | 22131 | 1.48 |
| YPIVSIEDPFDQDDWENYAK | 40256 | 38809 | 1.03 | 14380 | 10982 | 1.30 |
| Av | 1.08 | 1.13 | ||||
| SD | 0.13 | 0.19 |
Two quantitative parameters were considered in the experiments for each labeled and unlabeled peptide pair analysis of P. falciparum SHMT and enolase data.
Intensity: average peak heights of the isotopic envelope.
Area: summation of the area under the isotopic envelope.
The final ratio for each parameter was expressed as the ratio of unlabeled:labeled peptide.
Conclusions
Developing effective protocols to harness the complete information content of proteomes in complex organisms like P. falciparum is a priority in the post-genomic era (Figure 7. The adoption of the MicroSol-IEF fractionation approach together with the sample-specific method optimizations detailed in this paper have resulted in a significant expansion of gel-based plasmodial protein profiling capacities, necessitating a reassessment of traditional approaches. The effective fractionation, minimal cross-contamination and increased resolution observed make a MicroSol-fractionation gel-based approach an effective option for quantitative analysis. The resulting expansion in profiling capacity based on a minimum of 3 top matched unique peptides allows the quantification methodology based on isoleucine labeling to be applied to the wider, currently unexplored, low to intermediate abundance components of the plasmodial proteome. For the less abundant proteins like the folate pathway enzymes, the study has demonstrated the importance of sample/protein specific optimization, albeit necessitating some compromise on throughput. For more abundant proteins, the new approach results in a significant qualitative improvement in the data that are acquired, enabling routine, stringent and reproducible quantitation. We also note that this approach will find application in the study of the proteomes of other species of Plasmodium, and possibly in other cell types where abundant contaminating protein species may hinder access to the proteome of interest.
Figure 7.
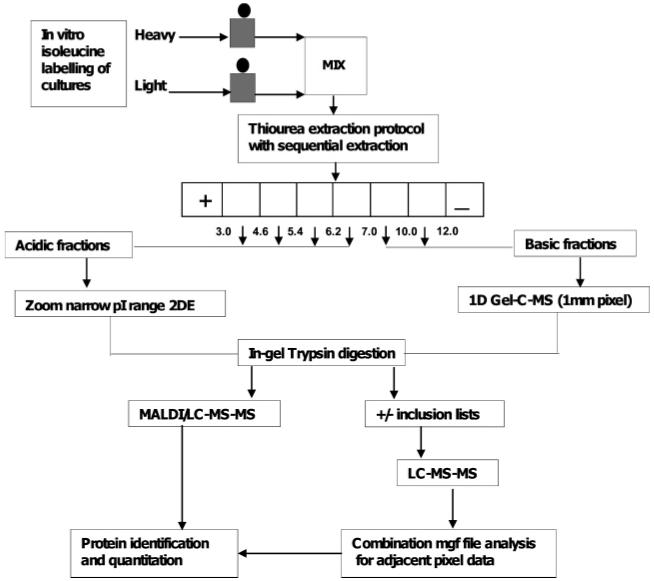
Summary of the optimized proteomics workflow proposed for quantitative analysis of low to intermediate abundance proteins in the plasmodial proteome. Although acid proteins can be analyzed through either narrow range 2DE- or 1DE-LC–MS, the higher resolution spectra obtained following 2DE means that the former is preferred for quantitative work.
Supplementary Material
Appendix 1: Analysis of fraction pI 4.6-5.4 using a 2DE-LC–MS approach.
Listed are proteins selected on the basis of the defined filter criteria (>3 unique top matched peptides) and include data on protein identification (PlasmoDB accession numbers; www.plasmodb.org), protein description, molecular weight (Da), pI, MudPit score, total sequence coverage (%) and total number of unique peptides as identified by MASCOT.
Appendix 2: Analysis of fraction pI 4.6-5.4 using a 1DE-LC–MS approach, listing data on protein identification (PlasmoDB accession numbers), protein description, molecular weight (Da), pI, MudPit score, total sequence coverage (%) and total number of unique peptides as identified.
Appendix 3: Analysis of 40-55 Da range of fraction pI 7-10, using the optimised 1DE-LC–MS approach. The data includes protein identification (PlasmoDB accession numbers), protein description, molecular weight (Da), pI, MudPit score and total sequence coverage (%).
Appendix 4: Mascot search data from the 50/50 isoleucine labeling experiment for P. falciparum SHMT and enolase, listing the sequenceidentified labeled and unlabeled peptides from the two proteins.
Appendix 5: MS-MS-spectral data confirming sequence identification of SHMT peptide AILLTDELQQK (labeled and unlabeled) from Figure 6a.
Acknowledgment
This work is supported by a Wellcome Trust Programme grant, No. 073896. We thank Dr. David Knight, Dr. Chris Storey and Martin Read (University of Manchester) for useful discussions, assistance with mass spectrometry and parasite culture, respectively.
References
- (1).Gardner MJ, Hall N, Fung E, White O, Berriman M, Hyman RW, Carlton JM, Pain A, Nelson KE, Bowman S, Paulsen IT, James K, Eisen JA, Rutherford K, Salzberg SL, Craig A, Kyes S, Chan MS, Nene V, Shallom SJ, Suh B, Peterson J, Angiuoli S, Pertea M, Allen J, Selengut J, Haft D, Mather MW, Vaidya AB, Martin DMA, Fairlamb AH, Fraunholz MJ, Roos DS, Ralph SA, McFadden GI, Cummings LM, Subramanian GM, Mungall C, Venter JC, Carucci DJ, Hoffman SL, Newbold C, Davis RW, Fraser CM, Barrell B. Nature. 2002;419(6906):498–511. doi: 10.1038/nature01097. [DOI] [PMC free article] [PubMed] [Google Scholar]
- (2).Pagola S, Stephens PW, Bohle DS, Kosar AD, Madsen SK. Nature. 2000;404(6775):307–310. doi: 10.1038/35005132. [DOI] [PubMed] [Google Scholar]
- (3).Nirmalan N, Sims PFG, Hyde JE. Mol. Microbiol. 2004;52(4):1187–1199. doi: 10.1111/j.1365-2958.2004.04049.x. [DOI] [PubMed] [Google Scholar]
- (4).Gelhaus C, Fritsch J, Krause E, Leippe M. Proteomics. 2005;5(16):4213–4222. doi: 10.1002/pmic.200401285. [DOI] [PubMed] [Google Scholar]
- (5).Lauer SA, Rathod PK, Ghori N, Haldar K. Science. 1997;276(5315):1122–1125. doi: 10.1126/science.276.5315.1122. [DOI] [PubMed] [Google Scholar]
- (6).Issaq HJ, Conrads TP, Janini GM, Veenstra TD. Electrophoresis. 2002;23(17):3048–3061. doi: 10.1002/1522-2683(200209)23:17<3048::AID-ELPS3048>3.0.CO;2-L. [DOI] [PubMed] [Google Scholar]
- (7).Lescuyer P, Hochstrasser DF, Sanchez JC. Electrophoresis. 2004;25(7-8):1125–1135. doi: 10.1002/elps.200305792. [DOI] [PubMed] [Google Scholar]
- (8).Zuo X, Lee K, Speicher DW. In: Proteome analysis; interpreting the genome. Speicher DW, editor. Elsevier; The Netherlands: 2004. pp. 93–118. [Google Scholar]
- (9).Righetti PG, Castagna A, Antonioli P, Boschetti E. Electrophoresis. 2005;26(2):297–319. doi: 10.1002/elps.200406189. [DOI] [PubMed] [Google Scholar]
- (10).Gorg A, Weiss W, Dunn MJ. Proteomics. 2004;4(12):3665–3685. doi: 10.1002/pmic.200401031. [DOI] [PubMed] [Google Scholar]
- (11).Stastna M, Slais K. Electrophoresis. 2005;26(18):3586–3591. doi: 10.1002/elps.200500264. [DOI] [PubMed] [Google Scholar]
- (12).Luche S, Santoni V, Rabilloud T. Proteomics. 2003;3(3):249–253. doi: 10.1002/pmic.200390037. [DOI] [PubMed] [Google Scholar]
- (13).Tang HY, Speicher DW. Expert Rev. Proteomics. 2005;2(3):295–306. doi: 10.1586/14789450.2.3.295. [DOI] [PubMed] [Google Scholar]
- (14).Tang HY, Ali-Khan N, Echan LA, Levenkova N, Rux JJ, Speicher DW. Proteomics. 2005;5(13):3329–3342. doi: 10.1002/pmic.200401275. [DOI] [PubMed] [Google Scholar]
- (15).Myung JK, Lubec G. J. Proteome Res. 2006;5(5):1267–1275. doi: 10.1021/pr060015h. [DOI] [PubMed] [Google Scholar]
- (16).Alfadhli S, Rathod PK. Mol. Biochem. Parasitol. 2000;110(2):283–291. doi: 10.1016/s0166-6851(00)00282-6. [DOI] [PubMed] [Google Scholar]
- (17).Lee CS, Salcedo E, Wang Q, Wang P, Sims PFG, Hyde JE. Parasitology. 2001;122:1–13. doi: 10.1017/s0031182000006946. [DOI] [PubMed] [Google Scholar]
- (18).Nirmalan N, Wang P, Sims PFG, Hyde JE. Mol. Microbiol. 2002;46(1):179–190. doi: 10.1046/j.1365-2958.2002.03148.x. [DOI] [PubMed] [Google Scholar]
- (19).Bozdech Z, Llinas M, Pulliam BL, Wong ED, Zhu J, DeRisi JL. PLoS Biol. 2003;1:1–16. doi: 10.1371/journal.pbio.0000005. [DOI] [PMC free article] [PubMed] [Google Scholar]
- (20).Wellems TE, Panton LJ, Gluzman IY, do Rosario VE, Gwadz RW, Walker-Jonah A, Krogstad DJ. Nature. 1990;345(6272):253–255. doi: 10.1038/345253a0. [DOI] [PubMed] [Google Scholar]
- (21).Read M, Hyde JE. In: Protocols in Molecular Parasitology. Hyde JE, editor. Vol. 21. Humana Press; Totowa, NJ: 1993. pp. 43–55. [Google Scholar]
- (22).Cohen AM, Rumpel K, Coombs GH, Wastling JM. Int. J. Parasitol. 2002;32(1):39–51. doi: 10.1016/s0020-7519(01)00308-3. [DOI] [PubMed] [Google Scholar]
Associated Data
This section collects any data citations, data availability statements, or supplementary materials included in this article.
Supplementary Materials
Appendix 1: Analysis of fraction pI 4.6-5.4 using a 2DE-LC–MS approach.
Listed are proteins selected on the basis of the defined filter criteria (>3 unique top matched peptides) and include data on protein identification (PlasmoDB accession numbers; www.plasmodb.org), protein description, molecular weight (Da), pI, MudPit score, total sequence coverage (%) and total number of unique peptides as identified by MASCOT.
Appendix 2: Analysis of fraction pI 4.6-5.4 using a 1DE-LC–MS approach, listing data on protein identification (PlasmoDB accession numbers), protein description, molecular weight (Da), pI, MudPit score, total sequence coverage (%) and total number of unique peptides as identified.
Appendix 3: Analysis of 40-55 Da range of fraction pI 7-10, using the optimised 1DE-LC–MS approach. The data includes protein identification (PlasmoDB accession numbers), protein description, molecular weight (Da), pI, MudPit score and total sequence coverage (%).
Appendix 4: Mascot search data from the 50/50 isoleucine labeling experiment for P. falciparum SHMT and enolase, listing the sequenceidentified labeled and unlabeled peptides from the two proteins.
Appendix 5: MS-MS-spectral data confirming sequence identification of SHMT peptide AILLTDELQQK (labeled and unlabeled) from Figure 6a.


