

Abstract
The only currently available method to measure brain glycogen in vivo is 13C NMR spectroscopy. Incorporation of 13C-labeled glucose (Glc) is necessary to allow glycogen measurement, but might be affected by turnover changes. Our aim was to measure glycogen absolute concentration in the rat brain by eliminating label turnover as variable. The approach is based on establishing an increased, constant 13C isotopic enrichment (IE). 13C-Glc infusion is then performed at the IE of brain glycogen. As glycogen IE cannot be assessed in vivo, we validated that it can be inferred from that of N-acetyl-aspartate IE in vivo: After [1-13C]-Glc ingestion, glycogen IE was 2.2 ± 0.1 fold that of N-acetyl-aspartate (n = 11, R2 = 0.77). After subsequent Glc infusion, glycogen IE equaled brain Glc IE (n = 6, paired t-test, p = 0.37), implying isotopic steady-state achievement and complete turnover of the glycogen molecule. Glycogen concentration measured in vivo by 13C NMR (mean ± SD: 5.8 ± 0.7 μmol/g) was in excellent agreement with that in vitro (6.4 ± 0.6 μmol/g, n = 5). When insulin was administered, the stability of glycogen concentration was analogous to previous biochemical measurements implying that glycogen turnover is activated by insulin. We conclude that the entire glycogen molecule is turned over and that insulin activates glycogen turnover.
Keywords: 13C, insulin, nuclear magnetic resonance, turnover
Glycogen is a macromolecule (~103-104 kDa); a polymer of glucosyl units present in a substantial amount in the brain relative to free glucose (Glc) (Gruetter 2003; Watanabe and Passonneau 1973). Interestingly, in the adult brain, glycogen is found only in astrocytes. Although under normal physiology it seems that this store is metabolized actively but comparatively slowly (Oz et al. 2007), glycogen support of astrocyte metabolism (Dienel and Cruz 2004), neuronal metabolism (Gibbs et al. 2006; Suh et al. 2007), or both could be important in prolonging neuronal activity (Brown et al. 2005) and limiting neuronal death. We have previously shown that the brain can store more than a few minutes' supply of Glc equivalent as glycogen (Morgenthaler et al. 2006). Therefore, glial glycogen may act as a substantial source of Glc equivalents during acute insulin-induced hypoglycemia (Choi et al. 2003; Gruetter 2003; Morgenthaler et al. 2006) or during hypoxia-ischemia (Allen et al. 2005; Gruetter 2003; Nordstrom and Siesjo 1978; Rossi et al. 2007). Recently, it has been suggested that glycogen might be involved in learning in young chickens (Gibbs et al. 2006, 2008a, 2007). Glycogen may also be neuro-protective (Swanson and Choi 1993). One possible neuro-protective mechanism of glial glycogen might be to provide lactate as fuel for neurons (Magistretti and Pellerin 1996) and to provide ATP to allow continuous uptake of excitotoxic glutamate from the synaptic cleft (Gruetter 2003). However, such neuroprotection might interfere with proper recognition of hypoglycemia by interfering with Glc-sensing neurons. Therefore, it has also been suggested that brain glycogen might be implicated in the mechanism of hypoglycemia unawareness syndrome observed clinically in patients with type I diabetes (Choi et al. 2003; Cryer 2005, 2006; Gruetter 2003). Hypoglycemia unawareness is a very dangerous state characterized by the lack of warning symptoms of hypoglycemia prior to cognitive dysfunction, and rapid progression to severe hypoglycemia with confusion and coma.
There is normally an ongoing simultaneous utilization and resynthesis of brain glycogen with an active turnover resulting in consistent levels of brain glycogen under resting conditions (Brown and Ransom 2007; Choi et al. 2003; Watanabe and Passonneau 1973). Interestingly, glycogen turnover is increased during activation of brain tissue (Dienel et al. 2007; Dienel and Cruz 2003, 2004; Shulman et al. 2001; Swanson 1992). Moreover, extracellular Glc concentration (Brown et al. 2003; Morgenthaler et al. 2006), as well as numerous neurotransmitters (Sorg and Magistretti 1992) have been reported to influence glycogen content in the brain. For example, insulin increases brain glycogen metabolism (Choi et al. 2003; Morgenthaler et al. 2006).
13C Nuclear Magnetic Resonance (NMR) is the only currently available method capable of measuring brain glycogen non-invasively. As 13C natural abundance is low, 13C NMR studies rely on measuring the incorporation of 13C-labeled Glc into the glycogen molecule to enhance the signal. Therefore, the observed increase in 13C signal over time might not necessarily be reflecting changes in concentration alone, but also an increased incorporation of the 13C label. We have previously shown that changes in glycogen concentration measured by 13C NMR were in excellent agreements with biochemical measurements (Lei et al. 2007; Morgenthaler et al. 2006). However, the increase in glycogen concentration after insulin infusion was smaller when studied with biochemical methods (Morgenthaler et al. 2006) as compared to in vivo 13C NMR studies (Choi et al. 2003). This difference might be because of an effect of insulin on glycogen turnover.
The aim of this study was to develop a new approach that allows the measurement of in vivo brain glycogen absolute concentration. The pre-requisite consisted of minimizing the influence of turnover - a potential confounding factor - in the 13C NMR measurement of glycogen. The strategy was to pre-label the rat and achieve a near steady-state Isotopic Enrichment (IE) using long term [1-13C]-Glc administration. Glycogen IE was measured in vivo and this IE was matched by the subsequent 13C-labeled Glc infusion, thus maintaining isotopic steady-state throughout the experiment. Consequently, the effects of insulin on brain glycogen concentration could be directly studied.
Materials and methods
`Rationale'
In vivo 13C Nuclear Magnetic Resonance (NMR) spectroscopy of glycogen is based on observing the incorporation of 13C label into glycogen (Choi and Gruetter 2003; Choi et al. 2003, 1999; Gruetter et al. 2003; Karelson et al. 2003; Oz et al. 2003). Therefore an increase in 13C signal over time is not necessarily reflecting an increase in glycogen absolute concentration [as illustrated in the scheme of Fig. 1a(i-iii)].
Fig. 1.

Schematic illustration of the effect of label turnover on glycogen quantification. (a) Brain glycogen is labeled by infusing a highly enriched solution of 13C-labeled Glc (dark spheres) into an unlabeled rat (a-i) femoral vein. Light spheres represent 12C-Glc (so-called unlabeled Glc). An increase in 13C signal can be observed over time (represented by an increase in the number of dark spheres), even in the absence of changes in brain glycogen concentration (the total number of spheres does not change over time). The 13C signal augmentation is thus because of an increase in glycogen IE over time. (b) The new method uses long term administration of 13C-labeled Glc prior to the measurement to achieve significant brain glycogen IE. After measuring this IE in vivo (using NAA IE as an indirect method), the same IE of the infused Glc solution is matched to that of brain glycogen IE and the 13C-NMR glycogen measurement is started. By subsequently infusing a Glc solution whose IE is similar to that of glycogen, glycogen IE remains stable over time and therefore no change in signal intensity is observed unless the absolute glycogen concentration changes (total number of spheres). Due to glycogen turnover, represented by the arrow, the glycogen concentration in the rat brain remains constant (schematized here as a constant number of spheres) despite the infusion of glucose. N.B.: 13C natural abundance (1.1%) has been neglected (especially in a-i).
The major aim of this study was to measure glycogen absolute concentration and second to eliminate label turnover (exchange with the glycogen molecule) as a potential confounding factor. Our approach is based on `pre-labeling' rat brain glycogen by long-term [1-13C]-labeled Glc administration until steady-state of 13C enrichment (i.e. constant over time) was reached. Infusion of [1-13C]-labeled Glc then continues with the same Isotopic Enrichment (IE, see eqn 1) as brain glycogen (isotopic steady-state) [Fig. 1b(i)].
| (1) |
Subsequently, observed changes in glycogen signal intensity only reflect changes in absolute concentration and not label turnover into the glycogen molecule [Fig. 1b(i-iii)].
The approach depends on continuing the infusion at the IE of glycogen. As brain glycogen IE cannot be assessed in vivo, we investigated its indirect estimation through measuring N-acetyl-aspartate (NAA) IE, which can be directly measured in vivo. NAA was chosen because of the excellent correlation between the amount of labeled Glc incorporated into brain glycogen and into NAA previously described; as well as the similar turnover time of these two molecules (Choi and Gruetter 2003). Therefore, once the isotopic steady-state is reached, the IE of glycogen should be mimicked by that of NAA.
Together with the known brain glycogen IE, the reliable quantification of 13C-labeled glycogen implies that brain glycogen absolute concentration can be calculated by dividing the glycogen 13C NMR signal by glycogen IE.
Rat `pre-labeling'
Rats were fasted overnight with free access to water before studies were performed. The following day they received a 10% w/v [1-13C]-labeled Glc solution (99% [1-13C]-enriched) ad libitum as their sole source of exogeneous carbon for 24 h (n = 11) or 48 h (n = 6). Most of the rats labeled for 24 h received a 99% 13C-enriched solution (n = 9), but rats pre-labeled during 48 h received a 50% 13C-enriched solution as labeling solution, to optimize the cost of the experiment.
To keep the ratio between glycogen IE and NAA IE stable and allow the calculation of glycogen IE from NAA IE, rats were pre-labeled in a quiet and familiar environment as glycogen turnover has been reported to be increased during brain activation (Dienel et al. 2007; Dienel and Cruz 2003, 2004; Shulman et al. 2001; Swanson 1992).
Animal preparation
The study was performed in accordance with the local and federal guidelines and was approved by the local ethics committee.
Two main groups of rats were studied. The first group (n = 11, mean weight ± SD: 240 ± 27 g, Sprague-Dawley rats, Harlan, Madison, WI, USA) was used for validation of the method for indirect estimation of glycogen IE via NAA IE measurement. The rats were pre-labeled for either 24 h (n = 5)or 48 h (n = 6). They were anesthetized using isoflurane (isoflurane, Halocarbon laboratories, 5% for induction and 1.8-2.0% for maintenance) in a 70 : 35 mixture of nitrous oxide (N2O) and oxygen (O2) gases for preparation. Then, rats were intubated and ventilated with a pressure-driven ventilator (Kent Scientific, Litchfield, CT, USA) for the rest of the experiment. They were placed into the 9.4 T magnet and their body temperature was maintained at 37.5 ± 0.5°C with circulating heated water (RTE-101 bath circulator, Thermo NESLAB, Portsmouth, NH, USA). In vivo measurement of NAA IE was performed. The animal was then killed and in vitro measurements (NAA IE for validation, glycogen concentration and glycogen IE) were performed on the brain extracts (see below).
With the second group of rats (n = 6), brain glycogen absolute concentration was measured in vivo (see below), as well as the effects on brain glycogen of insulin infusion over time. Glycogen IE was calculated at the beginning of the experiment from the in vivo measurement of NAA IE. Male Sprague-Dawley rats (mean weight ± SD: n = 6, 247 ± 38 g, Charles River, France) were pre-labeled during 24 h and prepared as described above and previously (Morgenthaler et al. 2006). Respiratory rate and pattern were monitored during experiments with a respiratory pillow (SA Instruments, Stony Brook, NY, USA). Preparation consisted of inserting catheters into both femoral arteries for blood gases and Glc analysis, and into both femoral veins for i.v. infusion of α-chloralose (97%, Acros Organics, Geel, Belgium), [1-13C]-Glc (Cambridge Isotope Laboratories Inc., Andover, MA, USA) mixed with D-Glc (Sigma, St Louis, MO, USA), and insulin (Humulin R, Eli Lilly and Company, Indianapolis, IN, USA).
Immediately after preparation, anesthesia was switched to α-chloralose, which was administered i.v. as follows: 15 min after a 80 mg/kg bolus injection, a continuous i.v. infusion was started (26.7 mg/kg/h) to maintain a light anesthesia state according to previous report (Ueki et al. 1992). All solutions used for i.v. infusion were diluted in Dulbecco's Phosphate-Buffered Saline (without calcium chloride and without magnesium chloride, Sigma).
Arterial blood was withdrawn from the femoral artery through a polyethylene tubing line (PE50, Becton-Dickinson, Franklin Lakes, NJ, USA) roughly every 30 min. Around 0.05 mL of blood was used to measure physiological parameters with a pH/blood gas analyzer (AVL Compact 3 BGA, Roche Diagnostics, Rotkreuz, Switzerland) while the rest of the blood (~0.15 mL) was immediately centrifuged to obtain plasma. Plasma Glc concentration was measured using the Glc oxidase method in a Glc analyzer (GM7 Micro-stat, Analox Instruments, London, UK). Physiologic parameters (respiration rate and breathing volume) were adjusted throughout the experiments to maintain pCO2 and pH within normal physiological ranges (mean pH ± SD = 7.31 ± 0.04; mean pCO2 ± SD = 43.5 ± 1.8 and mean body temperature ± SD = 38.1 ± 0.2) (Morgenthaler et al. 2006).
The infusion rate of Glc (20% weight/volume in Dulbecco's Phosphate-Buffered Saline) was continuously adjusted based on the measured plasma Glc concentrations to maintain target glycemia. The IE of the infusate was calculated from the in vivo measurement of NAA IE at the beginning of each experiment (see below). Glc infusion rate was adjusted to maintain plasma Glc levels during insulin infusion (Morgenthaler et al. 2006).
In vivo magnetic resonance spectroscopy
In vivo magnetic resonance spectroscopy experiments were performed on an actively shielded 9.4 T/31 cm magnet (Magnex Scientific, Abingdon, Oxon, UK) with actively shielded gradients (400 mT/m in 120 ms, 12 cm inner diameter) connected to a Varian INOVA console (Varian, Palo, Alto, CA, USA). A quadrature 14 mm 1H coil combined with a three-turn linearly polarized 13C coil 10 mm diameter was used for radio frequency transmission and signal reception. A sphere containing 99% 13C-enriched formic acid (FA) was located at the center of the 13C coil as an external reference, and the coil was placed on the animal's head as described previously (Choi et al. 2001, 2000, 1999; Lei et al. 2007). FASTMAP (Gruetter and Tkac 2000) was applied in 100-150 μL volumes of interest to adjust magnetic field inhomogeneity. A Single-shot Inversion Recovery based Non-Echo sequence with optimized outer volume suppression (Choi et al. 2000) was applied for 3D localization (inversion time for glycogen was 0.12 s) to ensure elimination of signals from non-cerebral tissue (Choi et al. 2001, 2000, 1999; Lei et al. 2007). Bilevel WALTZ-16 RF pulses were applied at the 1H water frequency to generate a nuclear Overhauser effect and to decouple during acquisition (Choi et al. 2000; Lei et al. 2007). The robustness of localization was verified from the absence of the natural abundance lipid signal (30.5 ppm) in spectra optimized for the amino acid region by placing the carrier frequency at 30.5 ppm and thus minimizing the chemical shift displacement error (20-40 ppm) as lipid signals are not detectable in the normal brain in vivo (Choi and Gruetter 2003).
In vivo NAA IE measurement using 1H NMR
N-acetyl-aspartate IE was measured by 1H NMR using a localized ACED-STEAM sequence (Pfeuffer et al. 1999a). 256 scans (repetition time = 4 s; echo time TE = 7.9 ms; mixing time TM = 25 ms) were acquired in 17 min. In the 13C-edited 1H spectrum, only 1H bound to 13C in different metabolites were thus observed. The two interleaved recorded spectra were apodized by 5-Hz exponential line broadening, zero-filled and Fourier transformed. They were then subtracted and yielded the 1H-13C resonances and edited for JCH = 129 Hz. The non-edited 1H spectrum (Fig. 2a, upper spectrum) enabled the measurement of the [6-12C]-NAA 1H signal at 2.01 ppm (Pfeuffer et al. 1999b), while the 13C-edited 1H spectrum (Fig. 2a, lower spectrum) allowed to measure the doublet of the labeled [6-13C]-NAA molecule. As the downfield satellite at 2.17 ppm [6-13C]-NAA 1H signal was slightly overlapped by glutamate, only the 1.85 ppm [6-13C]-NAA 1H signal was used for measurement. NAA IE was thus obtained by dividing twice the intensity of the 1.85 ppm [6-13C]-NAA 1H signal, by twice the intensity of the 1.85 ppm [6-13C]-NAA 1H signal plus the [6-12C]-NAA 1H signal intensity.
Fig. 2.

Comparison of in vivo measurement of NAA Isotopic Enrichment (IE) with in vitro measurement. (a) Example of in vivo NAA spectra with and without editing. It can be observed that the 2.17 ppm 13C peak satellite is slightly larger because of glutamate contamination. (b) Example of in vitro spectrum. Signals are much better separated. *NAA-G. (c) In vivo measurement of [6-13C]-NAA IE is identical to in vitro measurement (n = 9 rats, paired t-test, p = 0.62). The result of linear regression is shown.
In vivo brain glycogen concentration measurement using 13C NMR
Glycogen and Glc signals were acquired in 34 min (2048 scans, repetition time = 1 s) using the Single-shot Inversion Recovery based Non-Echo sequence. They were summed, apodized by 25-Hz exponential line broadening, zero-filled, and Fourier transformed. Two blocks of spectra were acquired before insulin infusion (as baseline) and seven blocks after insulin infusion.
The glycogen C1 signal intensity was fitted by a Gaussian line shape with a fixed linewidth using the spectrometer software (Varian Inc.). The linewidth was obtained from the fit to a spectrum summing all acquisitions. Quantification was performed using the external reference method (Gruetter et al. 1991; Lei et al. 2007), based on the measurement of the signal from a phantom containing 500 mM of natural abundance oyster glycogen (Sigma). Phantom measurements were performed under identical experimental conditions (temperature, number of scans, position in the magnet, localized volume) to the in vivo studies.
In vivo 13C absolute glycogen concentration [Glyc]invivo was calculated by comparing the in vivo NMR signal with the phantom signal while taking the known phantom concentration [Glyc]phan and in vivo IE of glycogen IEGlyc into account as in previous studies (Choi et al. 1999; Lei et al. 2007). A correction for the difference in coil loading was made by multiplying by the ratio of the formic acid reference signal (IFA) in both cases, and by an experimentally determined correction factor (α = 0.98) for the slightly different magnetic relaxation behavior of rat and oyster glycogen under a short T1 and nuclear Overhauser effect. The final equation was:
| (2) |
Natural abundance in the oyster phantom solution was assumed to be 1.1% and [Glyc]phan was 500 mM.
Tissue analysis
At the end of each experiment, rats were killed using a focused microwave fixation device by applying 4 kW onto a 2 mL volume for 1.4-1.6 s (Gerling Applied Engineering, Inc., Modesto, CA, USA) which inactivates most brain enzymes before extraction or digestion, thereby minimizing possible in vitro glycogen loss (Kong et al. 2002). The anterior parts of the brain (excluding cerebellum) were dissected, and immediately placed into liquid nitrogen and manually reduced to powder with a pestle and mortar. Brain powder was stored at -80°C until further processing.
Glycogen assay
Biochemical measurement of brain glycogen was performed on brain extracts as previously described (Cruz and Dienel 2002; Morgenthaler et al. 2006). Briefly, 0.03 M HCl (500 μL) was carefully added to frozen brain powders (~200 mg) in tubes on dry ice. Brain powders were homogenized (ultrasonic processor, Cole-Parmer Instruments, Vernon Hills, IL, USA), heated to 90°C for 45 min and homogenized again. For the glycogen assay, sodium acetate (Sigma) was added to 200 μL samples in 0.03 M HCl. Well-mixed portions of each sample were incubated at 37°C for at least 2 h with gentle mixing in a water bath (Julabo SW 22, Milian, Gahanna, OH, USA) in two parallel aliquots, one containing amylo-α-1,4-α-1,6-glucosidase (24 μg/mL, Roche) to convert glycogen to Glc and the other without amylo-α-1,4-α-1,6-glucosidase (this latter sample allowed brain Glc concentration as well as IE measurements). Glc levels were determined using the same Analox instrument as above. Glycogen levels per gram wet weight were calculated as Glc released by amylo-α-1,4-α-1,6-glucosidase, that is, Glc level after incubation with amyloglucosidase minus that without the enzyme (Ghajar et al. 1982).
In vitro 1H-NMR: Glc IE, glycogen IE and NAA IE measurement
13C IE (see eqn 1) of NAA, Glc and digested glycogen were further determined in vitro by 1H NMR, using a Bruker Avance-DRX 600 (14.1 T, 600 MHz) spectrometer (Bruker BioSpin SA, Fällanden, Switzerland). Samples obtained from the glycogen assay were filtered (Ultrafree-CL filters, Millipore Corporation, Bedford, MA, USA) to remove high molecular weight molecules. They were lyophilized in a speedVac (DNA 120, SpeedVac Concentrator, Thermo electron corporation) and resuspended into 500 μL D2O (deuterium oxide, 99.9 atom % D, Aldrich, Germany).
For [1-13C]-Glc IE measurement, 1H spectra were acquired at 44°C using a delay time of 15 s. The 1H NMR spectra were calibrated with H2O (HDO) fixed at 4.6 ppm upfield to tetramethylsilane (internal standard for NMR calibration). The level of [1-13C]-Glc was determined by appropriate integration of the 1H signals (bound to Glc C1) of the α-anomer. 1H signals consisted of a doublet for the unlabeled molecule (chemical shift: ~5.28 ppm, 3JH1,H2 = ~3.7 Hz) and a doublet of doublets for the C1-labeled molecule [the 1JC1,H1 coupling (~170 Hz) superimposed on the smaller 3JH1,H2 coupling (~3.7 Hz)].
In vitro the IE of Glc was calculated from applying eqn 1 to the integrals obtained from the in vitro spectrum. Brain Glc IE was directly measured with the high resolution 600 MHz magnet. Brain glycogen IE was calculated according to eqn 3 after having processed the brain extracts with the glycogen assay so that the glycogen molecule was digested into Glc molecular units (Lei et al. 2007).
| (3) |
Total Glc (TotalGlc) represents brain Glc (BrainGlc) plus digested brain glycogen, i.e. measurement performed in samples subjected to amyloglucosidase digestion. Total Glc and brain Glc IE were obtained by high field 1H-spectroscopy, and brain Glc and glycogen concentrations were obtained by biochemical measurement.
After having measured brain Glc and `total Glc' IE, the pH of the samples was lowered to 1.8 with 0.1 M DCl. 1H NMR spectra were acquired at 25°C with a repetition time of 9 s. They were calibrated with H2O (HDO) fixed at 4.8 ppm upfield to tetramethylsilane. The level of [6-13C]-NAA IE was determined by appropriate integration (see above) of the 1H signals bound to NAA C6. 1H signals consisted of a single peak for the unlabeled molecule (chemical shift: ~2.01 ppm) and a doublet for the C6-labeled molecule (1JC1,H1 coupling: ~129 Hz). In vitro NAA IE was calculated from eqn 1 (Fig. 2b).
Results
During the `pre-labeling period', the rats ingested significant amounts of [1-13C]-labeled Glc solution either for 24 h [mean Glc solution (10% w/v) ingested ± SD: 122 ± 27 mL, n = 11] or for 48 h (170 ± 68 mL, n = 6).
With the first group of rats (n = 11), our pre-labeling method was validated as follows: There was no significant difference between NAA IE measured in vivo and subsequently in vitro in the same brains (Fig. 2c, n = 9, paired t-test, p = 0.62) confirming the validity of the in vivo measurement of NAA IE. NAA IE was correlated (n = 11, R2 = 0.82) with the amount of [1-13C]-Glc ingested by each rat (Fig. 3) and no significant difference could be observed between 24 or 48 h of pre-labeling. There was also less variability in the amount of 13C-labeled Glc solution ingested by the rats after 24 h than after 48 h. We therefore decided to pre-label the rats only during 24 h for the rest of the experiments. The biochemical measurements of glycogen concentration in the post-mortem brain extracts yielded 4.5 ± 1.0 μmol/g (mean ± SD). Finally, the in vitro measurement of glycogen IE allowed us to measure the relationship between glycogen IE and NAA IE; glycogen IE was 2.2 ± 0.1 times that of NAA IE (mean ± SD, n = 11, Fig. 4b) as expected from the breakdown of [1-13C]-Glc into two molecules of acetyl-CoA. Taken together these results (see Figs 2c and 4b in particular) showed that brain glycogen IE can be inferred from the in vivo measurement of NAA IE after 24 h of pre-labeling.
Fig. 3.
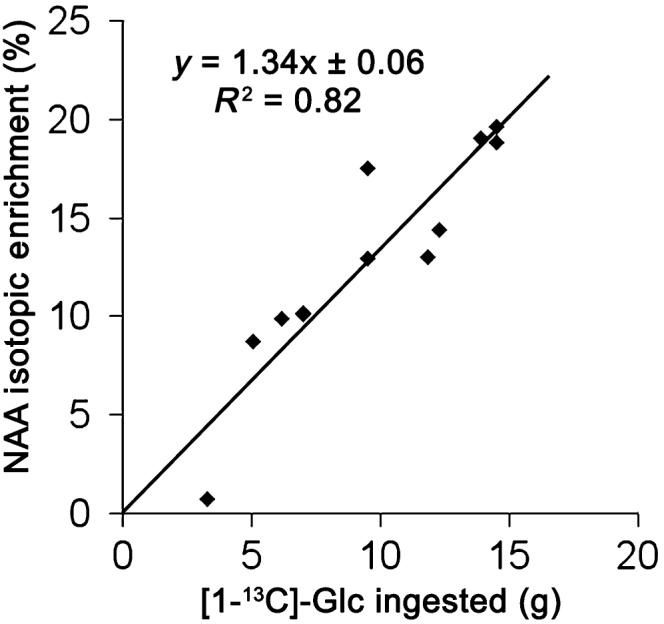
NAA IE is correlated with the amount of [1-13C]-Glc ingested by the rat. [6-13C]-NAA IE as a function of the amount of [1-13C]-Glc ingested (in grams) by the rat (n = 11). Shown is the result of linear regression.
Fig. 4.

At isotopic near steady-state enrichment, NAA IE reflects glycogen IE. (a) Example of in vitro Glc 1H resonance of the α-anomer at 5.28 ppm used for calculating brain Glc and glycogen IE. (b) In vitro measurement of 13C-glycogen IE as a function of [6-13C]-NAA IE after [1-13C]-Glc ingestion (n = 11). Shown is the result of linear regression.
With the second group of rats (n = 6), we measured brain glycogen absolute concentration in vivo after 24 h of pre-labeling (Fig. 5). From the NAA IE (mean percentage ± SD: 15.3 ± 2.3%, n = 6), the IE of the Glc infusion solution was adjusted to 36 ± 6% based on the 2.2-fold difference in IE (see above). Nine blocks of glycogen spectra were then acquired. The first two blocks were taken as reference. Insulin infusion (24 IU/kg) was then started and plasma Glc was maintained at 10 mM (mean plasma Glc ± SD: 10.7 ± 0.5 mM, n = 6) by adjusting the infusion rate of the Glc solution. The brain 13C-glycogen signal (Fig. 5b) was typically detected with a high signal to noise ratio on the order of 8 : 1. Absolute glycogen concentration obtained in vivo (mean ± SD: 5.8 ± 0.7 μmol/g, n = 6)by 13C NMR was in excellent agreement with biochemical determination (mean ± SD: 6.4 ± 0.6 μmol/g, n = 5, paired t-test, p = 0.12, Fig. 5c). At the end of 7 h of Glc infusion, brain Glc IE was similar to the IE of the infused Glc solution (n = 6, paired t-test, p = 0.52, data not shown) and glycogen IE (n = 6, paired t-test, p = 0.37, Fig. 6).
Fig. 5.

In vivo measurement of brain glycogen absolute concentration. (a) Scheme summarizing the experimental protocol for `time course experiments'. (b) Example of in vivo 13C NMR spectrum showing localized detection of [1-13C]-glycogen and [1-13C]-Glc (α and β anomers). (c) No significant difference between glycogen absolute concentration measured in vivo by NMR spectroscopy (last measurement before kill) and in vitro in the post-mortem brain extracts (n = 5 rats, paired t-test, p = 0.12). Error bars indicate SD.
Fig. 6.
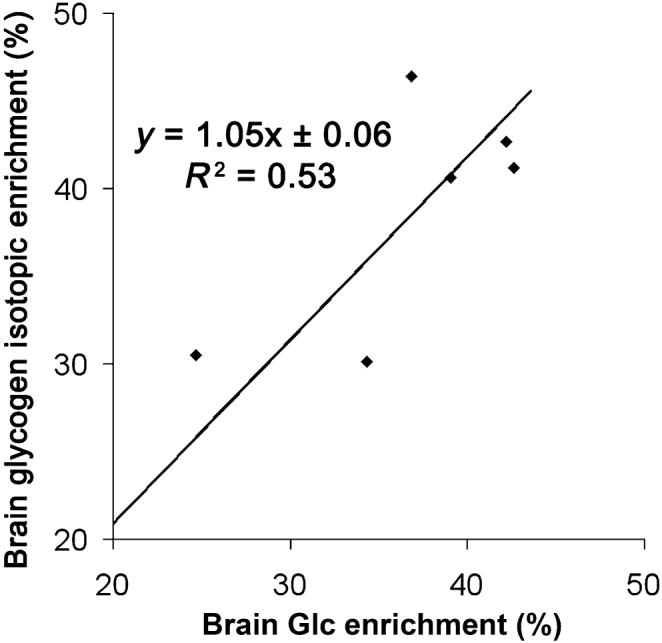
Glycogen turnover is complete. At the end of the time course experiment, brain glycogen isotopic enrichment was similar to the isotopic enrichment of brain Glc (n = 6 rats). Shown is the result of linear regression.
Finally, the effects of insulin infusion on brain glycogen concentration were investigated in vivo and over time. The infusion of insulin together with Glc over 4.5 h did not significantly affect brain glycogen concentration measured by in vivo NMR (n = 5 rats, paired t-test between the last measurement before insulin infusion and the last measurement during insulin infusion, p = 0.5) (Fig. 7).
Fig. 7.

Apparent stability of the time-resolved NMR signal of glycogen during insulin infusion. (a) Time resolved stack plot (one spectrum each 34 min) of in vivo 13C spectra acquired in one rat showing localized detection of [1-13C]-glycogen and [1-13C]-Glc (α and β anomers). Whereas [1-13C]-Glc infusion was performed during the whole experiment (to maintain plasma glycemic levels around 10 mM) at an IE matching that estimated for glycogen, insulin infusion was started after the acquisition of the first two spectra (shown in grey). (b) Mean brain glycogen concentration (n = 5 rats) over time. n = 5 out of the six rats of this group; absolute quantification of glycogen was not possible in one rat because of instrument failure. The arrow indicates when insulin infusion started. Error bars indicate SEM.
Discussion
We show for the first time that the non-invasive measurement of brain glycogen concentration is feasible. This is possible by accurate quantification of the labeled proportion of the glycogen molecule and therefore of the total brain glycogen content. Matching the IE of the Glc infusate solution to the IE of glycogen allowed us to perform time-resolved measurement of brain glycogen concentration.
The in vivo brain glycogen concentration obtained by 13C NMR spectroscopy in the present study was similar to subsequent biochemical measurement in the same brain and to previous biochemical measurements of brain glycogen concentration (mean ± SD: 6.2 ± 0.6 μmol/g). Furthermore, the in vitro measurements of brain glycogen concentration of the first group of rats were in perfect agreement with previous measurement made in rats after short isoflurane anesthesia (Morgenthaler et al. 2006). As expected, the pre-labeling protocol did not alter brain glycogen concentration, which is consistent with Glc being sufficient for brain metabolism under these conditions.
That brain Glc IE was similar to the IE of the Glc infusate at the end of the time course experiments was expected from the rapid equilibration of plasma Glc across the blood brain barrier (Choi et al. 2001; Gruetter et al. 1998). Moreover, the stability of the IE of glycogen over 7 h of Glc infusion equaling that of brain Glc suggests near complete turnover of the glycogen molecule after a 24 h pre-labeling period. As a consequence, glycogen turnover is unlikely to be a confounding effect after 24 h of pre-labeling. Since 24 h of pre-labeling seem sufficient to nearly reach isotopic steady-state, we conclude that the slower turnover time of limit dextrin (Watanabe and Passonneau 1973) is sufficiently fast to lead to near-complete turnover in 24 h. As the pre-labeling period of 24 h is longer than glycogen (Choi et al. 1999; Oz et al. 2007; Watanabe and Passonneau 1973) and NAA (Choi and Gruetter 2003) turnover times, the IE of both of these molecules should be close to steady-state. In other words, both turnover curves are expected to evolve in a similar manner.
N-acetyl-aspartate was chosen as a `reporter molecule' to estimate glycogen IE for two main reasons. First, NAA has a similar turnover time to glycogen (Choi and Gruetter 2003) and second NAA is synthesized early in the Glc metabolic pathway, just after glycolysis. The ratio close to 2 : 1 between glycogen IE and NAA IE observed here suggests that Glc is the major source of NAA biosynthesis.
The effect of insulin on brain glycogen metabolism measured previously by 13C NMR suggested a several fold increase in glycogen concentration or metabolism (Choi et al. 2003). However, when measured with biochemical methods (Morgenthaler et al. 2006) the increase in glycogen concentration after insulin infusion was less than 1 μmol/g over 4.5-5 h of insulin (6 units/kg/h) infusion. The present study did not show a significant increase of brain glycogen concentration over time, however, the average SEM of 0.5 μmol/g corresponding to a 95% confidence interval of about ± 1 μmol/g allows for such small increases. These results suggest that insulin has a modest effect on glycogen concentration (around 1.0 μmol/g over 4.5 h). Therefore, the present study is within experimental error in very good agreement with the previous biochemical determination of glycogen concentration (Morgenthaler et al. 2006) rather than the previous 13C NMR measurements with rats that had not been pre-labeled (Choi et al. 2003). Together with the previous NMR observation of several-fold increased 13C incorporation into glycogen (Choi et al. 2003), the apparent stability of the glycogen signal in the current study implies that insulin mainly increases glycogen turnover rather than glycogen concentration. The modest effect of insulin on glycogen concentration and the more pronounced effect on turnover are consistent with insulin crossing the blood brain barrier (Banks 2004) and affecting insulin sensitive pathways such as glycogen metabolism.
We have previously shown that acute hypoglycemia promoted glycogenolysis at an enhanced rate (Choi et al. 2003, 1999). This increased glycogenolysis was not compensated by enhanced glycogen synthesis as it resulted in net reduction of glycogen concentration (Morgenthaler et al. 2006). Previous studies have reported changes in glycogen concentration during physiological activation (Cruz and Dienel 2002; Dienel et al. 2007; Swanson et al. 1992), which were performed at euglycemia and in awake animals, unlike the present study. It is quite possible that insulin acts on glycogen by a different mechanism than activation, likely mediated in the latter case by noradrenergic mechanisms (Gibbs et al. 2008b; Sorg and Magistretti 1991).
We conclude that pre-labeling a rat with [1-13C]-labeled Glc for 24 h is adequate to obtain nearly total turnover of the glycogen molecule, to measure glycogen absolute concentration, and to monitor glycogen concentration changes over time. Moreover, this protocol shows that insulin activates brain glycogen synthesis and breakdown simultaneously.
We further conclude that brain glycogen absolute concentration can be measured in vivo in a time-resolved manner, which should allow important insight into the role of glycogen in glial cells.
Acknowledgements
We wish to thank Arthur Magill for his careful reading of the manuscript. This work was supported by the `Centre d'Imagerie Biomédicale' (CIBM) of the University of Lausanne (UNIL), the Federal Institute of Technology in Lausanne (EPFL), the University of Geneva (UniGe), the `Centre Hospitalier Universitaire Vaudois' (CHUV) and the `Hôpitaux Universitaires Genevois' (HUG); and by the Leenards and the Jeantet Foundations; and by NIH grant R01NS042005.
Abbreviations used
- IE
isotopic enrichment
- NAA
N-acetyl-aspartate
References
- Allen NJ, Karadottir R, Attwell D. A preferential role for glycolysis in preventing the anoxic depolarization of rat hippocampal area CA1 pyramidal cells. J. Neurosci. 2005;25:848–859. doi: 10.1523/JNEUROSCI.4157-04.2005. [DOI] [PMC free article] [PubMed] [Google Scholar]
- Banks WA. The source of cerebral insulin. Eur. J. Pharmacol. 2004;490:5–12. doi: 10.1016/j.ejphar.2004.02.040. [DOI] [PubMed] [Google Scholar]
- Brown AM, Ransom BR. Astrocyte glycogen and brain energy metabolism. Glia. 2007;55:1263–1271. doi: 10.1002/glia.20557. [DOI] [PubMed] [Google Scholar]
- Brown AM, Tekkok SB, Ransom BR. Glycogen regulation and functional role in mouse white matter. J. Physiol. 2003;549:501–512. doi: 10.1113/jphysiol.2003.042416. [DOI] [PMC free article] [PubMed] [Google Scholar]
- Brown AM, Sickmann HM, Fosgerau K, Lund TM, Schousboe A, Waagepetersen HS, Ransom BR. Astrocyte glycogen metabolism is required for neural activity during aglycemia or intense stimulation in mouse white matter. J. Neurosci. Res. 2005;79:74–80. doi: 10.1002/jnr.20335. [DOI] [PubMed] [Google Scholar]
- Choi IY, Gruetter R. In vivo 13C NMR assessment of brain glycogen concentration and turnover in the awake rat. Neurochem. Int. 2003;43:317–322. doi: 10.1016/s0197-0186(03)00018-4. [DOI] [PubMed] [Google Scholar]
- Choi IY, Tkac I, Ugurbil K, Gruetter R. Noninvasive measurements of [1-(13)C]glycogen concentrations and metabolism in rat brain in vivo. J. Neurochem. 1999;73:1300–1308. doi: 10.1046/j.1471-4159.1999.0731300.x. [DOI] [PubMed] [Google Scholar]
- Choi IY, Tkac I, Gruetter R. Single-shot, three-dimensional “non-echo” localization method for in vivo NMR spectroscopy. Magn. Reson. Med. 2000;44:387–394. doi: 10.1002/1522-2594(200009)44:3<387::aid-mrm8>3.0.co;2-3. [DOI] [PubMed] [Google Scholar]
- Choi IY, Lee SP, Kim SG, Gruetter R. In vivo measurements of brain glucose transport using the reversible Michaelis-Menten model and simultaneous measurements of cerebral blood flow changes during hypoglycemia. J. Cereb. Blood Flow Metab. 2001;21:653–663. doi: 10.1097/00004647-200106000-00003. [DOI] [PubMed] [Google Scholar]
- Choi IY, Seaquist ER, Gruetter R. Effect of hypoglycemia on brain glycogen metabolism in vivo. J. Neurosci. Res. 2003;72:25–32. doi: 10.1002/jnr.10574. [DOI] [PMC free article] [PubMed] [Google Scholar]
- Cruz NF, Dienel GA. High glycogen levels in brains of rats with minimal environmental stimuli: implications for metabolic contributions of working astrocytes. J. Cereb. Blood Flow Metab. 2002;22:1476–1489. doi: 10.1097/01.WCB.0000034362.37277.C0. [DOI] [PubMed] [Google Scholar]
- Cryer PE. Mechanisms of hypoglycemia-associated autonomic failure and its component syndromes in diabetes. Diabetes. 2005;54:3592–3601. doi: 10.2337/diabetes.54.12.3592. [DOI] [PubMed] [Google Scholar]
- Cryer PE. Hypoglycemia in diabetes: pathophysiological mechanisms and diurnal variation. Prog. Brain Res. 2006;153:361–365. doi: 10.1016/S0079-6123(06)53021-3. [DOI] [PubMed] [Google Scholar]
- Dienel GA, Cruz NF. Neighborly interactions of metabolically-activated astrocytes in vivo. Neurochem. Int. 2003;43:339–354. doi: 10.1016/s0197-0186(03)00021-4. [DOI] [PubMed] [Google Scholar]
- Dienel GA, Cruz NF. Nutrition during brain activation: does cell-to-cell lactate shuttling contribute significantly to sweet and sour food for thought? Neurochem. Int. 2004;45:321–351. doi: 10.1016/j.neuint.2003.10.011. [DOI] [PubMed] [Google Scholar]
- Dienel GA, Ball KK, Cruz NF. A glycogen phosphorylase inhibitor selectively enhances local rates of glucose utilization in brain during sensory stimulation of conscious rats: implications for glycogen turnover. J. Neurochem. 2007;102(2):466–478. doi: 10.1111/j.1471-4159.2007.04595.x. [DOI] [PMC free article] [PubMed] [Google Scholar]
- Ghajar JB, Plum F, Duffy TE. Cerebral oxidative metabolism and blood flow during acute hypoglycemia and recovery in unanesthetized rats. J. Neurochem. 1982;38:397–409. doi: 10.1111/j.1471-4159.1982.tb08643.x. [DOI] [PubMed] [Google Scholar]
- Gibbs ME, Anderson DG, Hertz L. Inhibition of glycogenolysis in astrocytes interrupts memory consolidation in young chickens. Glia. 2006;54:214–222. doi: 10.1002/glia.20377. [DOI] [PubMed] [Google Scholar]
- Gibbs ME, Lloyd HG, Santa T, Hertz L. Glycogen is a preferred glutamate precursor during learning in 1-day-old chick: biochemical and behavioral evidence. J. Neurosci. Res. 2007;85:3326–3333. doi: 10.1002/jnr.21307. [DOI] [PubMed] [Google Scholar]
- Gibbs ME, Bowser DN, Hutchinson DS, Loiacono RE, Summers RJ. Memory processing in the avian hippo-campus involves interactions between beta-adrenoceptors, gluta-mate receptors, and metabolism. Neuropsychopharmacology. 2008a;33(12):2831–2846. doi: 10.1038/npp.2008.5. [DOI] [PubMed] [Google Scholar]
- Gibbs ME, Hutchinson D, Hertz L. Astrocytic involvement in learning and memory consolidation. Neurosci. Biobehav. Rev. 2008b;32(5):927–944. doi: 10.1016/j.neubiorev.2008.02.001. [DOI] [PubMed] [Google Scholar]
- Gruetter R. Glycogen: the forgotten cerebral energy store. J. Neurosci. Res. 2003;74:179–183. doi: 10.1002/jnr.10785. [DOI] [PubMed] [Google Scholar]
- Gruetter R, Tkac I. Field mapping without reference scan using asymmetric echo-planar techniques. Magn. Reson. Med. 2000;43:319–323. doi: 10.1002/(sici)1522-2594(200002)43:2<319::aid-mrm22>3.0.co;2-1. [DOI] [PubMed] [Google Scholar]
- Gruetter R, Prolla TA, Shulman RG. 13C NMR visibility of rabbit muscle glycogen in vivo. Magn. Reson. Med. 1991;20:327–332. doi: 10.1002/mrm.1910200216. [DOI] [PubMed] [Google Scholar]
- Gruetter R, Ugurbil K, Seaquist ER. Steady-state cerebral glucose concentrations and transport in the human brain. J. Neurochem. 1998;70:397–408. doi: 10.1046/j.1471-4159.1998.70010397.x. [DOI] [PubMed] [Google Scholar]
- Gruetter R, Adriany G, Choi IY, Henry PG, Lei H, Oz G. Localized in vivo 13C NMR spectroscopy of the brain. NMR Biomed. 2003;16:313–338. doi: 10.1002/nbm.841. [DOI] [PMC free article] [PubMed] [Google Scholar]
- Karelson G, Ziegler A, Kunnecke B, Seelig J. Feeding versus infusion: a novel approach to study the NAA metabolism in rat brain. NMR Biomed. 2003;16:413–423. doi: 10.1002/nbm.845. [DOI] [PubMed] [Google Scholar]
- Kong J, Shepel PN, Holden CP, Mackiewicz M, Pack AI, Geiger JD. Brain glycogen decreases with increased periods of wakefulness: implications for homeostatic drive to sleep. J. Neurosci. 2002;22:5581–5587. doi: 10.1523/JNEUROSCI.22-13-05581.2002. [DOI] [PMC free article] [PubMed] [Google Scholar]
- Lei H, Morgenthaler F, Yue T, Gruetter R. Direct validation of in vivo localized 13C MRS measurements of brain glycogen. Magn. Reson. Med. 2007;57:243–248. doi: 10.1002/mrm.21128. [DOI] [PMC free article] [PubMed] [Google Scholar]
- Magistretti PJ, Pellerin L. Cellular bases of brain energy metabolism and their relevance to functional brain imaging: evidence for a prominent role of astrocytes. Cereb. Cortex. 1996;6:50–61. doi: 10.1093/cercor/6.1.50. [DOI] [PubMed] [Google Scholar]
- Morgenthaler FD, Koski DM, Kraftsik R, Henry PG, Gruetter R. Biochemical quantification of total brain glycogen concentration in rats under different glycemic states. Neurochem. Int. 2006;48:616–622. doi: 10.1016/j.neuint.2005.12.034. [DOI] [PMC free article] [PubMed] [Google Scholar]
- Nordstrom CH, Siesjo BK. Effects of phenobarbital in cerebral ischemia. Part I: cerebral energy metabolism during pronounced incomplete ischemia. Stroke. 1978;9:327–335. doi: 10.1161/01.str.9.4.327. [DOI] [PubMed] [Google Scholar]
- Oz G, Henry PG, Seaquist ER, Gruetter R. Direct, noninvasive measurement of brain glycogen metabolism in humans. Neurochem. Int. 2003;43:323–329. doi: 10.1016/s0197-0186(03)00019-6. [DOI] [PubMed] [Google Scholar]
- Oz G, Seaquist ER, Kumar A, Criego AB, Benedict LE, Rao JP, Henry PG, Van De Moortele PF, Gruetter R. Human brain glycogen content and metabolism: implications on its role in brain energy metabolism. Am. J. Physiol. Endocrinol. Metab. 2007;292:E946–E951. doi: 10.1152/ajpendo.00424.2006. [DOI] [PubMed] [Google Scholar]
- Pfeuffer J, Tkac I, Choi IY, Merkle H, Ugurbil K, Garwood M, Gruetter R. Localized in vivo 1H NMR detection of neurotransmitter labeling in rat brain during infusion of [1-13C] D-glucose. Magn. Reson. Med. 1999a;41:1077–1083. doi: 10.1002/(sici)1522-2594(199906)41:6<1077::aid-mrm1>3.0.co;2-#. [DOI] [PubMed] [Google Scholar]
- Pfeuffer J, Tkac I, Provencher SW, Gruetter R. Toward an in vivo neurochemical profile: quantification of 18 metabolites in short-echo-time (1)H NMR spectra of the rat brain. J. Magn. Reson. 1999b;141:104–120. doi: 10.1006/jmre.1999.1895. [DOI] [PubMed] [Google Scholar]
- Rossi DJ, Brady JD, Mohr C. Astrocyte metabolism and signaling during brain ischemia. Nat. Neurosci. 2007;10:1377–1386. doi: 10.1038/nn2004. [DOI] [PMC free article] [PubMed] [Google Scholar]
- Shulman RG, Hyder F, Rothman DL. Cerebral energetics and the glycogen shunt: neurochemical basis of functional imaging. Proc. Natl Acad. Sci. USA. 2001;98:6417–6422. doi: 10.1073/pnas.101129298. [DOI] [PMC free article] [PubMed] [Google Scholar]
- Sorg O, Magistretti PJ. Characterization of the glycogenolysis elicited by vasoactive intestinal peptide, noradrenaline and adenosine in primary cultures of mouse cerebral cortical astrocytes. Brain Res. 1991;563:227–233. doi: 10.1016/0006-8993(91)91538-c. [DOI] [PubMed] [Google Scholar]
- Sorg O, Magistretti PJ. Vasoactive intestinal peptide and noradrenaline exert long-term control on glycogen levels in astrocytes: blockade by protein synthesis inhibition. J. Neurosci. 1992;12:4923–4931. doi: 10.1523/JNEUROSCI.12-12-04923.1992. [DOI] [PMC free article] [PubMed] [Google Scholar]
- Suh SW, Bergher JP, Anderson CM, Treadway JL, Fosgerau K, Swanson RA. Astrocyte glycogen sustains neuronal activity during hypoglycemia: studies with the glycogen phosphorylase inhibitor CP-316,819 ([R-R*,S*]-5-chloro-N-[2-hydroxy-3-(methoxymethylamino)-3-oxo-1-(phenylmet hyl)propyl]-1H-indole-2-carboxamide) J. Pharmacol. Exp. Ther. 2007;321:45–50. doi: 10.1124/jpet.106.115550. [DOI] [PubMed] [Google Scholar]
- Swanson RA. Physiologic coupling of glial glycogen metabolism to neuronal activity in brain. Can. J. Physiol. Pharmacol. 1992;70(Suppl):S138–S144. doi: 10.1139/y92-255. [DOI] [PubMed] [Google Scholar]
- Swanson RA, Choi DW. Glial glycogen stores affect neuronal survival during glucose deprivation in vitro. J. Cereb. Blood Flow Metab. 1993;13:162–169. doi: 10.1038/jcbfm.1993.19. [DOI] [PubMed] [Google Scholar]
- Swanson RA, Morton MM, Sagar SM, Sharp FR. Sensory stimulation induces local cerebral glycogenolysis: demonstration by autoradiography. Neuroscience. 1992;51:451–461. doi: 10.1016/0306-4522(92)90329-z. [DOI] [PubMed] [Google Scholar]
- Ueki M, Mies G, Hossmann KA. Effect of alpha-chloralose, halothane, pentobarbital and nitrous oxide anesthesia on metabolic coupling in somatosensory cortex of rat. Acta Anaesthesiol. Scand. 1992;36:318–322. doi: 10.1111/j.1399-6576.1992.tb03474.x. [DOI] [PubMed] [Google Scholar]
- Watanabe H, Passonneau JV. Factors affecting the turnover of cerebral glycogen and limit dextrin in vivo. J. Neurochem. 1973;20:1543–1554. doi: 10.1111/j.1471-4159.1973.tb00272.x. [DOI] [PubMed] [Google Scholar]