Abstract
Cell adhesion is mediated by specific receptor—ligand bonds. In several biological systems, increasing flow has been observed to enhance cell adhesion despite the increasing dislodging fluid shear forces. Flow-enhanced cell adhesion includes several aspects: flow augments the initial tethering of flowing cells to a stationary surface, slows the velocity and increases the regularity of rolling cells, and increases the number of rollingly adherent cells. Mechanisms for this intriguing phenomenon may include transport-dependent acceleration of bond formation and force-dependent deceleration of bond dissociation. The former includes three distinct transport modes: sliding of cell bottom on the surface, Brownian motion of the cell, and rotational diffusion of the interacting molecules. The latter involves a recently demonstrated counterintuitive behavior called catch bonds where force prolongs rather than shortens the lifetimes of receptor—ligand bonds. In this article, we summarize our recently published data that used dimensional analysis and mutational analysis to elucidate the above mechanisms for flow-enhanced leukocyte adhesion mediated by L-selectinligand interactions.
Keywords: Shear stress, Catch bonds, Tethering rate, Selectins, On-rate, Off-rate
INTRODUCTION
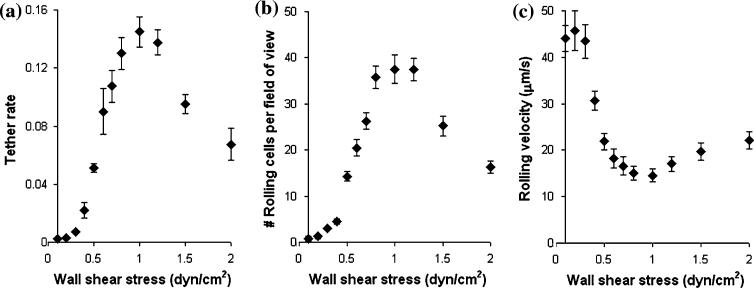
Adhesion of blood cells to vascular surfaces occurs in a varying hydrodynamic environment of the circulation. Paradoxically, flow enhances adhesion in some systems. For example, leukocytes require a threshold shear to tether to and roll on endothelial cells at sites of inflammation and injury.2,7 Several aspects of flow-enhanced leukocyte adhesion are illustrated in Fig. 1. As wall shear stress drops below the threshold, fewer cells tether (Fig. 1a) and roll (Fig. 1b), and those that do roll more rapidly (Fig. 1c) and less regularly and detach more easily, which also reduces the number of rollingly adherent cells (Fig. 1b). These are counterintuitive because the higher the wall shear stress, the larger the dislodging forces exerted on the cells by the fluid. After reaching an optimal level (∼1 dyn/cm2 in Fig. 1), further increase in wall shear stress results in a decrease in tether rate (Fig. 1a), a decrease in the number of rollingly adherent cells (Fig. 1b), and an increase in rolling velocity (Fig. 1c), which are intuitive. As another example, platelets require a minimum flow to tether to and roll on the extracellular matrix of the vessel wall exposed after rupture of the endothelium lining.1,15 In addition, some enteric bacteria require a minimum flow to adhere to intestinal epithelia.18
FIGURE 1.
Increasing wall shear stress in a flow chamber initially enhances L-selectin-mediated neutrophil tethering (a) and rolling adhesion (b) to a surface coated with P-selectin glycoprotein ligand 1 (PSGL-1) and reduces the neutrophil rolling velocity on PSGL-1 (c). After reaching an optimal level (∼1 dyn/cm2), further increase in wall shear stress decreases neutrophil tethering (a) and rolling adhesion (b) and increases the neutrophil rolling velocity (c). A suspension of 106 cells/mL was used in these experiments. Tether rate in (a) was measured at each wall shear stress by counting the number of flowing cells that initially tethered to a chamber floor coated with <10 PSGL-1 molecules/μm2 and dividing this number by the total number of cells flowing through the microscope field of view of in one minute. Neutrophil accumulation in (b) was measured at each wall shear stress as the number of cells per microscope field of view rolling on chamber floor coated with 140 PSGL-1 molecules/μm2. Rolling velocity in (c) was measured from cells in (b) rolling for 1 s. Data are presented as mean ± s.e.m. of four or five independent experiments.
Cell adhesion is mediated by specific interactions between adhesive receptors and ligands on the cell surface. In the above examples, leukocyte adhesion to vascular endothelium is mediated by interactions of selectins with glycoconjugates, e.g., P-selectin glyco-protein ligand 1 (PSGL-1). Platelet adhesion to damaged vessel wall is mediated by interactions of platelet glycoprotein Ib (GPIb) with von Willebrand factor (VWF). Bacterium adhesion to intestinal epithelium is mediated by interactions of FimH receptor with mannosylated glycoproteins. The interplay of these molecular interactions with flow is primarily responsible for the counterintuitive flow-enhanced cell adhesion, since flow-enhanced adhesion can be reconstituted in cell-free systems using purified adhesive receptors and ligands. Receptor—ligand interactions are governed by the kinetics of rapid transition between bound and unbound states. Therefore, flow most likely exerts its effects through alteration of these kinetic rates. Using recently published data, in the following sections we will first show that flow-enhanced cell tethering (cf. Fig. 1a) is due to the interplay of transport and the kinetic on-rate (kon) for the formation of receptor—ligand bonds. We will then show that flow-enhanced rolling (cf. Fig. 1c) is due to an unusual force regulation of the kinetic off-rate (koff) for the dissociation of receptor—ligand bonds. We will use two complementary approaches to demonstrate our cases. Firstly, dimensional analysis, a powerful tool in engineering, is employed to dissect mechanisms in a biological system. Secondly, mutational analysis, a powerful tool in life science, is employed to confirm predictions of molecular dynamics (MD) simulations.
TRANSPORT GOVERNS FLOW-ENHANCED CELL TETHERING
Conceptual Scheme of Tethering Process
For a cell (or microsphere) that moves with flowing blood to tether, its receptors must contact ligands on the vascular surface (or flow chamber floor in our experiments) for a sufficient duration. A contact requires a sufficiently small gap distance between the cell bottom and the surface for a receptor to reach a ligand. Tethering is a result of bond formation between the cell and the surface, which should be proportional to the densities of receptors (mr) and ligands (ml) as well as the contact area according to the law of mass action. The contact area Ai is proportional to the cell radius r and the combined length of the interacting molecules lm in excess of the gap distance li (Fig. 2a). The cell is subjected to Brownian motion that randomly modulates the gap distance above and below the contact threshold z = lm, breaking the observation time into alternating periods of brief contact (ti) and noncontact (tj) (Fig. 2b). The receptors and ligands are also subjected to rotational diffusion, which orients their binding sites for molecular docking (Fig. 2b). Hydrodynamic theory for motion of a sphere near a wall3,5 predicts that the angular velocity Ω of the sphere rotation cannot keep up with the translational velocity V of its center for pure rolling, such that the sphere bottom slides on the wall with a sliding velocity Vs ≡ V - rΩ proportional to where is the wall shear rate (Fig. 2a). It has been shown that the probability Pa for a cell to tether before it flows a distance x over the surface is:11
| (1) |
where the probability pad for a cell to tether per unit distance is:21
| (2) |
where ϕ is the collision frequency and 2πrlctc = 〈Aiti〉 is cross-correlation of contact area and contact time. Tether rate (TR) is defined as the ratio of the number of tethering events to the total number of cells flowing through the field of view of length L in a given period (e.g., 1 min).
FIGURE 2.
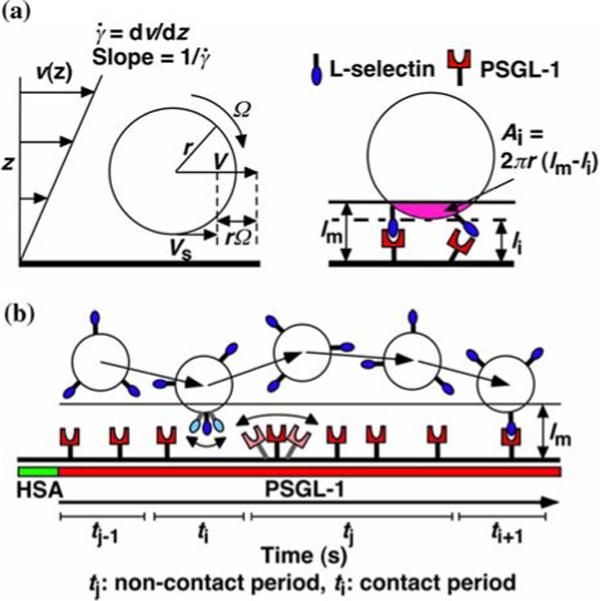
Parameters of cell tethering under flow. (a) The fluid velocity v of a Couette flow field is parallel to the surface and increases linearly with the distance from the surface (z direction). The shear rate . The sphere bottom has a positive velocity Vs ≡ V - rΩ where V is the translational velocity of the sphere center, Ω is the angular velocity of the sphere, and r is the sphere radius. The sphere and the surface are respectively coated with receptors and ligands whose combined length lm sets a contact threshold. When the gap distance li between the sphere bottom and the surface is less than lm, the two are in contact with an area Ai = 2πr(lm - li). (b) The sphere is susceptible to thermal excitations that cause Brownian motion. This produces fluctuations in sphere z-position, which are depicted by the wavy trajectory of the sphere shown in five different times and positions. Brownian motion randomly modulates the gap distance above and below the threshold, which causes discontinuous contacts between different portions of the sphere and different portions of the surface with alternating intervals of contact (ti) and noncontact (tj). A productive contact results in a tethering event, but many contacts are nonproductive. As schematically shown for one receptor and one ligand by the movements along the two-sided arrows (depicted by lighter colors), the binding sites of L-selectin and PSGL-1 can undergo rotational diffusion about anchor points such as interdomain hinges even though portions of the molecules are anchored to the respective sphere surface and chamber floor. To ensure that only first-time tethering events were observed, the chamber floor upstream to the microscope field of view was coated with HSA to allow measurement of the distance traveled by the sphere from the demarcation line to the location where tethering occurs. The cell, contact area and molecular sizes are not drawn to scale. Reproduced from Yago et al.21
Conceptually, bond formation can be divided into two steps: transport that brings two molecules in close proximity and reaction during which the interacting molecules dock. Depending on the relative time scales of the two steps, tethering can be transport-limited or reaction-limited. A faster transport produces more frequent collisions but also shortens the contact durations, which decreases cell tethering in the reaction-limited regime. The conceptual framework depicted in Fig. 2 was presented in Ref. 21, which used Eq. (2) as a guide to experiments that generated the data in Figs. 3-5 and the analysis below to examine how the adhesion probability per distance pad depends on various transport mechanisms.
FIGURE 3.
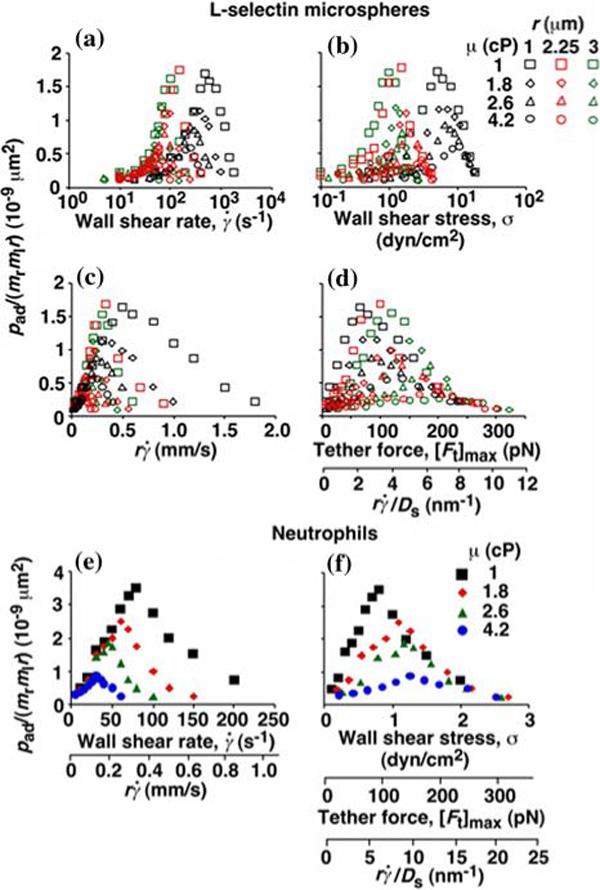
Adhesion probabilities per distance, pad, of L-selectin bearing microspheres (a—d) and neutrophils (e and f) were calculated from the tether rate data from Eq. (2), normalized by dividing by mrmlr, and plotted vs. wall shear rate (a and e), wall shear stress (b and f), product (c and e), and maximum tether force [Ft]max = 13.2r2 σ or where Ds = kBT/(6πμr) is the sphere diffusivity according to the Stokes—Einstein relationship (where kB is the Boltzmann constant and T is the absolute temperature) (d and f). Microspheres of three different radii and/or media of four different viscosities were used (indicated). The data were recorded at 250 frames per second using the method described in Fig. 1a legend. Reproduced from Yago et al.21
FIGURE 5.
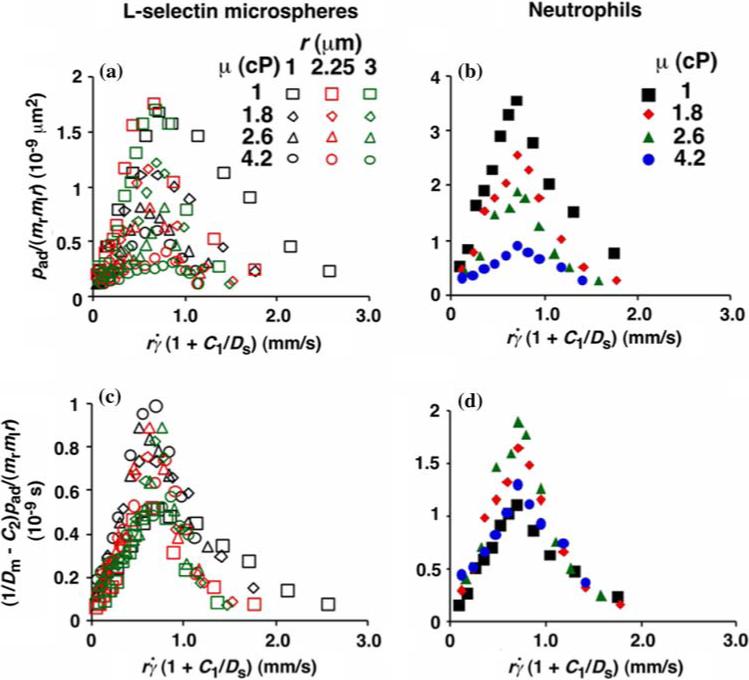
Collapse of multiple data curves by proper scaling of the contributions by three transport mechanisms. When the normalized adhesion probabilities per distance for microspheres (a) and neutrophils (b), pad/(mrmlr), were plotted vs. , a variable that combines sphere transport mechanisms for both relative sliding and Brownian motion, the ranges of all curves were aligned. When the pad/(mrmlr) values were further multiplied by (1/Dm - C2) to obtain a variable that combines molecular diffusion and molecular docking, all 12 microsphere curves collapsed into a single curve (c). Similarly, all four neutrophil curves collapsed into a single curve (d). Reproduced from Yago et al.21
Enhancing Tethering by Mean Sliding Velocity
To apply dimensional analysis to identify transport mechanisms of cell tethering, we independently varied parameters that affect these mechanisms. We perfused cells or microspheres of different radii in media of different viscosities through a flow chamber at different wall shear rates. According to Eq. (2), the probability adhesion per distance pad could be normalized by dividing by mrmlr to remove the mass action effect. pad/(mrmlr) was then plotted against different parameters to dissect which mechanism dominated which regime of the curve (Fig. 3). Alignment of the entire curves or portions thereof when plotted against a parameter suggests the dominance of the mechanism controlled by this parameter in the regime where curves align. Lack of alignment suggests the presence of competing mechanisms. Lack of sensitivity to the change of a parameter indicates its irrelevance.
As flow increased, the tether rates, measured by the normalized probability of adhesion per distance, pad/(mrmlr), of L-selectin-bearing microspheres (Figs. 3a—d) or neutrophils (Figs. 3e and 3f) to PSGL-1 increased initially, reached a maximum, and then decreased. When plotted against the wall shear rate , initial portions of the ascending phase of curves for different medium viscosities μ aligned for microspheres of the same radius r (but shifted with r)(Fig. 3a) and for neutrophils (Fig. 3e), suggesting two competing mechanisms respectively governed by and r. When the abscissa was rescaled by multiplying by r, the initial portions of the ascending phase of all microsphere curves collapsed (Fig. 3c), indicating that the product is the governing parameter in this regime. The sliding velocity of the sphere bottom relative to the chamber floor is proportional to . Therefore, these results demonstrate that convective transport of receptors to ligands by relative sliding between the sphere bottom (where the receptors reside) and the surface (where the ligands reside) provides a dominant transport mechanism to enhance tethering when is small.
Enhancing Tethering by Brownian Motion
Sliding could enhance tethering when bond formation was transport-limited. The pad/(mrmlr) vs. curves no longer aligned when pad/(mrmlr) reached a maximum, suggesting that another transport mechanism limited tethering here. The value where pad/(mrmlr) achieved maximum (referred to as optimal decreased with increasing sphere radius r and/or medium viscosity μ for both microspheres (Fig. 3c) and neutrophils (Fig. 3e). When plotted against Ds, the optimal aligned along two nearly straight lines, one for microspheres and the other for neutrophils, regardless of the r and/or μ values (Fig. 4a). Ds ≡ kBT/(6πμr) (where kB is the Boltzmann constant and T is absolute temperature) is the sphere diffusivity according to the Stokes—Einstein relationship, which can be used as a metric for the sphere Brownian motion. These results identify sphere Brownian motion as another transport mechanism that enhances tethering. This is intuitive as more vibrant Brownian motion should produce more frequent collisions with larger contact areas, expanding the capacity for sliding to further enhance tethering.
FIGURE 4.
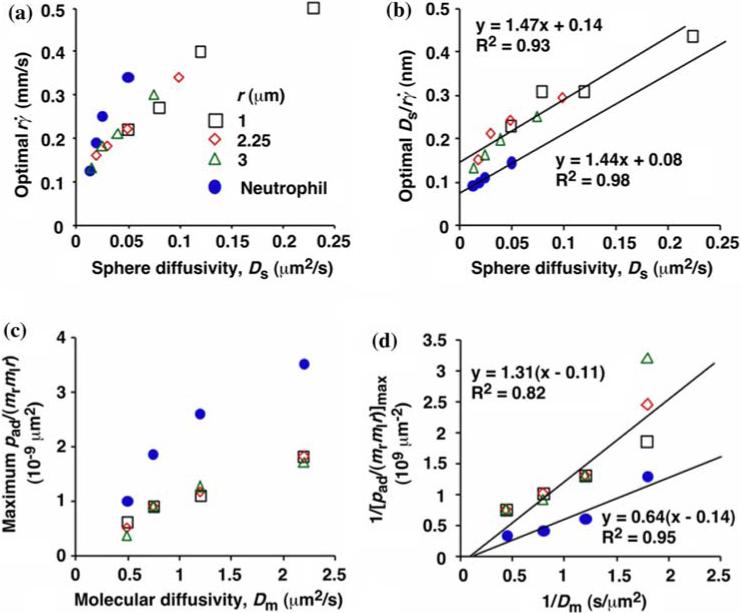
Analysis of optimal values of tether rate curves. (a) Peak locations of the pad/(mrmlr) vs. curves (optimal ) were plotted against the sphere diffusivity Ds. (b) Peak locations of the pad/(mrmlr) vs. curves (optimal ) where plotted against the sphere diffusivity Ds. (c) Maximum pad/(mrmlr) values were plotted against the molecular diffusivity Dm. (d) Reciprocal of maximum pad/(mrmlr) values were plotted against reciprocal of the molecular diffusivity. Positive correlations were evident in all plots for both microspheres (open symbols) and neutrophils (solid circles). A straight line was fit to each set of the data for microspheres or neutrophils in (b) and (d). The best-fit equations are indicated along with the R2 values. Reproduced from Yago et al.21
When pad/(mrmlr) was plotted against the wall shear stress σ, the final portions of the descending phase of different curves aligned for microspheres of the same radius r (but shifted with r) (Fig. 3b) and for neutrophils (Fig. 3f). When the abscissa was rescaled by multiplying σ by 13.2r2, the final portions of the descending phase of all microsphere curves aligned even for those of different radii (Fig. 3d). 13.2r2 σ equals the force [Ft]max that tethers the sphere.3 It also equals 13.2(kBT/6π) (). Since 13.2(kBT/6π) is a constant, this suggests that is the governing parameter in this regime. This is intuitive because the larger the Ds, the further can enhance tethering. Scaling by Ds normalizes the capacity for sliding to enhance tethering, thereby aligning the curves.
We have seen that plotting pad/(mrmlr) vs. (Figs. 3c and 3e) and vs. (Figs. 3d and 3f) respectively aligned the initial portions of the ascending phase and the final portions of the descending phase of different curves corresponding to different parameters. This observation suggests that combining and may provide an abscissa variable that aligns both phases provided that the ordinate is also rescaled. To construct such a combined variable, we note that, when plotted against Ds, the value where pad/(mrmlr) achieved maximum (referred to as optimal can be fitted with two lines, , one for microspheres (with C1 = 0.09 μm2/s) and the other for neutrophils (with C1 = 0.05 μm2/s), where A equals 1.45 μm/s for both data sets (Fig. 4b). Multiplying the fitting equation by resulted in . The right-hand side is a linear combination of and . On the left-hand side, is scaled by its optimal value, which should align the locations where pad/(mrmlr) peaks when plotted against the combined variable. This is indeed the case, as shown in Figs. 5a and 5b.
Enhancing Tethering by Molecular Diffusion
As the medium viscosity decreased, both the value where pad/(mrmlr) achieved maximum and the maximum pad/(mrmlr) value increased (Figs. 3c and 3e). However, the maximum pad/(mrmlr) value was insensitive to the sphere radius (Fig. 3b) and did not correlate with the sphere diffusivity. We suggested that the governing factor is molecular diffusivity, Dm ≡ kBT/(6πμl) calculated from the Stokes—Einstein relationship, where l is a characteristic length in the molecular scale, e.g., l = 100 nm for an order-of-magnitude estimate. We plotted the maximum pad/(mrmlr) value against Dm. These plots were nearly linear for both microspheres and neutrophils regardless of the sphere radius (Fig. 4c), suggesting that molecular diffusion is another limiting factor for tethering. Scaling pad/(mrmlr) by its maximum value determined by molecular diffusivity, as is done using Fig. 4d, should collapse the ordinate of tethering curves (Figs. 5c and 5d), just as scaling () by its optimal value collapses the abscissa range of these curves (Figs. 5a and 5b).
Thus, dimensional analysis identifies three distinct transport modes—sliding of the cell bottom on the vascular surface, cell Brownian motion, and molecular diffusion—that enhance cell tethering. When transport is sufficiently fast, bond formation becomes reaction-limited. Further increase in transport shortens the contact durations, which decreases cell tethering. Taken together, our analysis fully explains the biphasic tether rate vs. flow curve (Fig. 1a).
CATCH BONDS GOVERN FLOW-ENHANCED CELL ROLLING
Conceptual Scheme of Rolling Process
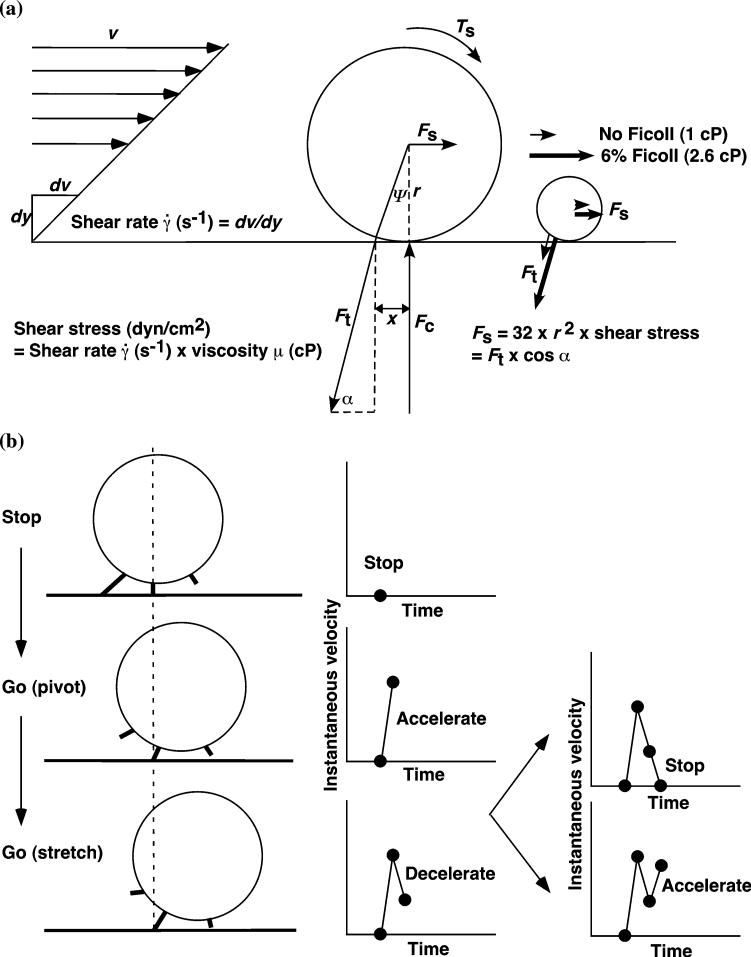
Let us now turn to another aspect of flow-enhanced adhesion: rolling velocity decreases with increasing flow until an optimal wall shear stress is reached, after which cells roll more rapidly as flow increases (Fig. 1c). In Ref. 20 we used Fig. 6 to illustrate the physical parameters of cell rolling under flow, which serves as a conceptual framework to design experiments that produced the data shown in Figs. 7-11. Shear stress σ, the product of shear rate and viscosity μ, applies a resultant force Fs and a torque Ts to the adherent sphere (or cell) (Fig. 6a), both of which increase when the rolling sphere slows and reach their maxima when the sphere stops. Fs and Ts are balanced by tensile forces Ft applied to the adhesive bonds at the trailing edge of a tethered sphere, and by compressive forces Fc at the sphere bottom. Shear stress-dependent Fc could enlarge the cell-surface contact area thus facilitating the binding for the deformable cell but not for the fixed cell or rigid microsphere. Ft reaches maximum when the sphere stops, [Ft]max = 13.2r2σ.3,20
FIGURE 6.
Parameters of cell rolling under flow. (a) Balance of forces acting on a rolling cell. Shear stress applies a resultant force Fs and a torque Ts to the cell, which are balanced by a tether force Ft on the receptor—ligand bonds at the trailing edge of a tethered cell and by a compressive force Fc at the sphere bottom. Elevating the viscosity by addition of 6% Ficoll increases shear stress by 2.6-fold and increase Ft on the sphere of the same size, as illustrated by the comparative lengths of the thin and thick vectors for Ft on the small sphere on the right. At the same shear stress, Ft is 9-fold greater for a sphere of 3-μm radius then for a sphere of 1-μm radius, as illustrated by the comparative lengths of the thin vectors for Ft on the large and small spheres. The conversion of wall shear stress into Ft is described in Yago et al.19 (b) Decomposition of a cyclic rolling step. See text for a detailed description. Reproduced from Yago et al.20
FIGURE 7.
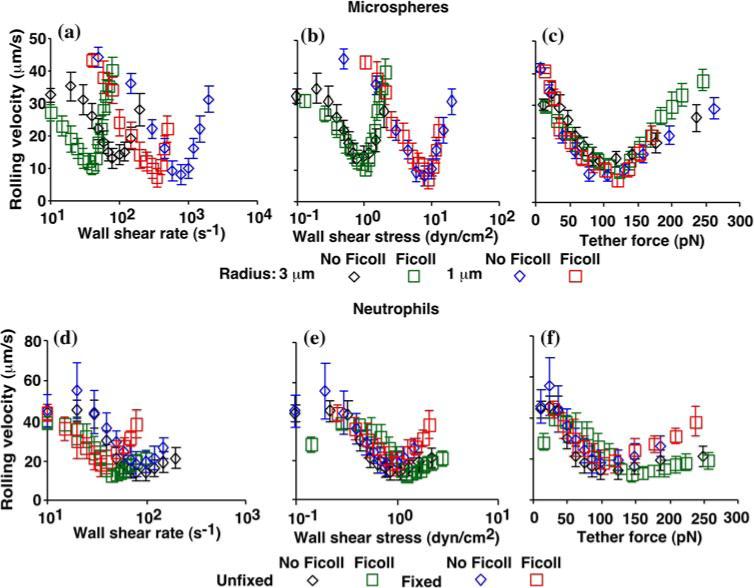
Mean velocities of L-selectin microspheres (a—c) or of unfixed or fixed neutrophils (d—f) rolling on PSGL-1 in the absence or presence of 6% Ficoll (which increased the viscosity by 2.6 fold) were measured as described in Fig. 1c legend and plotted against wall shear rate (a and d), wall shear stress (b and e), and tether force (c and f). Reproduced from Yago et al.20
FIGURE 11.
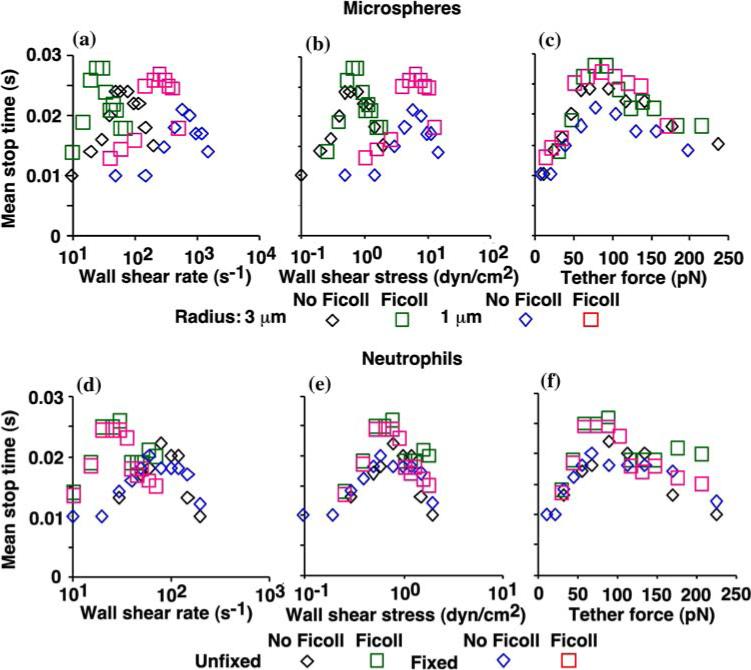
Tether force governs mean stop time below and above the flow optimum. The mean stop times (durations of stops in the time courses of instantaneous velocities like those shown in Fig. 9) of L-selectin-bearing microspheres of 3- or 1-μm radii (a—c) and fixed or unfixed neutrophils (d—f) rolling on sPSGL-1 in the absence or presence of 6% Ficoll (corresponding to viscosity of 1 or 2.6 cP) were plotted against wall shear rate (a and d), wall shear stress (b and e), and tether force (c and f). Reproduced from Yago et al.20
Cell rolling is characterized by formation of new bonds at the front edge and dissociation of preexisting bonds at the rear edge. Figure 6b illustrates a minimal model for a cyclic rolling step that alternates between one and two bonds. The cell stops when the force on the rear bond reaches [Ft]max, which allows formation of another bond a step distance ahead. Once the rear bond ruptures, the cell rolls forward with increasing velocity, i.e., acceleration. After pivoting over the front bond, which is being translated to the trailing edge, the cell decelerates by a tensile force that stretches the bond. If this bond is sufficiently strong to withstand the force [Ft]max, the cell stops again. If the bond ruptures prematurely, the cell accelerates again. This cycle repeats as the cell rolls continuously.
Rolling Velocity Scales with Tether Force
Again, we used dimensional analysis to identify the governing parameter that underlies the mechanism(s) for flow-enhanced cell rolling. Rolling velocities of fixed or unfixed cells or microspheres of different radii r in media of different viscosities μ were measured at different wall shear rates . When plotted against , the biphasic rolling velocity curves shifted horizontally with r and/or μ for both microspheres (Fig. 7a) and cells (Fig. 7d). When the abscissa was rescaled by multiplying by μ to plot the rolling velocity against the wall shear stress , curves for different μ aligned for microspheres of the same r (but shifted with r)(Fig. 7b) and for neutrophils prepared the same way (fixed or unfixed) (Fig. 7e). When the abscissa was rescaled again by multiplying σ by 13.2r2 to plot the rolling velocity against the maximum tether force [Ft]max = 13.2r2σ, all four microsphere curves collapsed (Fig. 7c), indicating that [Ft]max is the governing parameter.
The normal force Fc at the sphere bottom also increases with the tether force. The compression by this force may enlarge the contact area, which enables more bonds to form. In addition, force acting on adhesive bonds can extrude membrane tethers from live cells.13,16 Both mechanisms can slow rolling velocity and both scale with tether force. Note that the tether force was calculated from wall shear stress using analysis of force balance, which was based on the lever arm lengths directly measured from flow reversal experiments, which are different for cells and for microspheres. We tested these hypothetical mechanisms by altering the cell deformability using fixation and using rigid microspheres. When plotted against wall shear stress or tether force, the curves of unfixed and fixed neutrophils showed only moderate differences beyond the optimal shear level; both sets of curves were comparable to the microsphere curves, especially in the regime below the optimal tether force (Figs. 7c and 7f). These results suggest that enlargement of contact area and/or extrusion of membrane tethers, although detectable, played only a minor role in the flow regime tested.
Off-Rate Curves and Rolling Velocity Curves Correlate and Scale Similarly
Discussion on the rolling step model (Fig. 6b) suggests the importance of off-rate for dissociation of receptor—ligand bonds in controlling the rolling velocity. Only after the rearmost bond dissociates will the cell roll a step forward. Thus, the slower the off-rate is, the slower the rolling velocity is. We previously demonstrated that selectin-ligand interactions exhibit catch-slip transitional bonds where increasing force initially decreases off-rate and then increases off-rate, which may explain the biphasic rolling velocity vs. force curves.10,14 To obtain further support for this hypothesis, in Ref. 20 we used dimensional analysis again.
We first confirmed that tether force, not wall shear rate or wall shear stress, is the governing parameter for receptor—ligand dissociation. To do that we measured transient tether lifetimes of fixed and unfixed neutrophils and microspheres of different radii in media of different viscosities flowing in different wall shear rates. The off-rates of single L-selectin-PSGL-1 bonds were determined from lifetime measurements and plotted against wall shear rate (Figs. 8a and 8d), wall shear stress (Figs. 8b and 8e) and tether force (Figs. 8cand 8f). As expected, off-rate curves displayed catch-slip transitional bonds and aligned only when plotted against the tether force. The similar shape and common scaling law of both the rolling velocity and the off-rate curves thus support a causal relationship between catch bonds and flow-enhanced rolling. Note that the experimental conditions were chosen to favor single bonds and the tether lifetimes measured behaved as single-bond lifetimes. However, these are necessary but not sufficient conditions for single bonds and thus cannot guarantee that only single bonds were measured.
FIGURE 8.
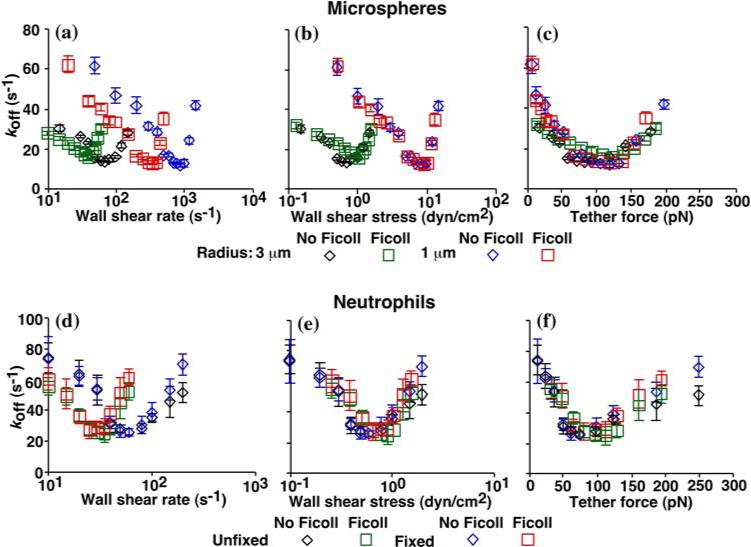
Off-rates (koff) derived from lifetimes of transient tethers of L-selectin-bearing microspheres of 3- and 1-μm radii (a—c) or of unfixed or fixed neutrophils (d—f) to low-density sPSGL-1 (<10 sites/μm2) in the absence or presence of 6% Ficoll (which increased the medium viscosity by 2.6 fold) were plotted against wall shear rate (a and d), wall shear stress (b and e), and tether force (c and f). Low ligand density favors (but does not guarantee) single bonds. Tether lifetimes (∼100 measured at 4-ms temporal resolution under any given condition) are distributed as single exponential decays, consistent with first-order dissociation of single bonds. Plotting the data in semi-log scale linearizes the distribution. koff can be evaluated from the negative slope of the linear fit to the data or from the average lifetime. Reproduced from Yago et al.20
Off-Rate Curves and Curves of Multiple Rolling Regularity Metrics Correlate and Scale Similarly
Further support for the proposed causal relationship between catch bonds and flow-enhanced rolling was obtained from detailed analysis of the stop-and-go rolling step cycles illustrated schematically in Fig. 6b. Figure 9 shows the time courses of instantaneous velocities of representative microspheres of 3-μm radius bearing L-selectin freely flowing over a surface coated with a nonadhesive protein human serum albumin (HSA) (first panel) or continuously rolling on a surface coated with the adhesive ligand PSGL-1 (other panels) in media of 1-cP viscosity in a range of wall shear rates measured with 4-ms temporal resolution. The instantaneous velocities of microspheres rolling on PSGL-1 alternated between zero and nonzero values, whereas the velocities of microspheres freely flowing over HSA fluctuated much less and never dropped to zero. The mean of the free-flowing velocities increased with increasing wall shear rate, whereas their fluctuations remained at similarly small levels, which could be attributed to Brownian motion. By contrast, the mean of the rolling velocities initially decreased and then increased with increasing shear because motions were interrupted by stops whose frequency and duration initially increased and then decreased. As the shear rate increased toward the optimal value, the rolling velocity fluctuations intensified, the acceleration—deceleration cycles became more regular, and more decelerations converted into full stops with zero velocity, which became longer, indicating stronger/longer-lived L-selectin-PSGL-1 bonds. As flow increased above the optimal value, these trends were reversed. The rolling velocity fluctuations became less intensive and less regular, and fewer decelerations converted into full stops, which became shorter, indicating weaker/shorter-lived L-selectin-PSGL-1 bonds.
FIGURE 9.
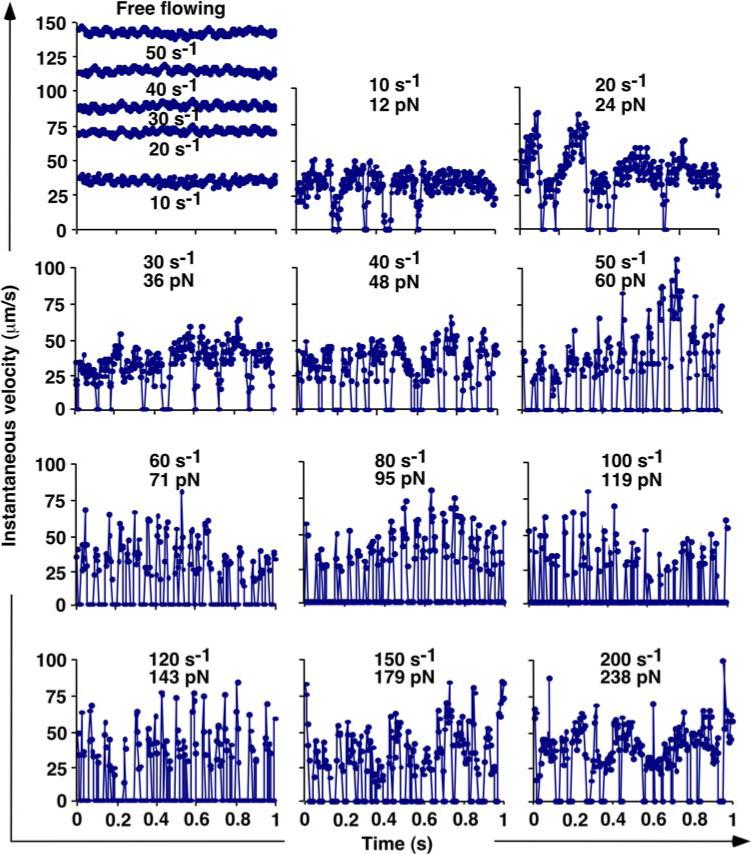
Changing features of instantaneous velocities of L-selectin-bearing mocrospheres freely flowing over HSA (1st panel) or continuously rolling on PSGL-1 (other panels) at indicated wall shear rates (s−1) and corresponding tether forces (pN). The microsphere radius was 3 μm and the media did not contain Ficoll. Data were derived using particle tracking software from images recorded at 4-ms temporal resolution. Reproduced from Yago et al.20
The above qualitative observations were quantified using an acceleration threshold to segregate the velocity curves into periods of stops and go's, thereby allowing statistical analysis of a variety of metrics for rolling regularity and stability.20 These include mean stop and go times, stop and go frequencies, fractional times spent in the stop or go phases, fraction of steps with stops, and mean go distance. To perform dimensional analysis, nearly a thousand stop and go events were collected for each condition from 10−15 microspheres of 1-μm or 3-μm radii or fixed or unfixed neutrophils that rolled continuously for 1 s in media of 1- or 2.6-cP viscosity in a range of shear rates. As exemplified by stop frequency (Fig. 10) and mean stop time (Fig. 11), plotting these rolling parameters vs. wall shear rate, wall shear stress and tether force revealed that all of the curves aligned with the tether force but not with wall shear rate or wall shear stress. In addition, all curves were biphasic, showing increased rolling regularity and stability as force increased toward the optimal level and then reversal of the trends beyond the optimal force.
FIGURE 10.
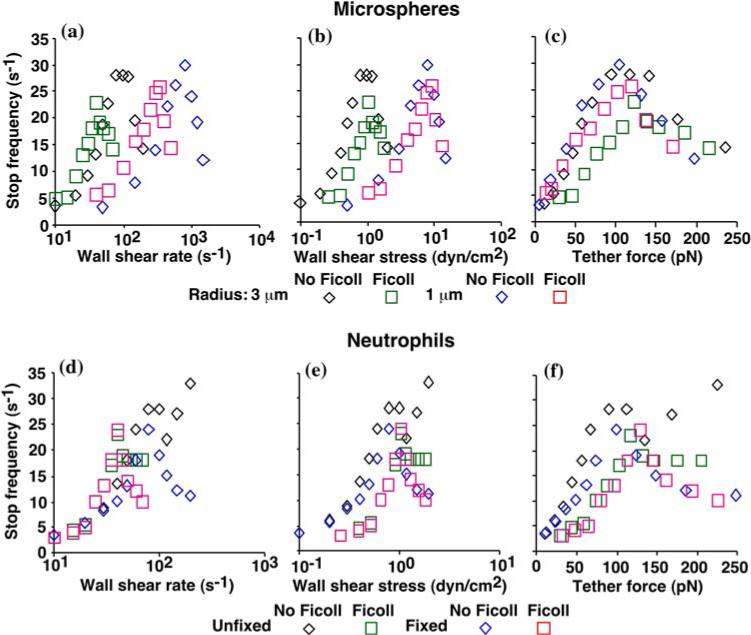
Tether force governs stop frequency below and above the flow optimum. The stop frequency (number of stops in a 1-s time course of instantaneous velocities like those shown in Fig. 9) of L-selectin-bearing microspheres of 3- or 1-μm radii (a—c) and fixed or unfixed neutrophils (d—f) rolling on sPSGL-1 in the absence or presence of 6% Ficoll (corresponding to viscosity of 1 or 2.6 cP) were plotted against wall shear rate (a and d), wall shear stress (b and e), and tether force (c and f). Reproduced from Yago et al.20
Thus, in all areas examined, strong correlations were observed between off-rate of L-selectin-PSGL-1 dissociation and multiple metrics of rolling regularity and rolling stability. These include the optimal tether force level where parameters achieved extreme values (maximum or minimum), the trends of changes below and above the optimal tether force, and even the shapes of the curves. Equally importantly, the changes in the rolling regularity and stability can be understood intuitively and explained easily by the changes in the off-rate. These observations and analyses unambiguously demonstrated catch bonds as the mechanism for flow-enhanced rolling. It is this unusual property of selectin—ligand interaction that converts the weak and short-lived bonds into strong and longer-lived bonds, which causes the counterintuitive decrease in the rolling velocity and increase in the rolling regularity and stability as shear rises from the threshold to an optimal value.
Note that the above conclusions do not require that the data in Fig. 8 represent single bond off-rates. Nor do they require that cell rolling is mediated by alternations between one and two single bonds. The basic idea is that the formation-and-dissociation cycle of discrete molecular interaction underlies the stop-and-go pattern of cell rolling. Our arguments remain valid as long as the number of bonds does not change with increasing tether force in a biphasic pattern exactly reciprocal to the rolling velocity curves, which is extremely unlikely.
MUTATIONAL ANALYSIS CONFIRMS REGULATORY MECHANISMS FOR FLOW-ENHANCED ADHESION
Predicted Impact of Increasing Lectin-EGF Interdomain Hinge Flexibility
We have used dimensional analysis to demonstrate that flow-enhanced cell adhesion is caused by mechanical regulation of on-rate21 and off-rate20 of the molecular interactions that mediate adhesion. Any specific mechanically regulated kinetic rates should be rooted in the structures of the interacting molecules. Therefore, we should be able to alter these kinetic rates and their mechanical regulation by mutations in the molecular structures.
All three selectins contain a C-type lectin domain at the N-terminus, followed by an epidermal growth factor (EGF)-like domain, varying numbers of short consensus repeat domains, a transmembrane segment, and a cytoplasmic tail. The ligand binding site is located on the lectin domain.17 The EGF domain has also been shown to play an important role in ligand binding.6,8,12 The structures of the lectin and EGF domains of P- and E-selectin without bound ligand and bound to sialyl Lewis x (sLex) and/or a short N-terminal segment of PSGL-1 have been published4,17 and that of L-selectin without bound ligand has also been solved (P. Mehta, V. Oganesyan, S. Terzyan, T. Mather, and R. P. McEver, unpublished data). The structure of P-selectin bound to PSGL-1 displays an extended conformation with a more open angle between the lectin and EGF domains compared to all other structures, including all three standalone selectins as well as P- and E-selectin bound to sLex, which have a bent conformation with a more closed lectin-EGF interdomain angle.17 There are only a few noncovalent interactions between the lectin and EGF domains, most of which are conserved among the three selectins. Since the angle conformation must be stabilized by these noncovalent interactions, their small number predicts that the interdomain hinge may be flexible. Indeed, free dynamics simulations reveal spontaneous transitions between the closed-angle and open-angle conformations of the L-selectin hinge.8 Furthermore, steered molecular dynamics (SMD) simulations of forced dissociation of the P-selectin:PSGL-1 complex reveal multiple interdomain angle conformations in addition to the two observed in the crystal structures.9 Structural comparisons reveal a hydrogen bond between Asn138 of the EGF domain and Tyr37 of the lectin domain of L-selectin and E-selectin, which is not observed in P-selectin where residue 138 is a glycine. Replacing L-selectin Asn138 with glycine is predicted to eliminate this hydrogen bond because the much shorter side chain of Gly138 should prevent it from interacting with Tyr37. This point mutation, termed L-selectinN138G, is predicted to increase flexibility of the lectin-EGF interdomain hinge.
How might the hinge flexibility of a selectin affect its interactions with ligand at an interface several nanometers from the hinge? A flexible hinge will increase the frequency of transitions between the closed-angle and open-angle conformations. Such transitions produce relative rotational motions of the ligand-binding site on the lectin domain about the interdomain hinge, which represents molecular diffusion. It is this kind of rotational diffusion, not lateral diffusion along the surface of the cell or microsphere, that was shown to augment the on-rate for ligand binding in the previous section. This reasoning predicts a higher tether rate for L-selectinN138G than for L-selectin.
A flexible hinge might also affect force-dependent dissociation of L-selectin from its ligands, in particular, catch bonds. This is predicted from the “sliding-rebinding model” that we developed from SMD simulations published in Ref. 9, which generated the structures shown in Fig. 12 to explain the structural basis of catch bonds. In the model, the various multi-stable conformations of the lectin-EGF interdomain angle are in dynamic equilibrium with or without ligand binding. The fraction of time for the structure to stay in any conformation and the frequency of transition from one state to another are both regulated by externally applied force, such that it is mostly in the closed conformation in the absence of force but more likely to transition to and to stay in more open conformations when a force is applied to unbind the selectin:ligand complex. At low forces, noncovalent interactions with the ligand may dissociate as it detaches from the lectin domain at the interface that is perpendicular to the direction of force along a pathway indicated by the purple horizontal arrow pointing rightward from panel a to panel e in Fig. 12, which is a fast dissociation pathway with short lifetimes. When a higher force is applied, the dynamic equilibrium between the two interdomain angles would shift toward having a higher fraction of time in the open conformation observed in the liganded P-selectin crystal structure4,17 and in the MD-simulated L-selectin structure8 or an even larger opening angle as that observed in SMD simulations.9 The rotation of the lectin domain resulting from the interdomain angle opening would tilt the binding interface to better align with the direction of force, thereby promoting sliding of the ligand across the lectin domain as pre-existing interactions dissociate. This would provide an opportunity for new interactions to form, which would replace those that are disrupted, or for the original interactions to reform, which would return the system back to its previously bound state, before the ligand fully dissociates, thereby slowing dissociation and prolonging lifetime. This would represent a switch to a slow dissociation pathway, as shown by the purple vertical arrow pointing downward from panel a to panel b and by other purple arrows indicating possible subsequent events from panel b to panels c, d, f, and/or back to panel b in Fig. 12. Such a force-induced deceleration of dissociation is a hallmark of catch bonds.4,17 Thus, the model assumes that force applies a moment to the multi-stable interdomain hinge between the lectin and EGF domains to allosterically elicit catch bonds with ligand by sliding and rebinding. Once the interdomain angle is fully opened, the probability for new bond formation and rebinding reaches maximum, so further increases in force cannot prolong bond lifetimes any further. Instead, force would accelerate dissociation of each individual atomic-level interactions, resulting in transition from catch bonds to slip bonds. The sliding-rebinding model might explain, at least partly, why P-selectin, whose interdomain hinge is predicted to be more flexible than that of L-selectin, forms augmented catch bonds with longer lifetimes that convert to slip bonds at lower force than L-selectin.4,17 It also predicts a phenotype for mutant L-selectinN138G that will reduce the force required to elicit catch bonds, prolong their lifetimes, and lower the force where catch bonds convert to slip bonds even with molecularly distinct ligands.
FIGURE 12.
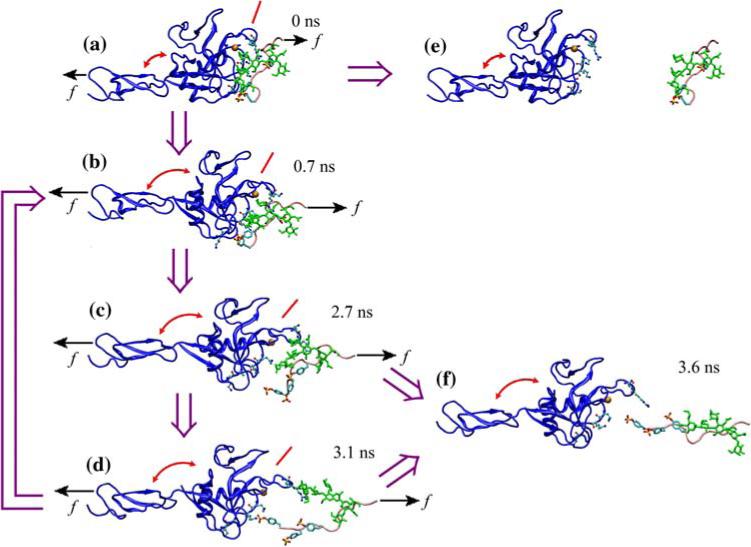
Pathways of sliding-rebinding mechanism. (a—d and f) Sequential SMD-simulated structures of the N-terminal region of PSGL-1 (pink for the peptide and green for the glycan) dissociating from P-selectin lectin-EGF domains (blue) at indicated times. (e) Separate structures of P-selectin lectin-EGF domains and the N-terminal region of PSGL-1 indicating complete dissociation. The thick purple arrows indicate the hypothetical sequence of events along dissociation pathways. The interdomain angles are marked by arched double-sided red arrows. The inclinations of the binding interface are marked by inclined red lines. (a) The initial bound state. (b) Force-induced opening of the hinge angle. (c) Rupture of pre-existing interactions. (d) Sliding and formation of new interactions. (e) Dissociation from fast pathway 1. (f) Dissociation from slow pathway 2. When a small force f (short black arrows) is applied, the complex may detach by dissociation of all noncovalent interactions that pre-existed in the bound state. An intermediate force (long black arrows) may open the hinge angle, tilt the binding interface, and promote sliding of PSGL-1 over the lectin-domain binding interface after pre-existing atomic-level interactions dissociate. This provides an opportunity for new interactions to form, which would replace those that are disrupted, or for the original interactions to reform, which would return the system back to its previously bound state, before the ligand fully dissociates. Reproduced from Lou and Zhu.9
Since the hypothetical mechanisms for L-selectin N138G to affect mechanical regulation of on-rate21 and off-rate20 of its interaction with ligand are not ligand specific, we tested these hypotheses using two physiologically important but structurally distinct ligands: PSGL-1 or 6-sulfo-sLex. The latter is a model of peripheral node addresins (PNAd), a group of L-selectin ligand expressed on high endothelial venules (HEV). It includes sLex, the prototype of glycan structure of all selectin ligands, and a single sulfate on the C-6 position of GlcNAc. By comparison, PSGL-1 also includes a peptide and three sulfates on three tyrosines. The above analysis, presented in Refs. 8 and 9, provided the idea for the mutagenesis studies that generated the data in Figs. 13 and 14.
FIGURE 13.
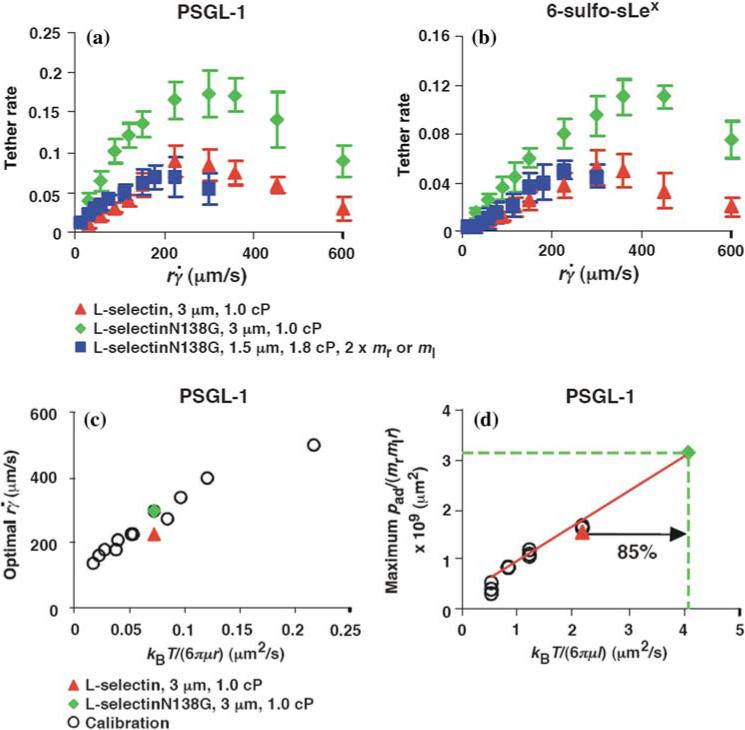
Greater flexibility of the L-selectinN138G hinge increases tethering by enhanced rotational diffusion. (a, b) The tether-rate dependence for L-selectin or L-selectinN138G on the product of the microsphere radius r and the wall shear rate . The data were measured by the same method as described in Fig. 1a legend and represent the mean ± the SD from three experiments. The microspheres were coated with 750 molecules μm−2 of either L-selectin or L-selectinN138G, except in one case in (b), where they were coated with 1500 molecules μm−2 of L-selectinN138G (blue squares). The flow chamber floor in (a) was coated with PSGL-1 at either 120 (red triangles and green diamonds) or 240 (blue squares) molecules μm−2. The flow chamber floor in (b) was coated with a constant density of 6-sulfo-sLex. (c) Optimal (peak locations of the pad/(mrmlr) vs. curves) vs. microsphere diffusivity kBT/(6πμr)of 3-μm radius microspheres bearing L-selectin (red triangle) or L-selectinN138G (green diamond) tethering to PSGL-1 were plotted for comparison. The open circles are microsphere data from Fig. 4a for calibration. (d) Maximum pad/(mrmlr) vs. molecular diffusivity kBT/(6πμl) data for L-selectin bearing microspheres tethering to PSGL-1 from Fig. 4c were replotted to provide calibration (open circles), which assumed the characteristic length for molecular diffusion as l = 100 nm. The same l value was used for the L-selectin datum (red triangle), which matched the calibration curve well. The molecular diffusivity for L-selectinN138G is predicted to be larger. Using the measured maximum pad/(mrmlr) value, the L-selectinN138G datum point (green diamond) was located at the intercept of y = [pad/(mrmlr)]max (green dashed horizontal line) and the extrapolation of the calibration curve (red line). The increased molecular diffusivity for L-selectinN138G could be calculated from the x-axis value of this datum point (green dashed vertical line), which is 85% over the value for L-selectin. Reproduced from Lou et al.8
FIGURE 14.
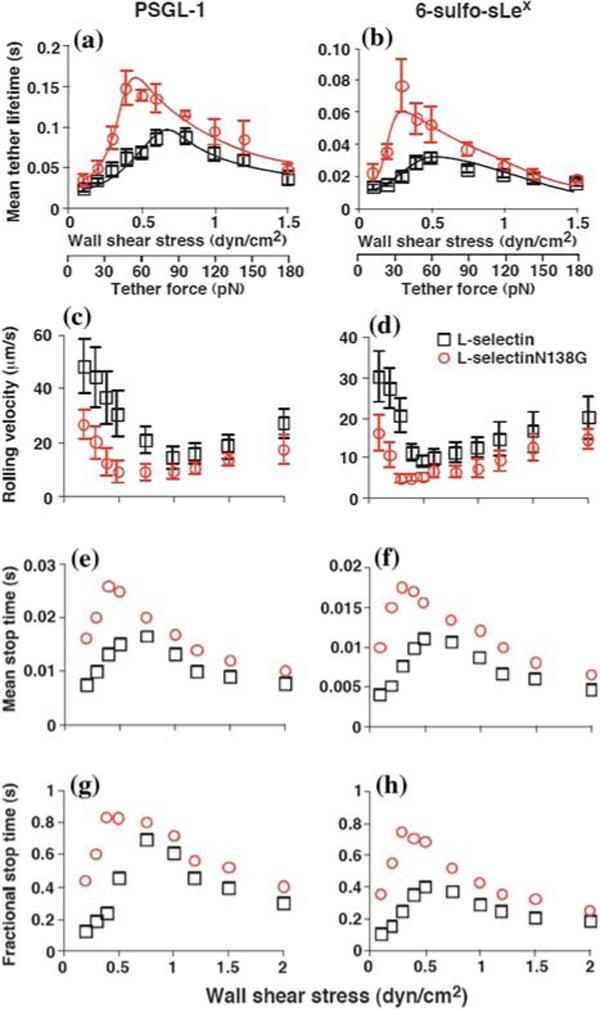
Greater flexibility of the L-selectinN138G hinge augments catch bonds and flow-enhanced rolling. Micro-spheres coated with matched densities of L-selectin or L-selectinN138G were perfused through a flow chamber containing immobilized PSGL-1 (a, c, e, and g) or 6-sulfo-sLex (b, d, f, and h). The force dependence of the tether lifetime is shown in (a and b); the solid lines indicated the pseudoatom model fits of the sliding-rebinding mechanism.8,9 The mean rolling velocities shown in (c and d) represent the mean ± SD from five experiments. The mean stop time (e and f) or fractional stop time (g and h) represent analyses of thousands of rolling steps collected from 10−15 microspheres rolling for 1 s at each wall shear stress for each pair of selectin—ligand interactions. Reproduced from Lou et al.8
Greater Hinge Flexibility of L-SelectinN138G Increases Tethering by Enhanced Molecular Diffusion
The rates of microspheres bearing recombinant L-selectin or L-selectinN138G tethering to immobilized PSGL-1 or 6-sulfo-sLex in a range of were compared in Figs. 13a and 13b. The tether rate vs. curves show a biphasic shape characteristic of flow-enhanced tethering for both L-selectin and L-selectinN138G on each ligand. The tether rates were higher for L-selectinN138G than for L-selectin, whereas the values where tether rates reached maximum (optimal ) were not significantly different. This phenotype is predicted by the previous dimensional analysis if L-selectinN138G has a higher molecular diffusion coefficient than L-selectin (cf. Figs. 5a and 5b).
To estimate the increase in molecular diffusivity of L-selectinN138G over L-selectin, we used the micro-sphere data in Fig. 4a and 4c, as calibration curves, which were replotted in Figs. 13c and 13d, along with the corresponding optimal and maximum pad/(mrmlr) values determined from the data in Fig. 13a. As expected, microspheres bearing L-selectin or L-selectinN138G had comparable optimal values that were similar to the data in the calibration curve because they had the same microsphere diffusivities calculated from the same radius (3 μm) and media viscosity (1 cP) (Fig. 13c). The maximum pad/(mrmlr) value for L-selectin measured from Fig. 13a also agrees with the calibration data (Fig. 13d). By comparison, the maximum pad/(mrmlr) for L-selectinN138G was much higher. Using this value, a higher molecular diffusivity was extrapolated from the calibration curve, which was increased by 85% over that of L-selectin (Fig. 13d).
To further confirm our conclusion, we designed a set of conditions to counter the predicted increase in the L-selectinN138G diffusivity. The medium viscosity was increased from 1 to 1.8 cP to reduce the diffusivity of L-selectinN138G by 80%. The radius of the micro-spheres was decreased from 3 to 1.5 μm to keep the product μr (and hence the microsphere diffusivity) approximately constant. The PSGL-1 site density was increased from 120 to 240 μm−2 to keep the normalizing factor mrmlr constant. Since the microsphere diffusivities, molecular diffusivities, and normalizing factors were matched, we predicted that the tether rate vs. curve for L-selectinN138G measured under the designed conditions would match the tether rate vs. curve for L-selectin measured in 1-cP viscosity media with 3-μm radius microspheres. This was indeed the case (Fig. 13a).
The tether rate curves for 6-sulfo-sLex (Fig. 13b) were qualitatively similar to those for PSGL-1 (Fig. 13a), but the former curves had larger maximum tether rates that occurred at lower . Such quantitative differences reveal the impact of molecular docking rates specific to the ligands. These differences also place the optimal value measured from the L-selectin tether rate curve in Fig. 13b significantly above the calibration curve in Fig. 13c and the maximum pad/(mrmlr) value significantly below the calibration curve in Fig. 13d, because the calibration curves were based on interactions of L-selectin with PSGL-1 rather than 6-sulfo-sLex. This prevented estimating a relative change in the L-selectinN138G rotational diffusivity by comparing the measured maximum pad/(mrmlr) to the calibration curve. Nevertheless, increasing rotational diffusivity of L-selectin N138G should augment tethering to molecularly distinct ligands because this mechanism does not require alterations of the ligand-binding surface. In the preceding paragraph, we estimated an 85% increase in diffusivity of L-selectinN138G over that of L-selectin by comparing the tether rate curves for interactions with PSGL-1 (Fig. 13d). If this value represents the true difference in rotational diffusivities between the two selectins instead of a fortuitous value that enabled curve fitting, it should account for the higher tether rate curve of L-selectinN138G than of L-selectin for 6-sulfo-sLex (Fig. 13b) as well as for PSGL-1 (Fig. 13a). This hypothesis predicts that designing conditions to counter the increase in L-selectinN138G diffusivity would also align the designed L-selectinN 138G curve with the original L-selectin curve for 6-sulfo-sLex. To test this prediction, we increased the medium viscosity from 1.0 to 1.8 cP, reduced the radius of the microspheres from 3.0 to 1.5 μm and increased the L-selectinN138G density from 750 to 1500 μm−2. As predicted, the tether rate curve for these designed conditions aligned with the tether rate vs. curve for L-selectin measured in 1-cP viscosity media with 3-μm radius microspheres (Fig. 13b). Taken together, these data quantitatively demonstrate that cell tethering to different ligands was enhanced by substituting Gly for Asn138 to increase the rotational diffusion of L-selectin.
Greater Hinge Flexibility of L-selectinN138G Augments Catch Bonds by Prolonging Lifetimes with Smaller Forces
The sliding-rebinding mechanism for catch bonds was conceived based on structural analysis and MD simulations of atomic-level noncovalent interactions that hold the selectin:ligand complex together.8,9 To explore its properties and predictions, the sliding-rebinding mechanism was modeled using a pseudoatom representation and Monte Carlo simulations.8,9 Some of the predictions are that increasing flexibility of the lectin-EGF interdomain hinge would reduce the force required to elicit catch bonds, prolong their lifetimes, and lower the force where catch bonds convert to slip bonds. To test these predictions, we measured the force dependence of lifetimes of interactions of L-selectin and L-selectinN138G with PSGL-1 and 6-sulfo-sLex using both biomembrane force probe and flow chamber experiments, which obtained similar results. As shown in Figs. 14a and 14b, L-selectinN138G interactions with both ligands exhibited transitions between catch and slip bonds, which were similar to L-selectin. However, the lifetimes in the catch bond regime were significantly longer and the transitions to slip bonds occurred at lower forces for L-selectinN138G than for L-selectin. In contrast, there was little difference in the lifetimes of L-selectin and L-selectinN138G interactions in the slip bond regime. For both ligands, these quantitative differences were well described by the sliding-rebinding model, which could fit data of both L-selectin and L-selectinN138G with the same parameters except one that allows the interdomain hinge to be more flexible and another that allows the new interaction formation to be more likely for L-selectin N138G than for L-selectin. Thus, both experimental data and their theoretical fits strongly support the model for transitions from catch to slip bonds through force-dependent sliding of ligand over a pivoting lectin domain that promotes rebinding.
Greater Hinge Flexibility of L-selectinN138G Lowers the Shear Threshold for Rolling
To determine whether the altered catch bonds resulted in altered flow-enhanced L-selectin-dependent rolling, we perfused microspheres bearing L-selectin and L-selectinN138G over higher densities of PSGL-1 or 6-sulfo-sLex. As predicted, the descending phases of the rolling velocity curves for L-selectinN138G shifted downward and to the left, with significantly slower mean velocities and with minimal velocities at much lower shear stresses than for L-selectin (Figs. 14cand 14d). Rolling motions at these suboptimal flow rates were more regular for L-selectinN138G than for L-selectin, with longer mean stop times (Figs. 14e and 14f) and higher fractions of time in the stop phase (Figs. 14g and 14h). By contrast, the ascending phases of the rolling velocity curves were similar for both selectins. These data confirm that substituting Gly for Asn138 augments flow-enhanced L-selectin-dependent rolling. The concurrent left-shifts of the curves for catch bonds and for flow-enhanced rolling by point mutation provide further support for the causal relationship between the two phenomena.
DISCUSSION AND CONCLUSION
Since its discovery, flow-enhanced cell adhesion has long intrigued researchers because it appears paradoxical. Using dimensional analysis and mutational analysis, we have identified two mechanisms of flow-enhanced leukocyte adhesion mediated by selectin—ligand interactions: transport-dependent acceleration of bond formation and force-dependent deceleration of bond dissociation. Dimensional analysis is usually used in mechanics for reduction of simpler relationships among smaller number of (dimensionless) variables than those in the (dimensional) governing equations. Here, we used it for induction of relevant parameters underlying the dominant mechanisms. This was done in a manner resembling hypothesis testing based on experimental data rather than derivation based on first principles. Mutational analysis is usually used in biology to identify the structural basis of a specific function. Here, we used it to demonstrate casual relationships between properties and functions. This was done in a manner resembling quantitative derivation. With combined dimensional and mutational analyses, we obtained an extremely high degree of confidence in the mechanisms so identified. Each mechanism was independently demonstrated using multiple ways to alter the controlled variable of that mechanism: The sliding velocity was altered by changing the shear rate and the sphere radius, the sphere diffusivity was altered by changing the medium viscosity and sphere radius, the molecular diffusivity was altered by changing the medium viscosity and interdomain hinge flexibility, the tether force was altered by changing the shear rate, medium viscosity and sphere radius, and the kinetic rates were altered by changing the molecular structures and mechanical regulations. These experimental strategies and analysis methods may be applicable to other biological systems that exhibit flow-enhanced adhesion, for instance, GPIb-dependent platelet adhesion to VWF and FimH receptor-dependent bacterium adhesion to mannosylated ligands, which may be governed by mechanisms similar to those identified here. Future studies are under way to test these predictions.
ACKNOWLEDGMENTS
We gratefully acknowledge the contributions of our co-workers who produced the original data8,20,21 which are summarized here. This work was supported by National Institutes of Health grants AI44902 (CZ) and HL65631 (RPM).
REFERENCES
- 1.Doggett TA, Girdhar G, Lawshe A, Miller JL, Laurenzi IJ, Diamond SL, Diacovo TG. Alterations in the intrinsic properties of the GPIbalpha-VWF tether bond define the kinetics of the platelet-type von Willebrand disease mutation, Gly233Val. Blood. 2003;102:152–160. doi: 10.1182/blood-2003-01-0072. [DOI] [PubMed] [Google Scholar]
- 2.Finger EB, Puri KD, Alon R, Lawrence MB, von Andrian UH, Springer TA. Adhesion through L-selectin requires a threshold hydrodynamic shear. Nature. 1996;379:266–269. doi: 10.1038/379266a0. [DOI] [PubMed] [Google Scholar]
- 3.Goldman AJ, Cox RG, Brenner H. Slow viscous motion of a sphere parallel to a plane wall. II. Couette flow. Chem. Eng. Sci. 1967;22:653–660. [Google Scholar]
- 4.Graves BJ, Crowther RL, Chandran C, Rumberger JM, Li S, Huang KS, Presky DH, Familletti PC, Wolitzky BA, Burns DK. Insight into E-selectin/ligand interaction from the crystal structure and mutagenesis of the lec/EGF domains. Nature. 1994;367:532–538. doi: 10.1038/367532a0. [DOI] [PubMed] [Google Scholar]
- 5.Happel J, Brenner H. Low Reynolds Number Hydrodynamics. Kluwer Academic Publishers; Dordrecht, The Netherlands: 1991. [Google Scholar]
- 6.Kansas GS, Saunders KB, Ley K, Zakrzewicz A, Gibson RM, Furie BC, Furie B, Tedder TF. A role for the epidermal growth factor-like domain of P-selectin in ligand recognition and cell adhesion. J. Cell Biol. 1994;124:609–618. doi: 10.1083/jcb.124.4.609. [DOI] [PMC free article] [PubMed] [Google Scholar]
- 7.Lawrence MB, Kansas GS, Kunkel EJ, Ley K. Threshold levels of fluid shear promote leukocyte adhesion through selectins (CD62L,P,E). J. Cell Biol. 1997;136:717–727. doi: 10.1083/jcb.136.3.717. [DOI] [PMC free article] [PubMed] [Google Scholar]
- 8.Lou J, Yago T, Klopocki AG, Mehta P, Chen W, Zarnitsyna VI, Bovin NV, Zhu C, McEver RP. Flow-enhanced adhesion regulated by a selectin interdomain hinge. J. Cell Biol. 2006;174:1107–1117. doi: 10.1083/jcb.200606056. [DOI] [PMC free article] [PubMed] [Google Scholar]
- 9.Lou J, Zhu C. A structure-based sliding-rebinding mechanism for catch bonds. Biophys. J. 2007;92:1471–1485. doi: 10.1529/biophysj.106.097048. [DOI] [PMC free article] [PubMed] [Google Scholar]
- 10.Marshall BT, Long M, Piper JW, Yago T, McEver RP, Zhu C. Direct observation of catch bonds involving cell-adhesion molecules. Nature. 2003;423:190–193. doi: 10.1038/nature01605. [DOI] [PubMed] [Google Scholar]
- 11.Mege JL, Capo C, Benoliel AM, Bongrand P. Determination of binding strength and kinetics of binding initiation. A model study made on the adhesive properties of P388D1 macrophage-like cells. Cell Biophys. 1986;8:141–160. doi: 10.1007/BF02788478. [DOI] [PubMed] [Google Scholar]
- 12.Phan UT, Waldron TT, Springer TA. Remodeling of the lectin-EGF-like domain interface in P- and L-selectin increases adhesiveness and shear resistance under hydrodynamic force. Nat. Immunol. 2006;7:883–889. doi: 10.1038/ni1366. [DOI] [PMC free article] [PubMed] [Google Scholar]
- 13.Ramachandran V, Williams M, Yago T, Schmidtke DW, McEver RP. Dynamic alterations of membrane tethers stabilize leukocyte rolling on P-selectin. Proc. Natl. Acad. Sci. USA. 2004;101:13519–13524. doi: 10.1073/pnas.0403608101. [DOI] [PMC free article] [PubMed] [Google Scholar]
- 14.Sarangapani KK, Yago T, Klopocki AG, Lawrence MB, Fieger CB, Rosen SD, McEver RP, Zhu C. Low force decelerates L-selectin dissociation from P-selectin glycoprotein ligand-1 and endoglycan. J. Biol. Chem. 2004;279:2291–2298. doi: 10.1074/jbc.M310396200. [DOI] [PubMed] [Google Scholar]
- 15.Savage B, Saldivar E, Ruggeri ZM. Initiation of platelet adhesion by arrest onto fibrinogen or translocation on von Willebrand factor. Cell. 1996;84:289–297. doi: 10.1016/s0092-8674(00)80983-6. [DOI] [PubMed] [Google Scholar]
- 16.Schmidtke DW, Diamond SL. Direct observation of membrane tethers formed during neutrophil attachment to platelets or P-selectin under physiological flow. J. Cell Biol. 2000;149:719–730. doi: 10.1083/jcb.149.3.719. [DOI] [PMC free article] [PubMed] [Google Scholar]
- 17.Somers WS, Tang J, Shaw GD, Camphausen RT. Insights into the molecular basis of leukocyte tethering and rolling revealed by structures of P- and E-selectin bound to SLe(X) and PSGL-1. Cell. 2000;103:467–479. doi: 10.1016/s0092-8674(00)00138-0. [DOI] [PubMed] [Google Scholar]
- 18.Thomas WE, Trintchina E, Forero M, Vogel V, Sokurenko EV. Bacterial adhesion to target cells enhanced by shear force. Cell. 2002;109:913–923. doi: 10.1016/s0092-8674(02)00796-1. [DOI] [PubMed] [Google Scholar]
- 19.Yago T, Leppanen A, Qiu H, Marcus WD, Nollert MU, Zhu C, Cummings RD, McEver RP. Distinct molecular and cellular contributions to stabilizing selectin-mediated rolling under flow. J. Cell Biol. 2002;158:787–799. doi: 10.1083/jcb.200204041. [DOI] [PMC free article] [PubMed] [Google Scholar]
- 20.Yago T, Wu J, Wey CD, Klopocki AG, Zhu C, McEver RP. Catch bonds govern adhesion through L-selectin at threshold shear. J. Cell Biol. 2004;166:913–923. doi: 10.1083/jcb.200403144. [DOI] [PMC free article] [PubMed] [Google Scholar]
- 21.Yago T, Zarnitsyna VI, Klopocki AG, McEver RP, Zhu C. Transport governs flow-enhanced cell tethering through L-selectin at threshold shear. Biophys. J. 2007;92:330–342. doi: 10.1529/biophysj.106.090969. [DOI] [PMC free article] [PubMed] [Google Scholar]


