Abstract
We present a new standard atlas of the human brain based on magnetic resonance images. The atlas was generated using unbiased population registration from high-resolution images obtained by multichannel-coil acquisition at 3T in a group of 24 normal subjects. The final atlas comprises three anatomical channels (T1-weighted, early and late spin echo), three diffusion-related channels (fractional anisotropy, mean diffusivity, diffusion-weighted image), and three tissue probability maps (CSF, gray matter, white matter). The atlas is dynamic in that it is implicitly represented by nonrigid transformations between the 24 subject images, as well as distortion-correction alignments between the image channels in each subject. The atlas can, therefore, be generated at essentially arbitrary image resolutions and orientations (e.g., AC/PC aligned), without compounding interpolation artifacts. We demonstrate in this paper two different applications of the atlas: (a) region definition by label propagation in a fiber tracking study is enabled by the increased sharpness of our atlas compared with other available atlases, and (b) spatial normalization is enabled by its average shape property. In summary, our atlas has unique features and will be made available to the scientific community as a resource and reference system for future imaging-based studies of the human brain.
Keywords: Brain atlas, multi-spectral magnetic resonance imaging, diffusion tensor imaging, unbiased population registration, spatial normalization, label propagation
1. INTRODUCTION
An anatomical atlas, like a geographical atlas, provides a standardized coordinate system in which anatomical structures and their spatial relationships with each other are represented. Digital anatomical atlases, in particular, commonly take the form of three-dimensional (3D) images that depict anatomy by means of one or more morphological imaging modalities, e.g., X-ray computed tomography (CT), or magnetic resonance imaging (MRI). These are often accompanied by maps of semantic labels, so-called segmentations, that delineate various structures of interest. As Maziotta et al.1 point out, however, anatomy is different in every individual, and thus, unlike geography, does not have an underlying unambiguous and invariant physical reality.
Many different atlases of different anatomies have therefore been created. Some atlases are based simply on a single individual, such as the well-known Talairach & Tournoux atlas2 of the human brain, or the whole-body Visible Human dataset.3 Other atlases attempt to capture subject-independent properties by virtue of being constructed from populations of individuals. Population atlases have been created of the human brain,4-7 as well as for other species, such as the rat;8 the honey bee, Apis Melifera,9,10 the desert locust, Schistocerca gregaria;11 the fruitfly, Drosophila.12,13 More detailed atlases that focus on particular organs or anatomical regions are also common, such as the recently presented comprehensive map of the Drosophila olfactory system at the single-neuron level.14
Atlases of the human brain based on MRI in particular have enabled numerous neuroscience studies by providing standard anatomical coordinate systems for joint data analysis. They are also used to define anatomical structures and then propagate them to individual images (atlas-based segmentation), where they can then be used, for example, as standardized seed and target regions in population studies of fiber tracking in diffusion tensor images (DTI).
It is noteworthy that quite different atlases are typically used for the two aforementioned applications. Atlases for spatial normalization usually represent subject-independent anatomical relationships derived from a population of individuals, but contain some residual uncertainty of spatial localization due to imperfect alignment (i.e., registration) across individuals. Atlases for label propagation, on the other hand, are commonly based on images obtained from a single individual, so that anatomical landmarks are well-defined, albeit in a coordinate system that is not necessarily a good representative of the population of interest.
We present in this work a new brain atlas that is based on high-resolution MRI acquired from 24 subjects and named accordingly, “SRI24 atlas.” The SRI24 atlas improves on currently available atlases several ways: it includes a rich collection of data channels (structural, DTI, tissue classes, anatomical region definitions) in an unbiased population-average coordinate system. Most importantly, by its construction the SRI24 atlas is equally well-suited for spatial normalization and for label propagation, thus eliminating the need to use different atlases for each task.
2. ATLAS CONSTRUCTION
2.1 Rationale
To maximize the usefulness of the new atlas, we pose several requirements that guided the design of the image acquisition protocols and image processing pipeline. In particular, the atlas shall:
be based on image data acquired using state-of-the art imaging equipment and techniques,
represent normal human brain anatomy across a large age range, and
provide all practically relevant channels of information.
2.2 Imaging and Subjects
Volunteers were 12 young (25.5±4.34, range = 19 to 33 years) and 12 elderly (77.67±4.94, range = 67 to 84 years), righthanded, non-smoking healthy men and women, recruited from the local community. All participants underwent a thorough psychiatric interview by a trained research psychologist using the Structured Clinical Interview for the Diagnostic and Statistical Manual (DSM) IV to detect psychiatric diagnoses or medical conditions that can affect brain functioning (e.g., diabetes, head-injury, epilepsy, substance abuse) or preclude MR study (e.g., pacemakers).
Imaging was performed on a 3.0T GE scanner with an 8-channel head coil. Some sequences used the temporal acceleration of GE’s Array Spatial Sensitivity Encoding Technique (ASSET). Four imaging sequences were collected:
For T1-weighted structural images: 3D axial IR-prep SPoiled Gradient Recalled (SPGR), TR=6.5ms, TE=1.54ms, thick=1.25mm, skip=0, locations=124.
For T2-weighted and proton density-weighted images: 2D axial dual-echo fast spin echo (FSE), TR=10,000ms, TE=14/98ms, thick=2.5mm, skip=0, locations=62.
For diffusion tensor computation: 2D echo-planar diffusion-weighted images (DWI), TR=7500ms, TE=97.6ms, thick=2.5mm, skip=0, locations=62, b=0 (5 NEX), plus 15 non-collinear diffusion directions b=860 s/mm2 (2 NEX), plus 15 opposite polarity non-collinear diffusion directions b=860,s/mm2 (2 NEX) FOV=240 mm, x-dim=96, y-dim=96, reconstructed to 128×128 pixels.
For field map computation to spatially unwarp DWI: 2D axial dual-echo gradient echo (GRE), TR=460ms, TE=3/5ms, thick=2.5mm, skip=0, locations=62.
In the DWI, eddy-current distortions were minimized on a slice-by-slice basis by within-slice registration that takes advantage of the symmetry of the opposing polarity acquisition. The individual repeat acquisitions for each diffusion direction were averaged, eliminating the need to account for the cross terms between imaging and diffusion gradients producing 15 images per location for tensor computation. A field map was constructed from the complex difference image between two echoes (3 and 5ms) of the GRE after unwrapping with PRELUDE. B0 inhomogeneity distortion was corrected with FUGUE (FSL Utility for Geometrically Unwarping EPIs).
2.3 Image Preprocessing
For each subject, the following preprocessing steps were performed to correct imaging artifacts and bring all image channels into alignment:
A preliminary brain mask was extracted by thresholding the late-echo FSE image.
Intensity inhomogeneity correction was applied to the late-echo FSE images using the preliminary brain mask. We computed a second-order polynomial multiplicative bias field using a model-free entropy-minimization algorithm.15
The final brain mask was extracted from intensity-corrected late-echo image using the FSL Brain Extraction Tool, BET.16
Intensity inhomogeneity correction was achieved by applying a second-order multiplicative bias field that was computed from the late-echo FSE images using the final brain mask.15 The same estimated bias field was equally applied to the early-echo FSE image. Use of the same bias field for early and late echo images guarantees invariance of R2 values that can be derived at each pixel from the log-ratio of early and late-echo image intensities.
The early-echo FSE images were registered to the respective SPGR images and the FSE brain masks were transferred to the SPGRs by label propagation.
Intensity inhomogeneity correction15 with a second-order multiplicative bias field was applied to the SPGR images using the propagated brain masks.
2.4 Within-Subject Registration
Using the brain-stripped images and intensity bias-corrected images as described above, the different MRI channels acquired for each subject were brought into alignment as follows:
Masked and bias-corrected late-echo FSE images were registered to the masked and bias-corrected SPGR images.
To align DTI and anatomical images and to correct for residual geometrical distortion, each b = 0 EPI was registered nonrigidly17 to the corresponding late-echo FSE image.
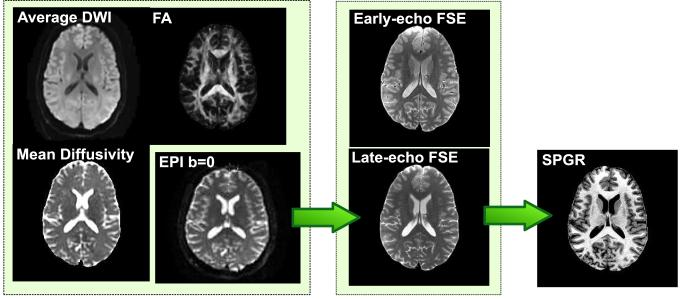
The final registration transformations that connect the channels within each subject are shown in Fig. 1.
Figure 1.
Illustration of the registration links between the images from one subject. The b = 0 echo-planar image (EPI) is registered to the late-echo FSE image, which is in turn registered to the SPGR image. The diffusion tensor-derived parameter maps are naturally co-registered to the b = 0 EPI. The early-echo FSE image is naturally co-registered to the late-echo image (due to dual-echo acquisition). Only the final transformations are shown; intermediate transformations, computed for the purpose of propagating brain masks, are omitted for clarity.
2.5 Across-Subject Alignment by Population Image Registration
All 24 brain-stripped and bias-corrected SPGR images were first simultaneously registered with affine transformations using a template-free registration algorithm. The reference coordinate space, which was not related to any of the subject image spaces, was mapped onto each subject’s SPGR image by an affine coordinate transformation with the following nine degrees of freedom:
three translations, δx, δy, δz,
three rotation angles, α, β, γ, and
three log-scale factors, lx = log cx, ly = log cy, lz = log cz.
The use of log-scale factors ensures that the identity transformation is described by the zero parameter vector and allows us to enforce zero sums over all subjects for each of the transformation parameters.
The image similarity measure for the template-free affine registration was a multi-image generalization of mutual information.18 To avoid the common issues with sparse histograms, this algorithm takes advantage of the fact that, under certain assumptions, the marginal and joint entropies of the registered image channels are proportional to the determinants of appropriate covariance matrices (see reference for details).
The affine registration stage was followed by a novel unbiased nonrigid registration algorithm based on the B-spline transformation model by Rueckert et al.,17 the stack entropy similarity measure used in the “congealing” algorithm by Learned-Miller,19 and the zero-mean deformation strategy by Studholme & Cardenas.20
Our implementation of this new algorithm uses shared-memory parallelism,21 distributed-memory parallelism, and dynamic load balancing. Using a multi-resolution approach for image data and B-spline control point grid, our implementation completed the simultaneous nonrigid registration of all 24 images with a final control point spacing of 2.5mm (resulting in 47 million degrees of freedom) in about 60 hours on a cluster of 8 dual-CPU servers with a total of 16 Intel Xeon processors (Nocona) at 3.0 GHz.
2.6 Atlas Generation
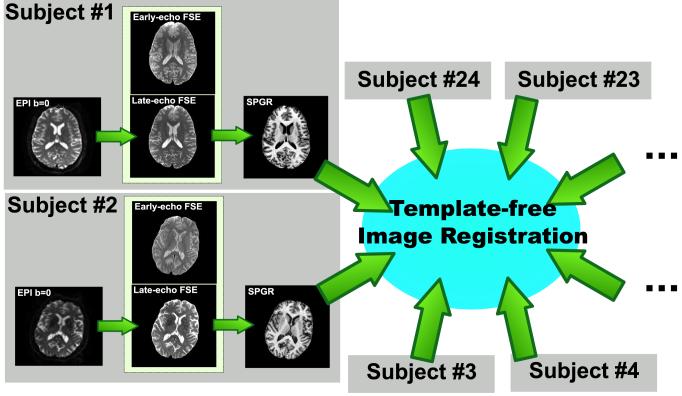
The final registration transformations that connect the different channels of all subject images are illustrated in Fig. 2. Using concatenations of the appropriate transformations, all channels of information are reformatted directly into the final atlas space. Each image was, therefore, interpolated only once to avoid accumulation of interpolation artifacts.
Figure 2.
Illustration of the registration links between the images that the SRI24 atlas is constructed from. For each subject, the b = 0 EPI is registered to the late-echo FSE image, which in turn is registered to the SPGR image. The early and late-echo FSE images from each subject were acquired in a single, dual-echo acquisition and are, therefore, in perfect registration. The SPGR images from all 24 subjects are co-registered using a simultaneous, template-free registration algorithm.
2.6.1 Structural Channels
All co-registered structural image channels were reformatted into the atlas space using a cubic interpolation kernel. The image intensities of the reformatted images were then normalized to equal means and standard deviations. The reformatted and normalized images were then averaged.
2.6.2 Diffusion Channels
The DTI-derived image channels of scalar diffusion measures (FA and MD) were generated in subject space from tensor fields that were reconstructed in native image coordinates. The scalar images were then reformatted into the atlas space using a cubic interpolation kernel. The reformatted and normalized images were then averaged, and the value range of the averaged FA image was truncated to [0, 1] so as to eliminate illegal values introduced by the cubic interpolation.
2.6.3 Tissue Probability Maps
Tissue probability maps were independently obtained for each subject using FSL’s “FAST” tool22 on the stripped and bias-corrected SPGR images in each subject’s individual coordinate space. The segmentation probability maps were then reformatted into atlas space and numerically averaged.
2.6.4 Brain Masks
Brain masks were generated in subject space using the FSL Brain Extraction Tool, BET,16 reformatted into atlas space and averaged using Rohlfing and Maurer’s shape-based averaging algorithm.23
2.6.5 Diffusion Tensor Field
An experimental average tensor field was generated by reconstructing re-oriented diffusion tensors from all subjects in atlas space.24 The tensor fields were then averaged using simple arithmetic matrix averaging of the diffusion tensors.
3. ATLAS APPLICATIONS
3.1 The SRI24 Brain Atlas
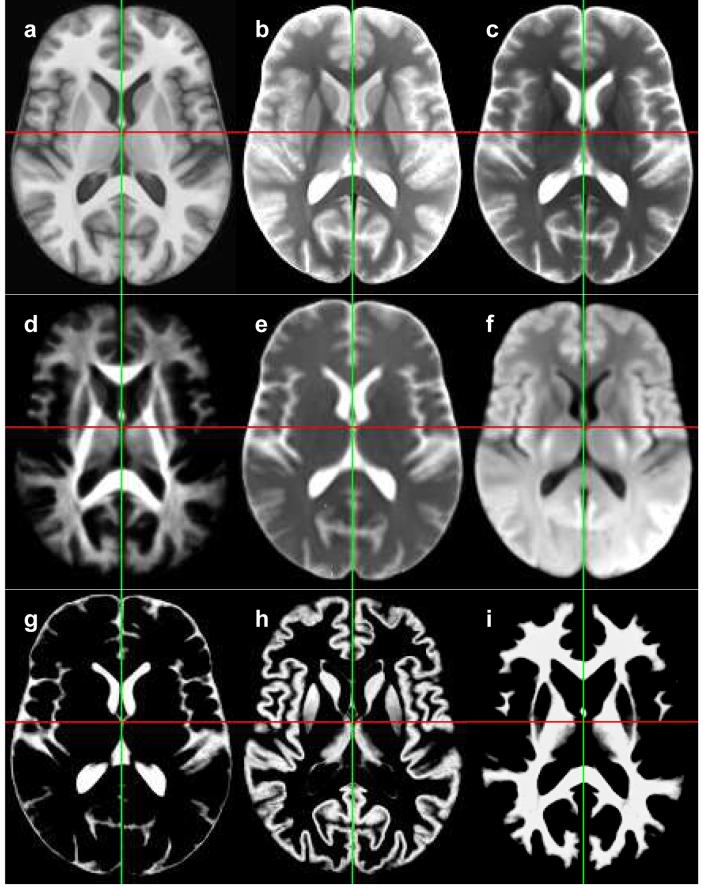
Representative axial slices through the different channels that comprise the SRI24 atlas are shown in Fig. 3. Note the detailed representation of brain anatomy, in particular the clearly defined subcortical structures. Accordingly, the tissue probability maps (Fig. 3, bottom row) are almost binary images.
Figure 3.
Axial slices from the SRI24 multi-channel brain atlas. (a) Anatomical SPGR image. (b) Early-echo spin echo image. (c) Late-echo spin echo image. (d) Fractional anisotropy map. (e) Mean diffusivity map. (f) Average diffusion-weighted image. (g) CSF probability map. (h) Grey matter probability maps. (i) White matter probability map.
3.2 Label Propagation
Label propagation, or atlas-based segmentation, is a commonly used technique to segment images by registering them to an already segmented atlas image and then propagating the labels from the atlas to the new image according to the spatial transformation between them.25 We have previously shown26-28 that segmentation results can be greatly improved by using multiple independent atlases. However, this is not always a practical approach as it requires time-consuming manual labeling of all structures of interest in more than a single atlas image. As we have also demonstrated previously,26 an “average shape atlas,” like the SRI24, does not perform as well as multiple independent atlases, but it still typically outperforms an atlas based on a single individual. According to work by Wang et al.,29 label propagation from a carefully constructed average shape atlas can perform close to independent propagation from multiple individual atlases but requires substantially less effort to construct.
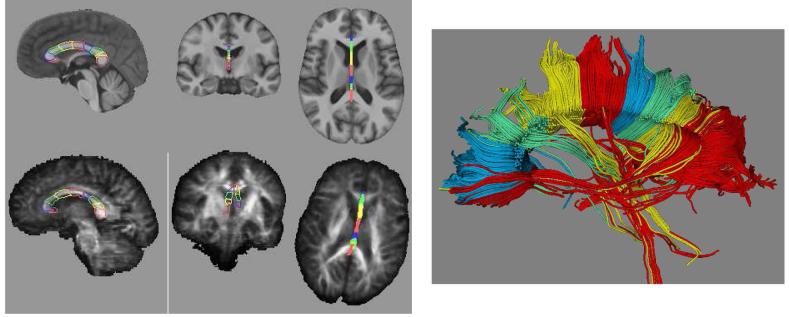
The usefulness of our atlas for region definition, and thus atlas-based labeling, is illustrated in Fig. 4. A parcellation of the corpus callosum in the atlas was propagated onto a co-registered subject image and provided target regions for DTI fiber tracking.
Figure 4.
Example of region definition for fiber tracking using the SRI24 atlas and label propagation. Left: parcellation of the corpus callosum into nine segments defined in the SRI24 atlas (top row) and propagated onto a subject’s FA map (bottom row). Right: fiber tracts determined in subject’s diffusion tensor image and colored according to the parcellation of the corpus callosum.
3.3 Spatial Normalization
To assess the usefulness of the SRI24 atlas for spatial normalization, we compared it with four other established atlases, which are all shown in Fig. 5: the MNI152 atlas,4 the ICBM-452T1/air12 and ICBM-452T1/warp5 atlases,30 and the Colin27 brain. Each of these atlases was used as the target for spatially normalizing 14 brain images from the IBSR database.31 For simplicity, we selected those 14 out of all 18 images available from the IBSR for which the BET brain extraction tool successfully performed skull stripping without manual adjustments. These were all images except 6, 9, 10, and 12.
Figure 5.
Examples of other publicly available MRI-based brain atlases. Only T1-weighted images are available for all atlases in this figure. (a) Colin-27 brain atlas generated by averaging 27 independently acquired SPGR images of the same subject. (b) MNI-152 atlas (at 2 mm resolution, as distributed with FSL). (c) ICBM452/air12 atlas. (d) ICBM452/warp5 atlas. Note the still substantial fuzziness of this atlas, especially when compared with the SRI24.
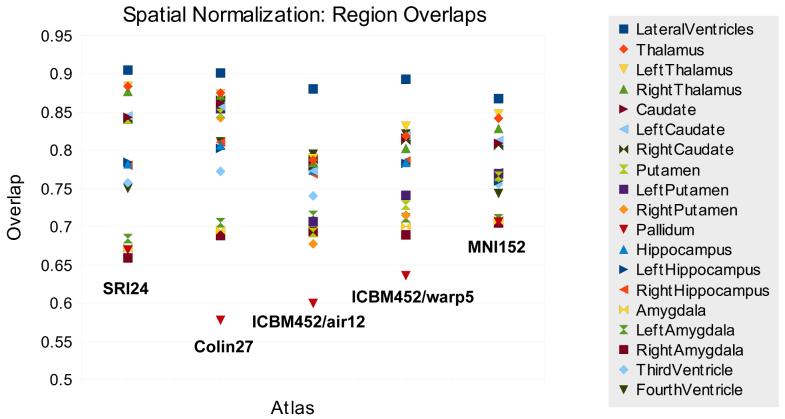
The segmentations provided for 19 anatomical structures (paired structures were mapped separately as well as combined) in each of the IBSR images were then propagated onto each of the atlases. Here, groupwise overlap scores accordingto Crum et al.32 were computed for all 14 brains registered onto each atlas. Higher overlap scores indicate better consistency between the anatomies mapped onto the atlas, suggesting that an atlas with higher overlap scores is better suited for spatial normalization than one with lower scores.
The overlap scores for all structures mapped onto each atlas are shown in Table 1. We report the volume-weighted (each anatomical structure weighted according to its volume) and equally-weighted (all structures assigned equal weights) overlaps (see Crum et al.32 for details). The overlaps for the separate structures are also graphically depicted in Fig. 6. All results suggest that the SRI24 atlas performs at least as well as the other four evaluated atlases for spatial normalization, and in most cases better. Although the SRI24 atlas does not perform equally well for all brain structures (Fig. 6), it is not as susceptible to outliers as are the Colin27 brain and the two ICBM atlases. Compared with the MNI152 atlas, the SRI24 atlas demonstrated better performance when all brain structures in this experiment are considered.
Table 1.
Groupwise overlap scores for 14 images from the IBSR database spatially normalized to each of five atlases
| Atlas | SRI24 | Colin27 | ICBM452/air12 | ICBM452/warp5 | MNI152 |
|---|---|---|---|---|---|
| Overlap, volume weighted | 0.745 | 0.733 | 0.720 | 0.728 | 0.712 |
| Overlap, equally weighted | 0.510 | 0.519 | 0.487 | 0.502 | 0.487 |
Figure 6.
Overlap scores for spatial normalization of 14 segmented MR head images from the IBSR to different atlases. Note that the SRI24 atlas is derived from images acquired at 3.0T, whereas all other atlases and the IBSR images used to evaluate spatial normalization were acquired at 1.5T.
For a practical demonstration of the utility of the atlas for spatial normalization, data from ten young and ten elderly subjects not used in the atlas construction were registered to the atlas and group averages of FA constructed (Fig. 7). The resulting group-average FA maps demonstrate the well-known effect of decreased FA with increasing age. Analyses similar to this are frequently done in Voxel-Based Morphometry studies for comparisons between different groups of subjects. Of particular interest here is how consistently the FA maps from all subjects in either group were co-registered with the SRI24 atlas, although registration was based on the SPGR image channels of subjects and atlas.
Figure 7.
Illustration of the SRI24 atlas for spatial normalization. (a) Average FA maps for ten young (left) and ten elderly (right) subjects (from33) after registration and reformatting into the atlas space. (b) Line profile reveals lower FA in the elderly subjects (gray line) than the young subjects (black line). White line in (a) marks the level at which FA is quantified.
4. DISCUSSION
In summary, we claim the following contributions: (1) The SRI24 atlas is derived from a sample of subjects, unlike the Colin27 brain (Fig. 5(a)), and is thus potentially better suited to represent a “typical” anatomy. This makes our atlas useful as a spatial normalization template by reducing the average deformation required to map subjects onto it. (2) We used nonlinear registration (unlike the MNI250,34 MNI305,35 ICBM152,4 and ICBM-452T1/air1230 atlases), which provides substantially improved sharpness (compare Fig. 3 with Fig. 5(b-d)). This makes our atlas useful for definition of regions that can be transferred onto other images by label propagation. (3) We used unbiased nonrigid population registration, unlike any other published atlas, to capture normal anatomy and take advantage of population information during the registration stage, rather than perform pairwise registrations and combine them into a population alignment. We thus avoid the potentially difficult registration problem between two outlier subjects with very dissimilar anatomies. (4) Our atlas is multi-spectral and, unlike any other available atlas, includes DTI-derived scalar diffusion parameter maps and an experimental group-average tensor field. (5) The atlas is dynamic and can be generated in arbitrary resolutions and orientations, without compounding interpolation artifacts.
Our technical contributions are the application of Russakoff’s high-dimensional entropy computation to population registration and the introduction of an unbiased nonrigid B-spline population registration algorithm. Both algorithms were implemented to use both shared-memory and distributed memory parallelism simultaneously and to optimize node workloads using dynamic load balancing.
We have demonstrated the usefulness of the SRI24 atlas for both spatial normalization and label propagation. For spatial normalization, we have performed a quantitative evaluation study and compared it with four commonly used MR brain atlases: the MNI152 atlas, the ICBM452/air5 and ICBM452/warp5 atlases, and the Colin27 brain. Our results indicate that the SRI24 atlas is at least as suitable for spatial normalization as the other four atlases. This is remarkable in particular because the SRI24 atlas is based on image data acquired at 3T, whereas all other atlases and the images of the IBSR database were all acquired at 1.5T. This demonstrates that the use of the SRI24 atlas is not limited to applications involving data acquired at the same field strength.
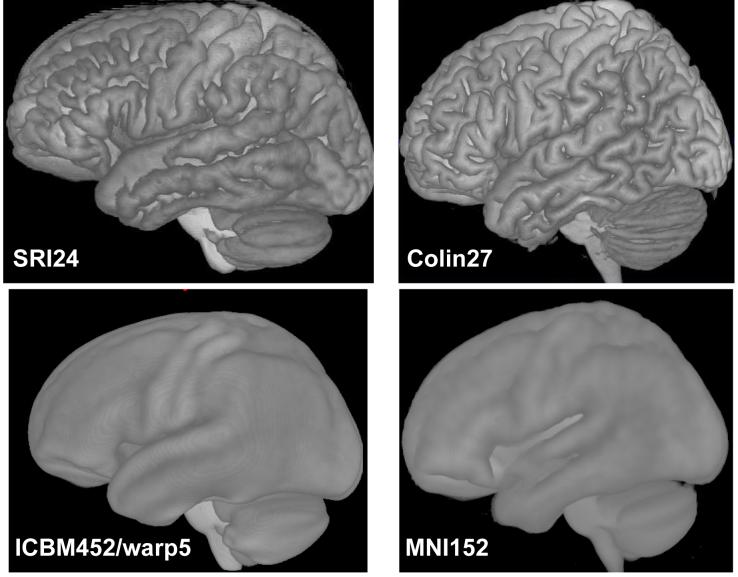
For label propagation, we have not performed an analogous comparison study between the different atlases. We note that out of the four comparison atlases only the Colin27 brain lends itself to label propagation in the first place, because the MNI152 as well as both ICBM452 atlases do not show sufficient anatomical detail to define regions of interest. Similarly, only the Colin27 brain and the SRI24 atlas represent the cortical surface with sufficient sharpness to identify the major gyri and sulci (Fig. 8).
Figure 8.
Volume renderings of four atlases illustrate the level of sharpness with which the cortical surface is defined in each.
To use the ICBM and MNI atlases for label propagation, one could of course define regions in the images that the atlases were created from and then transfer these labellings to the atlas to obtain a probabilistic label map.4 The obvious practical drawback of such an approach is the need to label a large number of brains rather than a single one. Of course this also requires access to the original brains and the transformations between them, neither of which are publicly available. The SRI24 atlas, on the other hand, is sufficiently crisp that anatomical structures of interest can be identified and labeled directly in the atlas itself.
5. CONCLUSIONS
We have described the construction of a multi-channel brain atlas using state-of-the-art and partly novel population registration methods. We have furthermore demonstrated the application of the atlas for spatial normalization in a group comparison study and for region definition in a fiber tracking study. Our atlas has unique features and will be made available to the scientific community as a resource and reference system for future imaging-based studies of the human brain.
ACKNOWLEDGMENTS
This work was supported through Grants AA005965, AA012888, AA012999, and AG017919.
The MR brain data sets and their manual segmentations used for evaluating spatial normalization were provided by the Center for Morphometric Analysis at Massachusetts General Hospital and are available at http://www.cma.mgh.harvard.edu/ibsr/
REFERENCES
- 1.Mazziotta JC, Toga AW, Evans A, Fox P, Lancaster J. A probabilistic atlas of the human brain: Theory and rationale for its development. NeuroImage. 1995 Jun;2:89–101. doi: 10.1006/nimg.1995.1012. [DOI] [PubMed] [Google Scholar]
- 2.Talairach J, Tournoux T. Co-planar Stereotaxic Atlas of the Human Brain: 3-Dimensional Proportional System - an Approach to Cerebral Imaging. Thieme Medical Publishers; New York: 1988. [Google Scholar]
- 3.Spitzer V, Ackerman MJ, Scherzinger AL, Whitlock D. The visible human male: a technical report. Journal of the American Medical Informatics Association. 1996 Mar;3:118–130. doi: 10.1136/jamia.1996.96236280. [DOI] [PMC free article] [PubMed] [Google Scholar]
- 4.Mazziotta J, Toga A, Evans A, Fox P, Lancaster J, Zilles K, Woods R, Paus T, Simpson G, Pike B, Holmes C, Collins L, Thompson P, MacDonald D, Iacoboni M, Schormann T, Amunts K, Palomero-Gallagher N, Geyer S, Parsons L, Narr K, Kabani N, Le Goualher G, Boomsma D, Cannon T, Kawashima R, Bernard M. A probabilistic atlas and reference system for the human brain: International Consortium for Brain Mapping (ICBM) Philosophical Transactions of the Royal Society of London. Series B, Biological Sciences. 2001 Aug;356:1293–1322. doi: 10.1098/rstb.2001.0915. [DOI] [PMC free article] [PubMed] [Google Scholar]
- 5.Mazziotta J, Toga A, Evans A, Fox P, Lancaster J, Zilles K, Woods R, Paus T, Simpson G, Pike B, Holmes C, Collins L, Thompson P, MacDonald D, Iacoboni M, Schormann T, Amunts K, Palomero-Gallagher N, Geyer S, Parsons L, Narr K, Kabani N, Le Goualher G, Feidler J, Smith K, Boomsma D, Hulshoff Pol H, Cannon T, Kawashima R, Mazoyer B. A four-dimensional probabilistic atlas of the human brain. Journal of the American Medical Informatics Association. 2001 Sep;8:401–430. doi: 10.1136/jamia.2001.0080401. [DOI] [PMC free article] [PubMed] [Google Scholar]
- 6.Woods RP, Dapretto M, Sicotte NL, Toga AW, Mazziotta JC. Creation and use of a Talairach-compatible atlas for accurate, automated, nonlinear intersubject registration, and analysis of functional imaging data. Human Brain Mapping. 1999 Aug;8:73–79. doi: 10.1002/(SICI)1097-0193(1999)8:2/3<73::AID-HBM1>3.0.CO;2-7. [DOI] [PMC free article] [PubMed] [Google Scholar]
- 7.Kazemi K, Moghaddam HA, Grebe R, Gondry-Jouet C, Wallois F. A neonatal atlas template for spatial normalization of whole-brain magnetic resonance images of newborns: Preliminary results. NeuroImage. 2007 Aug;37:463–473. doi: 10.1016/j.neuroimage.2007.05.004. [DOI] [PubMed] [Google Scholar]
- 8.Toga AW, Santori EM, Hazani R, Ambach K. A 3D digital map of rat brain. Brain Research Bulletin. 1995;38(1):77–85. doi: 10.1016/0361-9230(95)00074-o. [DOI] [PubMed] [Google Scholar]
- 9.Rohlfing T, Brandt R, Maurer CR, Jr., Menzel R. Bee brains, B-splines and computational democracy: Generating an average shape atlas. In: Staib L, editor. IEEE Workshop on Mathematical Methods in Biomedical Image Analysis. IEEE Computer Society; Los Alamitos, CA, (Kauai, HI): 2001. pp. 187–194. [Google Scholar]
- 10.Brandt R, Rohlfing T, Rybak J, Krofczik S, Maye A, Westerhoff M, Hege H-C, Menzel R. Three-dimensional average-shape atlas of the honeybee brain and its applications. Journal of Comparative Neurology. 2005 Nov;492:1–19. doi: 10.1002/cne.20644. [DOI] [PubMed] [Google Scholar]
- 11.Kurylas AE, Rohlfing T, Jenett A, Krofczik S, Homberg U. In: Hoffman K-P, Krieglstein K, editors. Standardized atlas of the brain of the desert locust; Proceedings, Seventh Göttingen Meeting of the German Neuroscience Society; Göttingen, Germany. March 29 - April 1, 2007.2007. pp. T20–8A. [Google Scholar]
- 12.Rein K, Zckler M, Mader MT, Grübel C, Heisenberg M. The drosophila standard brain. Current Biology. 2002 Feb;12:227–231. doi: 10.1016/s0960-9822(02)00656-5. [DOI] [PubMed] [Google Scholar]
- 13.Jenett A, Schindelin JE, Heisenberg M. The Virtual Insect Brain protocol: creating and comparing standardized neuroanatomy. BMC Bioinformatics. 2006 Dec;7:544. doi: 10.1186/1471-2105-7-544. [DOI] [PMC free article] [PubMed] [Google Scholar]
- 14.Jefferis GS, Potter CJ, Chan AM, Marin EC, Rohlfing T, Maurer CR, Jr., Luo L. Comprehensive maps of drosophila higher olfactory centers: Spatially segregated fruit and pheromone representation. Cell. 2007 Mar;128:1187–1203. doi: 10.1016/j.cell.2007.01.040. [DOI] [PMC free article] [PubMed] [Google Scholar]
- 15.Likar B, Viergever MA, Pernus F. Retrospective correction of MR intensity inhomogeneity by information minimization. IEEE Transactions on Medical Imaging. 2001 Dec;20:1398–1410. doi: 10.1109/42.974934. [DOI] [PubMed] [Google Scholar]
- 16.Smith SM. Fast robust automated brain extraction. Human Brain Mapping. 2002;17(3):143–155. doi: 10.1002/hbm.10062. [DOI] [PMC free article] [PubMed] [Google Scholar]
- 17.Rueckert D, Sonoda LI, Hayes C, Hill DLG, Leach MO, Hawkes DJ. Nonrigid registration using free-form deformations: Application to breast MR images. IEEE Transactions on Medical Imaging. 1999 Aug;18:712–721. doi: 10.1109/42.796284. [DOI] [PubMed] [Google Scholar]
- 18.Russakoff DB, Tomasi C, Rohlfing T, Maurer CR., Jr. Image similarity using mutual information of regions; Computer Vision - ECCV 2004: 8th European Conference on Computer Vision, Prague, Czech Republic, May 11-14, 2004. Proceedings, Part III, Lecture Notes in Computer Science; Springer-Verlag, (Berlin/Heidelberg). 2004.pp. 596–607. [Google Scholar]
- 19.Learned-Miller EG. Data driven image models through continuous joint alignment. IEEE Transactions on Pattern Analysis and Machine Intelligence. 2006 Feb;28:236–250. doi: 10.1109/TPAMI.2006.34. [DOI] [PubMed] [Google Scholar]
- 20.Studholme C, Cardenas V. A template free approach to volumetric spatial normalization of brain anatomy. Pattern Recognition Letters. 2004 Jul;25:1191–1202. [Google Scholar]
- 21.Rohlfing T, Maurer CR., Jr. Nonrigid image registration in shared-memory multiprocessor environments with application to brains, breasts, and bees. IEEE Transactions on Information Technology in Biomedicine. 2003;7(1):16–25. doi: 10.1109/titb.2003.808506. [DOI] [PubMed] [Google Scholar]
- 22.Zhang Y, Brady M, Smith S. Segmentation of brain MR images through a hidden Markov random field model and the expectation-maximization algorithm. IEEE Transactions on Medical Imaging. 2001 Jan;20:45–57. doi: 10.1109/42.906424. [DOI] [PubMed] [Google Scholar]
- 23.Rohlfing T, Maurer CR., Jr. Shape-based averaging. IEEE Transactions on Image Processing. 2007 Jan;16:153–161. doi: 10.1109/tip.2006.884936. [DOI] [PubMed] [Google Scholar]
- 24.Rohlfing T, Sullivan EV, Pfefferbaum A. In: Karssemeijer N, Lelieveldt B, editors. Divergence-based framework for diffusion tensor clustering, interpolation, and regularization; Information Processing in Medical Imaging - 20th International Conference, IPMI 2007, Kerkrade, The Netherlands, July 2-6, 2007. Proceedings; Springer-Verlag, (Berlin/Heidelberg). 2007; pp. 507–518. Lecture Notes in Computer Science. [DOI] [PubMed] [Google Scholar]
- 25.Miller MI, Christensen GE, Amit Y, Grenander U. Mathematical textbook of deformable neuroanatomies. Proceedings of the National Academy of Sciences of the U.S.A. 1993;90(24):11944–11948. doi: 10.1073/pnas.90.24.11944. [DOI] [PMC free article] [PubMed] [Google Scholar]
- 26.Rohlfing T, Brandt R, Menzel R, Maurer CR., Jr. Evaluation of atlas selection strategies for atlas-based image segmentation with application to confocal microscopy images of bee brains. NeuroImage. 2004 Apr;21:1428–1442. doi: 10.1016/j.neuroimage.2003.11.010. [DOI] [PubMed] [Google Scholar]
- 27.Rohlfing T, Maurer CR., Jr. Multi-classifier framework for atlas-based image segmentation. Pattern Recognition Letters. 2005 Oct;26:2070–2079. [Google Scholar]
- 28.Rohlfing T, Russakoff DB, Maurer CR., Jr. Performance-based classifier combination in atlas-based image segmentation using expectation-maximization parameter estimation. IEEE Transactions on Medical Imaging. 2004 Aug;23:983–994. doi: 10.1109/TMI.2004.830803. [DOI] [PubMed] [Google Scholar]
- 29.Wang Q, Seghers D, D’Agostino E, Maes F, Vandermeulen D, Suetens P, Hammers A. In: Christensen GE, Sonka M, editors. Construction and validation of mean shape atlas templates for atlas-based brain image segmentation; Information Processing in Medical Imaging - 19th International Conference, IPMI 2005, Glenwood Springs, CO, USA, July 2005, Proceedings; Springer-Verlag, (Berlin/Heidelberg). 2005; pp. 689–700. Lecture Notes in Computer Science. [DOI] [PubMed] [Google Scholar]
- 30.LONI atlases. Online, http://www.loni.ucla.edu/Atlases/
- 31.Internet Brain Segmentation Repository. http://www.cma.mgh.harvard.edu/ibsr/
- 32.Crum WR, Camara O, Rueckert D, Bhatia KK, Jenkinson M, Hill DL. In: Duncan JS, Gerig G, editors. Generalised overlap measures for assessment of pairwise and groupwise image registration and segmentation; Medical Image Computing and Computer-Assisted Intervention — MICCAI 2005: 8th International Conference, Palm Springs, CA, USA, October 26-29, 2005, Proceedings, Part I; Springer-Verlag, (Berlin/Heidelberg). 2005; pp. 99–106. Lecture Notes in Computer Science. [DOI] [PubMed] [Google Scholar]
- 33.Sullivan EV, Adalsteinsson E, Pfefferbaum A. Selective age-related degradation of anterior callosal fiber bundles quantified in vivo with fiber tracking. Cerebral Cortex. 2006 Jul;16:1030–1039. doi: 10.1093/cercor/bhj045. [DOI] [PubMed] [Google Scholar]
- 34.Evans AC, Collins DL, Milner B. An MRI-based stereotactic atlas from 250 young normal subjects. Society for Neuroscience Abstracts. 1992;18:408. Abstract No. 179.4. [Google Scholar]
- 35.Evans AC, Collins DL. A 305-member MRI-based stereotactic atlas for CBF activation studies; Proceedings of the 40th Annual Meeting of the Society for Nuclear Medicine; 1993. [Google Scholar]


