Abstract
Human red blood cells (RBCs) exhibit vibratory motions, referred to as “flickering.” Their dynamical properties, classically attributed to thermal mechanisms, have not been fully characterized. Using detrended fluctuation analysis and multiscale entropy methods, we show that the short-term flickering motions of RBCs, observed under phase contrast microscopy, have a fractal scaling exponent close to that of 1/f noise and exhibit complex patterns over multiple time scales. Further, these dynamical properties degrade with in vivo aging such that older cells that have been in the circulation longer generate significantly (p <0.003) less complex flickering patterns than newly formed cells. Quantitative assessment of multiscale flickering may provide a way of measuring RBC functionality. Membrane models need to account for the complex properties of these motions and their changes with in vivo senescence.
Human blood contains three major cellular components: red blood cells (RBCs), white blood cells (leukocytes), and platelets. Newly formed (“new”) RBCs are released from the bone marrow and circulate for approximately 120 days before they are removed by the macrophages in the liver and spleen. Thus, circulating RBCs represent a continuum of new to senescent (“old”) cells. As RBCs age in vivo a number of processes occur, including membrane loss and increase in cell density and stiffness [1].
The RBC membrane has a vibratory motion, called “flickering,” which was observed decades ago [2]. The maximum amplitude of this motion is of the order of 0.4 μm [3], i.e., approximately 5% of the average RBC diameter (~7.5 μm). The overall frequency range of flickering has yet to be determined. Previous studies reported values ranging from 0.2 to 30 Hz [3,4].
Flickering was initially attributed solely to thermal membrane fluctuations; subsequently an energy driven mechanism was proposed [5]. However, the bioenergetic bases of flickering remain unresolved [6]. Here, we address the possibility that flickering has a complex temporal structure and an undiscovered biologic role.
The dynamics of membrane diameter changes was analyzed previously [7] from the perspective of quarter power law scaling [8]. However, quantification of the multiscale complexity of the overall membrane dynamics and changes with in vivo aging have not been investigated.
The purpose of this study was to further assess the dynamics of flickering in light of the following hypotheses: (1) RBC membrane fluctuations are complex over multiple time scales, and (2) the dynamical properties change with in vivo aging: old cells generate less complex dynamical patterns than new cells. These joint hypotheses derive from a conceptual framework built on studies showing that (i) healthy physiologic control systems reveal complex spatiotemporal patterns at multiple levels of resolution, and (ii) dynamical complexity degrades with aging and disease [9–13].
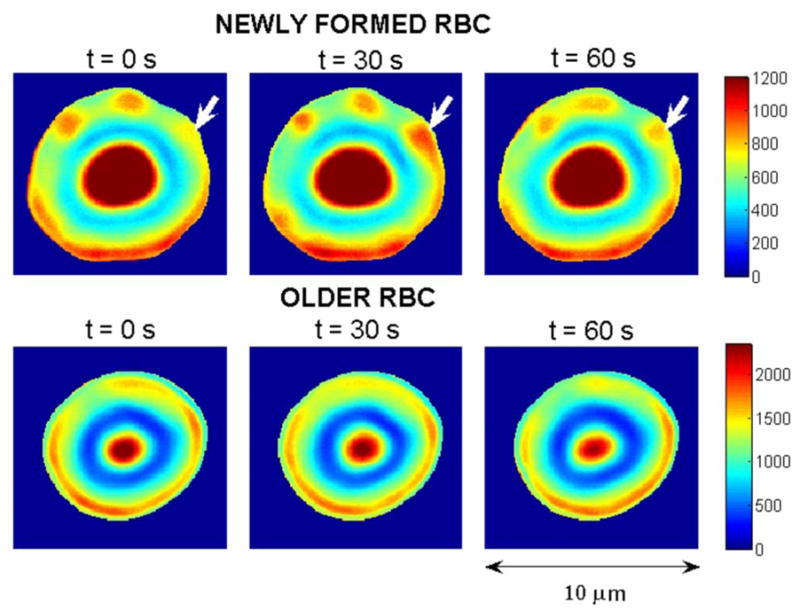
We analyzed time lapse phase contrast microscopy recordings (5000 frames at 34 frames per s)of 26 fresh RBCs (13 new and 13 old ones) from five healthy adult donors (Fig. 1) [14]. Each frame (Fig. 1) is a matrix of numerical values (pixels), which are determined by the thickness of the imaged object (measured along the vertical direction) and the differences between its refractive index and that of the surrounding medium. The pixel size is 0.0625 μm. From the recording of consecutive frames, we derived the time series of light intensity fluctuations for individual pixels (Fig. 2). Dynamical analyses testing the hypotheses above were based on the quantification of these time series.
FIG. 1.

(Color online) Consecutive pseudocolored phase contrast images (30 seconds apart) of a new (top plots) and an old (bottom plots) red blood cell (RBC). Changes in color (unitless scale) are due to membrane oscillations. White arrows point to a domain with relatively high amplitude flickering. For representational purposes, the background and the “halo” surrounding the cell (a phase contrast imaging artifact) were removed. (The range of values is higher for the old RBC than for the new one because the former is thicker than the latter and therefore appears brighter under positive phase contrast microscopy [15].)
FIG. 2.
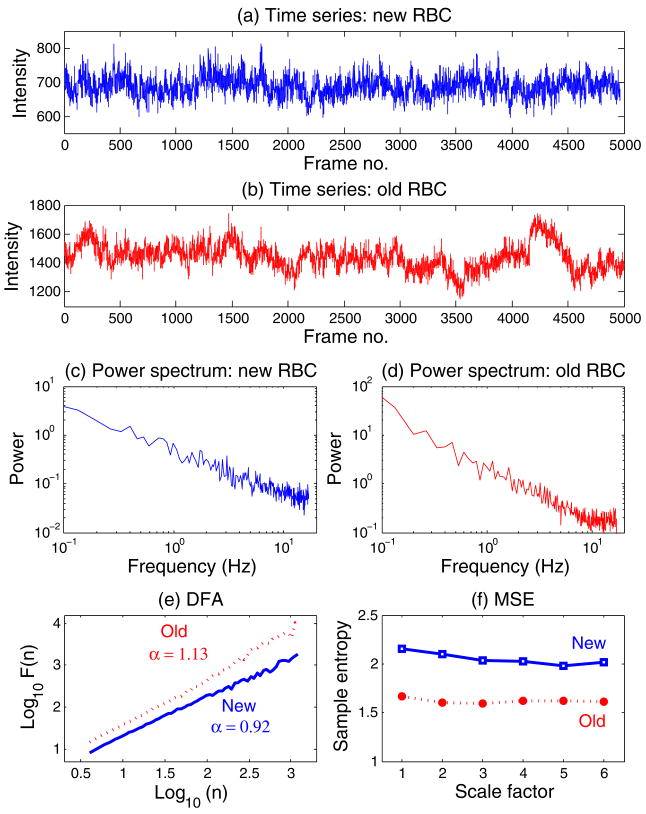
(Color online) Time series of a pixel from the new RBC (a) and the old RBC (b) shown in Fig. 1. The magnitude of the fluctuations is given in arbitrary units. (c), (d) Fourier power spectra for time series in (a) and (b), respectively. A smoothing procedure was applied, which consisted of averaging the spectra for consecutive overlapping segments of 512 data points. Note the absence of a dominant (characteristic) frequency. (e) Detrended fluctuation analyses (DFA) for the two time series shown in (a) and (b). Note that the α (fractal) exponent for the old RBC is higher (closer to 1.5) than for the new cell, indicating that the underlying dynamics of the former membrane is closer to Brownian motion than that of the latter, which shows scaling close to 1/f noise. (f) Multiscale entropy (MSE) analyses for the two time series shown in (a) and (b). The entropy measure (sample entropy [17]) is higher for the new than for the old RBC over time scales ranging from 0.029 (scale factor 1) to 0.174 s (scale factor 6). (Since the sampling frequency is 34 Hz, the scale factor increments by steps of 1/34=0.029 s.)
To quantify the overall dynamical complexity of RBC membrane flickering, for each pixel we calculated (1) a fractal exponent using the detrended fluctuation analysis (DFA) algorithm, a modified root mean square analysis of a random walk [16], and (2) a complexity index derived using the multiscale entropy (MSE) method [11]. These two algorithms quantify different, yet complementary, properties of complex signals.
The DFA algorithm measures the correlation properties of a signal. Briefly, the algorithm quantifies the relationship between F(n), the root mean square fluctuation of an integrated and detrended time series, and the observation window size, n. F(n) increases with window size according to F(n) ~ nα. If α =0.5, the time series represents uncorrelated randomness; if α =1 (1/f noise), the time series has long-range correlations and exhibits scale-invariant properties; if α =1.5, the time series represents a random walk (Brownian motion).
The MSE method [11,12] quantifies the degree of irregularity of a time series over a range of scales. Briefly, the method comprises three steps: (1) a coarse-graining procedure used to construct a set of derived time series representing the system’s dynamics over a range of scales, (2) quantification of the degree of irregularity for each coarse-grained time series using an entropy measure, sample entropy [17], and (3) calculation of the complexity index, CI. The sequence of entropy values for a range of scale is called the MSE curve.
For complex signals, such as 1/f noise time series [12], entropy is constant for all scales because at all levels of resolution the signal exhibits complex fluctuations. In contrast, for uncorrelated (white) noise time series, entropy monotonically decreases with scale because the signal contains maximum information for scale one and no new details (information) are revealed on larger scales. Therefore, not only the absolute values of entropy but also the profiles of the MSE curves have to be taken into consideration to quantify the overall complexity of a time series. To calculate the complexity index, we integrated the entropy values over a preselected range of scales and multiplied the result by 1 or −1, depending on whether the slope of the MSE curve was positive or negative, respectively. In this study, the maximum scale selected was 6, which was determined taking into consideration the length of the original time series [17].
Figure 1 shows consecutive pseudocolored phase contrast images of a new and an old RBC. These images suggest differences in spatial-temporal properties between new and old RBCs.
Figure 2 shows representative examples of two time series: one of a pixel from the new (top panel) cell and another of a pixel from the old (second panel) cell membrane in Fig. 1. The third and fourth panels show the power spectra for these two time series. Neither shows a dominant frequency. The fifth and sixth panels show the analyses of the same time series using DFA analysis and the MSE method, respectively.
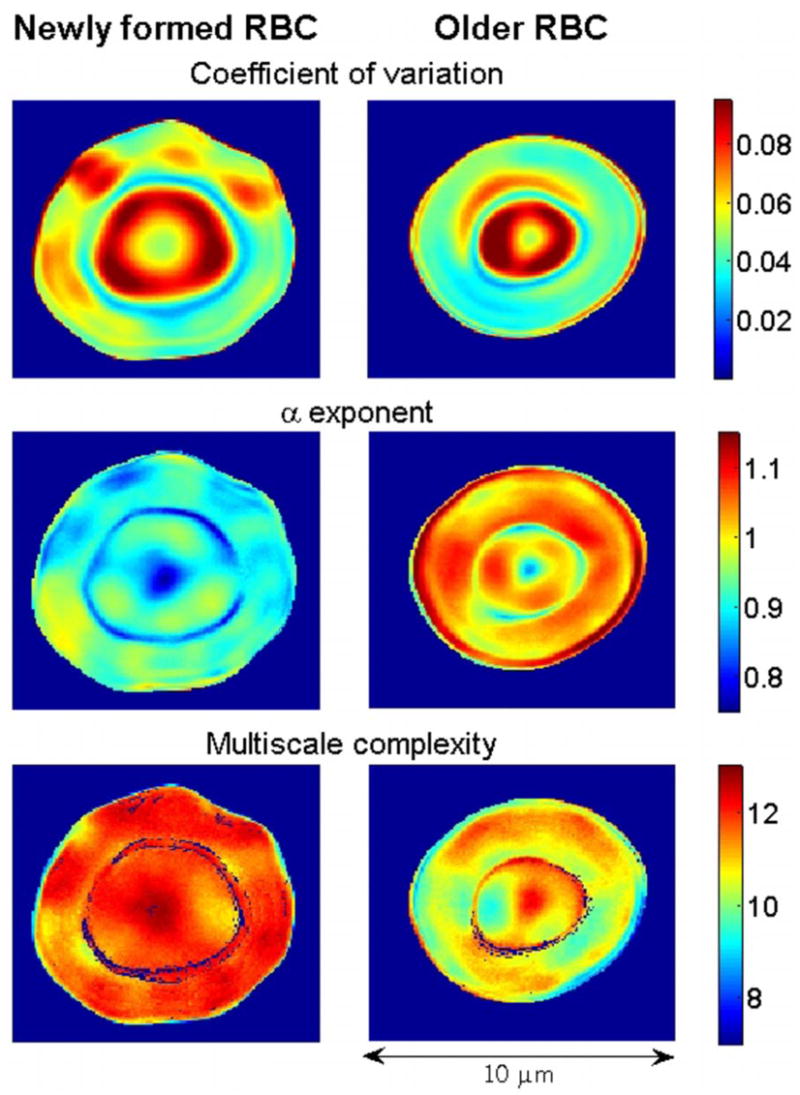
Figure 3 displays the coefficient of variation, the α exponent, and the multiscale complexity index maps obtained by analyzing the pixel time series from the new and old RBCs in Fig. 1.
FIG. 3.

(Color online) Quantitative analysis of the membrane fluctuations of a new (left panels) and an old (right panels) RBC from the same subject. Top plots show the coefficient of variation (standard deviation divided by mean value) maps. Middle plots show the α (fractal) exponent maps calculated using DFA. Bottom plots show the complexity maps calculated using the MSE method. Values of the parameters used to calculate sample entropy were m =2 and r =0.15 [11]. The complexity index was obtained by integrating the values of entropy between scales 1 and 6, inclusively. Colors code for the amplitude of the measured variable. To construct the maps, we analyzed the time series of individual pixels (such as those presented in Fig. 2). The maps of the coefficient of variation show that the membrane of new RBCs displays different domains of activity. In the online color version, red (blue) regions correspond to areas with relatively high (low) amplitude fluctuations. Old cells appear more homogeneous. The α maps show that toward the end of the RBC circulatory life, the dynamical properties of membrane fluctuations are closer to Brownian motion (α =1.5) than at the beginning. Consistent with these results, multiscale complexity maps show that the membrane dynamics of new RBCs are more complex than those of old RBCs. A blue rim, visible in some of the maps, corresponds to the interface between the thinner central (“drum”) region and the outer (“tire”) area of the cells.
The coefficient of variation maps reveal that the new cell has a more heterogeneous pattern of fluctuations than the old one. Dynamical heterogeneities (“subdomains”) have been observed on scales both shorter [4] and longer [18] than those studied here.
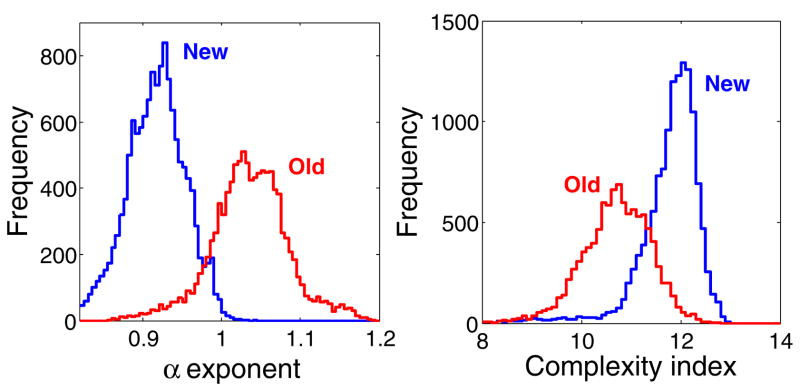
The α maps show relatively higher exponents for the older cell, indicating that with in vivo aging the dynamical properties of the flickering change toward Brownian motion. The exponents vary approximately between 0.8 and 1 for the new cell, and between 0.9 and 1.2 for the old cell (Fig. 4). These relatively tight intervals support the robustness of the findings and are not unexpected since the membrane is scaffolded to an interconnected cytoskeleton. The scaling region, which is limited by the sampling frequency and time series length, extends from approximately 0.1 to 30 s.
FIG. 4.
(Color online) Histograms of the α exponent (left panel) and of the complexity index (right panel) for the new and old RBCs used to construct the maps shown in Fig. 3.
Multiscale complexity maps (Fig. 3, lower panels) show that the time series from the new cell are more complex than those of the old cell for the range of the time scales analyzed (0.029–0.176 s). Results obtained for the overall cell population we studied (Table I) are consistent with those presented above for the two representative cells in Figs. 1–4.
TABLE I.
Dynamical measures computed for the new (N =13) and old (N =13) RBCs. αI is the percentage of pixels with scaling exponent α >1, which indicates dynamical properties closer to Brownian noise. CI is the complexity index (unitless) obtained by integrating the sample entropy values between scales 1 and 6, as described in the text. Values are given as mean±SD. The p values were calculated using the Mann-Whitney test.
| Measure | New RBCs | Old RBCs | p value |
|---|---|---|---|
| αI (%) | 2.4±3.4 | 21.8±16.6 | 2×10⁻⁴ |
| CI | 11.6±0.32 | 10.1±0.40 | 3×10⁻³ |
Both the α exponent and the CI are independent of the time series variance. Their values are determined solely by the correlations among the data points and the richness of the dynamical structures. All three maps indicate dynamical heterogeneities. However, regions with high amplitude fluctuations (red areas in the top panels of Fig. 3) are not necessarily more complex than the others. Further, no clear relationship exists between the amplitude of the fluctuations and the α exponent.
Since the noncellular background represents uncorrelated (white) noise of lower amplitude than the flickering, qualitatively similar results for the DFA and MSE analyses are obtained whether or not the background is subtracted from the time series of individual pixels [12,16]. We also verified that averaging adjacent pixels (e.g., 3×3 squares) did not qualitatively change the results.
Our results are notable for the following findings: (1) flickering of the human RBC membrane, especially in newly formed cells, shows robust long-range correlations, consistent with a scale-free pattern and a high degree of multiscale complexity; (2) dynamical complexity degrades with in vivo aging of the RBCs, evidenced by significantly lower MSE values and by a change in the α exponent toward a more Brownian pattern; (3) degradation of complexity at the cellular level with in vivo aging supports the more general concept of multiscale complexity loss with aging and disease at all levels of biologic organization [10].
From a practical viewpoint, recording and analysis of complex RBC membrane oscillations may lead to a robust high-throughput means to screen for improved blood storage conditions and interventions that yield more viable and functional RBCs for transfusion [19]. The dynamical analysis that we present here may also provide a way of assessing drug toxicity. To be determined is whether a decrease in flickering complexity with senescence has a role in RBC recognition and removal by macrophages. Possible relationships between structural and dynamical heterogeneities merit investigation. Finally, current models of membrane cytoskeletal dynamics [20] need to be tested to verify if they account for this class of correlated multiscale fluctuations and changes with in vivo aging
Acknowledgments
We gratefully acknowledge support from the NIH (Grant Nos. U01EB008577 to A.L.G. and R01AI42987 to A.N.–W.), the G. Harold and Leila Y. Mathers Charitable Foundation, the Ellison Medical Foundation, the James S. McDonnell Foundation, and DARPA.
References
- 1.Waugh RE, Narla M, Jackson CW, Mueller TJ, Suzuki J, Dale GL. Blood. 1992;79:1351. [PubMed] [Google Scholar]; Lew VL, Daw N, Etzion Z, Tiffert T, Muoma A, Vanagas L, Bookchin RM. ibid. 2007;110:1334. doi: 10.1182/blood-2006-11-057232. [DOI] [PMC free article] [PubMed] [Google Scholar]
- 2.Blowers R, Clarkson EM, Maizels M. J Physiol (London) 1951;113:228. doi: 10.1113/jphysiol.1951.sp004568. [DOI] [PMC free article] [PubMed] [Google Scholar]; Brochard F, Lennon JF. J Phys(Paris) 1975;36:1035. [Google Scholar]
- 3.Krol A, Grinfeldt MG, Levin SV, Smilgavichus AD. Eur Biophys J. 1990;19:93. doi: 10.1007/BF00185092. [DOI] [PubMed] [Google Scholar]
- 4.Popescu G, Badizadegan K, Dasari RR, Feld MS. J Biomed Opt. 2006;11:040503. doi: 10.1117/1.2221867. [DOI] [PubMed] [Google Scholar]
- 5.Levin S, Korenstein R. Biophys J. 1991;60:733. doi: 10.1016/S0006-3495(91)82104-X. [DOI] [PMC free article] [PubMed] [Google Scholar]; Tuvia S, Levin S, Bitler A, Korenstein R. J Cell Biol. 1998;141:1551. doi: 10.1083/jcb.141.7.1551. [DOI] [PMC free article] [PubMed] [Google Scholar]
- 6.Gov NS. Phys Rev E. 2007;75:011921. [Google Scholar]; Evans J, Gratzer W, Mohandas N, Parker K, Sleep J. Biophys J. 2008;94:4134. doi: 10.1529/biophysj.107.117952. [DOI] [PMC free article] [PubMed] [Google Scholar]
- 7.Morariu VV, Coza A. Fluct Noise Lett. 2001;1:L111. [Google Scholar]
- 8.Fluctuations of RBC diameters were analyzed in [7]. In pilot studies we also analyzed RBC diameter fluctuations comprising 5000 data points using both MSE and DFA methods. The results obtained did not allow distinction between new and old RBCs. We note that the dynamical properties of the flickering, including the amplitude of the vibrations, change across the membrane, which shows different domains of activity. Thus, across a given line of interest, some domains may expand while others contract, in which case the change in the diameter will fail to represent the overall membrane dynamics. The construction of the RBC dynamical maps (Fig. 3) based on the analysis of individual pixels overcomes a key limitation of the analyses based on RBC diameter fluctuations.
- 9.Buchman TG. Nature (London) 2002;420:246. doi: 10.1038/nature01260. [DOI] [PubMed] [Google Scholar]
- 10.Goldberger AL, Amaral LA, Hausdorff JM, Ivanov P, Peng CK, Stanley HE. Proc Natl Acad Sci USA. 2002;99:2466. doi: 10.1073/pnas.012579499. [DOI] [PMC free article] [PubMed] [Google Scholar]
- 11.Costa M, Goldberger AL, Peng C-K. Phys Rev Lett. 2002;89:068102. doi: 10.1103/PhysRevLett.89.068102. [DOI] [PubMed] [Google Scholar]
- 12.Costa M, Goldberger AL, Peng C-K. Phys Rev E. 2005;71:021906. doi: 10.1103/PhysRevE.71.021906. [DOI] [PubMed] [Google Scholar]
- 13.Costa M, Priplata AA, Lipsitz LA, Wu Z, Huang N, Goldberger AL, Peng C-K. Europhys Lett. 2007;77:68008. doi: 10.1209/0295-5075/77/68008. [DOI] [PMC free article] [PubMed] [Google Scholar]
- 14.Fresh RBCs (5 ml) obtained by venipuncture were diluted 1:10 in Hank’s buffer saline solution (HBSS) with Ca2+ and Mg2+, centrifuged at 1300×g for 5 min. The top layers containing white cells were removed along with the top 10% of the red cells. The washing was repeated 3 times following the same procedure. Separation of new and old (estimated age <10 and >70 days, respectively) RBCs was performed using centrifugation over Percoll [21]. To acquire time-lapse images, we used a Hamamatsu Orca AG charge-coupled device (CCD) camera interfaced to an Olympus BX62 microscope fitted with an UPlanApo 100×1.35 phase contrast objective. Cell adhesion to the glass surface was mitigated by maintaining a depth of fluid ≥10 μm under the coverslip.
- 15.Murphy DB. Fundamentals of Light Microscopy and Electronic Imaging. Wiley; New York: 2001. [Google Scholar]
- 16.Peng C-K, Havlin S, Stanley HE, Goldberger AL. Chaos. 1995;5:82. doi: 10.1063/1.166141. [DOI] [PubMed] [Google Scholar]
- 17.Richman JS, Moorman JR. Am J Physiol. 2000;278:H2039. doi: 10.1152/ajpheart.2000.278.6.H2039. [DOI] [PubMed] [Google Scholar]; Lake DE, Richman JS, Griffin MP, Moorman JR. ibid. 2002;283:R789. doi: 10.1152/ajpregu.00069.2002. [DOI] [PubMed] [Google Scholar]
- 18.Popescu G, Park YK, Dasari RR, Badizadegan K, Feld MS. Phys Rev E. 2007;76:031902. doi: 10.1103/PhysRevE.76.031902. [DOI] [PubMed] [Google Scholar]
- 19.Koch CG, Li L, Sessler DI, Figueroa P, Hoeltge GA, Mihaljevic T, Blackstone EH. N Engl J Med. 2008;358:1229. doi: 10.1056/NEJMoa070403. [DOI] [PubMed] [Google Scholar]
- 20.Vera C, Skelton R, Bossens F, Sung LA. Ann Biomed Eng. 2005;33:1387. doi: 10.1007/s10439-005-4698-y. [DOI] [PubMed] [Google Scholar]; Sultan C, Stamenovic D, Ingber DE. ibid. 2004;32:520. doi: 10.1023/b:abme.0000019171.26711.37. [DOI] [PubMed] [Google Scholar]
- 21.Rennie CM, Thompson S, Parker AC, Maddy A. Clin Chim Acta. 1979;98:119. doi: 10.1016/0009-8981(79)90172-4. [DOI] [PubMed] [Google Scholar]


