Abstract
Recently, we developed a model for hepatitis C virus (HCV) infection that explicitly includes proliferation of infected and uninfected hepatocytes. The model predictions agree with a large body of experimental observations on the kinetics of HCV RNA change during acute infection, under antiviral therapy, and after the cessation of therapy. Here we mathematically analyze and characterize both the steady state and dynamical behavior of this model. The analyses presented here are important not only for HCV infection but should also be relevant for modeling other infections with hepatotropic viruses, such as hepatitis B virus.
Keywords: HCV, viral dynamics, bifurcation analysis
1. Introduction
Approximately 200 million people worldwide [38] are persistently infected with the hepatitis C virus (HCV) and are at risk of developing chronic liver disease, cirrhosis and hepatocellular carcinoma. HCV infection therefore represents a significant global public health problem. HCV establishes chronic hepatitis in 60% – 80% of infected adults [46]. A vaccine against infection with HCV does not exist and standard treatment with interferon-α and ribavirin has produced sustained virological response rates of approximately 50%, with no effective alternative treatment for non-responders to this treatment protocol [13, 30].
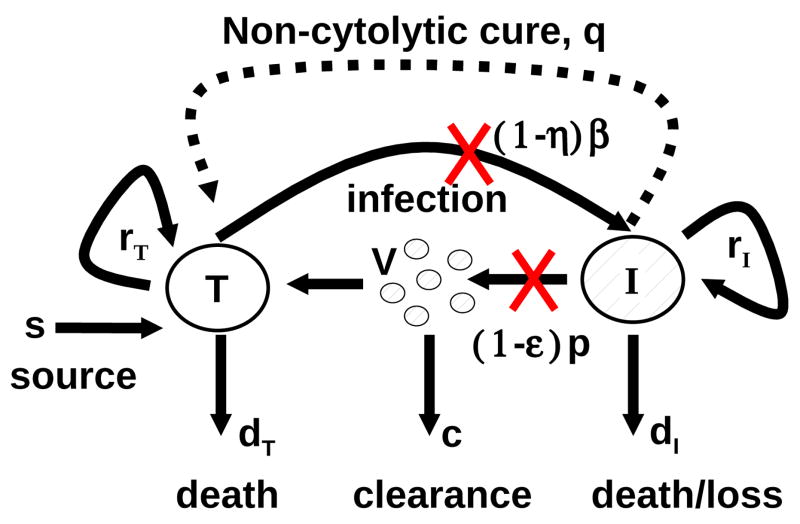
A model of human immunodeficiency virus infection [40, 52] was adapted by Neumann et al. [37] to study the kinetics of chronic HCV infection during treatment. Since then viral kinetics modeling has played an important role in the analysis of HCV RNA decay during antiviral therapy (see Perelson [41], Perelson et al. [42]). The original Neumann et al. model for HCV infection [37] included three differential equations representing the populations of target cells, productively-infected cells, and virus (Figure 1.1). A simplified version of the model, which assumes a constant population of target cells, was used to estimate the rates of viral clearance and infected cell loss by fitting to the model the decline of HCV RNA observed in patients during the first 14 days of therapy [37]. However, this simplified version of the model is not able to explain some observed HCV RNA kinetic profiles under treatment [4]. To model complex HCV kinetics, the assumption of a constant level of target cells needs to be relaxed and requires one to model as correctly as possible the dynamics of the target cell population. Since it has been suggested that hepatocytes, the major cell type in the liver, are also the major producers of HCV [10, 3, 43], we assume here that the target cells of the model are hepatocytes.
Fig. 1.1.
Schematic representation of HCV infection models. T and I represent target and infected cells, respectively, and V represents free virus. The parameters shown in the figure are defined in the text. The original model of Neumann et al. [37] assumed that there is no proliferation of target and infected cells (i.e., rT = rI = 0) and no spontaneous cure (i.e., q = 0). The extended model of Dahari et al. [6], which was used for predicting complex HCV kinetics under therapy, includes target and infected cell proliferation without cure (rT, rI > 0 and q = 0). A model including both proliferation and the spontaneous cure of infected cells(dashed line; q > 0) was used to explain the kinetics of HCV in primary infection in chimpanzees [5].
The liver is an organ that regenerates, and due to homeostatic mechanisms, any loss of hepatocytes would be compensated for by the proliferation of existing hepatocytes [12, 32]. However, besides replication of existing hepatocytes, another mechanism of liver cell generation is present (termed here immigration), i.e., differentiation of liver progenitor cells or bone marrow cells [12].
In prior work, we have shown that including proliferation of both target cells and infected cells increases the ability of the model to explain experimental data [4, 6]. Because HCV infection is generally thought to be non-cytopathic, i.e., infection per se does not kill a cell [31], proliferation of infected cells has been included in the model. Studying the effects of varying the rate of infected cell proliferation from zero (no proliferation) to rates in excess of the rate proliferation of uninfected cells [34], as might occur by an oncogenic effect, is one of the goals of this work.
HCV is an RNA virus that replicates in the cytoplasm of an infected cell [25]. Due to the action of endogenous nucleases or microRNAs it is in principle possible for a cell to clear viral RNA [2, 39]. Some of our prior modeling of acute HCV infection in chimpanzees required the inclusion of this type of “cure” of infected cells in order to explain the kinetics of HCV clearance without a massive loss of liver cells that would have lead to the animals’ death [5]. Thus, the effects of “cure” of infected cells is also studied in the analysis provided below.
During antiviral therapy for HCV infection patients may exhibit a flat partial response or a biphasic decline in HCV RNA (Figure 2.1: left and middle). In addition, a triphasic pattern of HCV RNA decline (Figure 2.1: right) has been observed in some treated patients [19]. In these patients, HCV RNA initially falls very rapidly, 1–2 orders of magnitude during the first day or two of therapy. Then HCV RNA decline ceases and a “shoulder phase” that can last from days to many weeks is observed. This shoulder phase can persist, in which case it has been called a flat second phase, or it can be followed by a renewed phase of HCV RNA decline, in this case the pattern has been called triphasic [4, 6]. Another of the goals of this paper is to understand the origin of the triphasic response and to compute from the model the length of the shoulder phase as a function of model parameters. As the length of the shoulder phase approaches zero, a triphasic response transforms into a biphasic response, and thus studying triphasic responses provides a general framework for understanding treatment response kinetics.
Fig. 2.1.
Three example plots of observed changes in viral load (X) following the start of treatment, together with numerical solutions to System (2.1) (solid line). The initial condition of each numerical solutions is the chronic-infection steady-state. In some cases, there is a flat partial response to treatment (left), where viral load shows an immediate drop, but then remains unchanged over time. In some cases, there is a biphasic response (middle), with a rapid initial drop and a slower asymptotic clearance. In some cases, there is a triphasic response, with a rapid initial drop, an intermediate shoulder phase during which there is little change, and then an asymptotic clearance phase. The initial rapid decline in virus load is the synchronization to the new quasi-steady state, following the start of treatment. Afterward, virus load closely tracks the number of infected cells (right). Treatment efficacies are ε = 0.98,η = 0 (left), ε = 0.9, η = 0 (middle), and ε = 0.996,η = 0 (right). Other parameter values are shown in Table 2.1.
In order to accomplish our various goals, we first describe the model and its parameters. Then we study the model’s steady states and their stability. Using a perturbation analysis approach we show how the shoulder phase arises and provide an approximate formula from which one can calculate its length.
2. Model
The model proposed by Dahari et al. [6, 4] expands on the standard HCV viral-dynamic model [37] of infection and clearance by incorporating density-dependent proliferation and death (Figure 1.1). Uninfected hepatocytes, T, are infected at a rate β per free virus per hepatocyte. Infected cells, I, produce free virus at rate p per cell but also die with rate dI. Free virus is cleared at rate c by immune and other degradation processes. Besides infection processes, hepatocyte numbers are influenced by homeostatic processes. Uninfected hepatocytes die at rate dT. Both infected and Uninfected hepatocytes proliferate logistically with maximum rates rI and rT, respectively, as long as the total number of hepatocytes is less than Tmax. Besides proliferation, uninfected hepatocytes may increase in number through immigration or differentiation of hepatocyte precursors that develop into hepatocytes at constitutive rate ŝ or by spontaneous cure of infected hepatocytes through a noncytolytic process at rate q̂. Treatment with antiviral drugs reduces the infection rate by a fraction η and the viral production rate by a fraction ε. The corresponding system of differential equations is
| (2.1a) |
| (2.1b) |
| (2.1c) |
where the time t̂ is measured in days. Table 2.1 shows estimated ranges for the parameters.
Table 2.1.
Estimated parameter ranges for hepatitis C when modelled with System (2.1). The columns labelled left, middle, and right give the parameter values for fitting System (2.1) to the data for the respective plots in Figure 2.1. The rT, Tmax, and dT parameters are not independently identifiable, so common practice is to fix dT prior to fitting.
| Symbol | Minimum | Maximum | Units | left | middle | right | Reference |
|---|---|---|---|---|---|---|---|
| β | 10−8 | 10−8 | Virus−1 ml day−1 | 1.4 ×10⁻⁶ | 9.0 × 10⁻⁸ | 2.8 × 10⁻⁸ | [5] |
| Tmax | 4 × 10⁶ | 1.3 × 10⁷ | cells ml−1 | 5 × 10⁶ | 5 × 10⁶ | 1.2 × 10⁷ | [27, 49] |
| p | 0.1 | 44 | virus cell−1 day−1 | 28.7 | 10.9 | 13.2 | [5] |
| ŝ | 1 | 1.8 × 10⁵ | cells ml−1 day−1 | 1 | 1 | 1 | [50] |
| q̂ | 0 | 1 | day−1 | 0 | 0 | 0 | [5] |
| c | 0.8 | 22 | day−1 | 6.0 | 5.8 | 5.4 | [45] |
| dT | 10−3 | 1.4 × 10⁻² | day−1 | 1.2 × 10⁻² | 1.2 × 10⁻² | 1.2 × 10⁻² | [26, 28] |
| dI | 10−3 | 0.5 | day−1 | 0.36 | 0.48 | 0.13 | [45] |
| rT | 2× 10⁻³ | 3.4 | day−1 | 3.0 | 0.70 | 1.1 | [5] |
| rI | Unknown | Unknown | day−1 | .97 | 0.112 | 0.26 |
System (2.1) has a three-dimensional phase-space and a twelve-dimensional parameter space, so despite the relative simplicity, the full dynamics are difficult to classify. Fortunately, there are some natural simplifications. The range of rates of viral clearance shown in Table 2.1 is significantly faster than the other time-scale parameters. In numerical simulations (Figure 2.1), after an initial transient the viral dynamics closely track the dynamics of infected cells. This suggests that viral dynamics can be decomposed into two time scales: a fast time scale starting at t̂0 where the number of infected hepatocytes, I, is relatively constant and
| (2.2) |
and a slow time scale where
| (2.3) |
For patients in steady state before treatment, as is typically the case, I (t̂0) = c
 (t̂0)/p, allowing one to simply Equation (2.2) to
| (2.4) |
On times scales longer than 1/c, then, the dynamics of System (2.1) can be approximated by a system of two equations. If we now introduce the dimensionless time t = (rT − dT)t̂, the dimensionless state variables
| (2.5) |
and the dimensionless parameters
| (2.6) |
then under the quasi-steady state approximation, System (2.1) is equivalent to the dimensionless system
| (2.7a) |
| (2.7b) |
Note that a fundamental assumption in the transformation to System (2.7) is that rT > dT, which we expect because of the hepatocyte population’s ability to support itself and to regenerate itself after injury.
Immigration of new hepatocytes is believed to be slow (< 1% per day; Table 1) relative to the total number of hepatocytes (i.e., s ≪ 1). Spontaneous cure from HCV has not yet been directly observed. It has been suggested to occur based on the kinetics of HCV clearance and liver damage in humans [51] and in chimpanzees [5]. Therefore, in a first analysis, we assume that s = q = 0. Later, we reintroduce these parameters and examine their effects via a perturbation analysis. Dropping the s and q terms, System (2.7) simplifies to
| (2.8a) |
| (2.8b) |
Most of the parameter ranges from Table 2.1 are captured by allowing b ∈ [10 −2,103] and d ∈ [10−3,102]. rI has not yet been studied experimentally, and thus we can not bound r beyond the trivial statement that r ≥ 0.
Gómez-Acevedo and Li [14] have previously studied some of the properties of System (2.8) in the context of human T-cell lymphotropic virus type I. It is a simple model with only three independent parameters and dynamics that can be completely analyzed using phase-plane analysis and algebraic methods while still encapsulating the fundamental concepts of System (2.1). System (2.8) diverges from common viral dynamics models in the homeostasis parameter r. When r = 0, System (2.8) is naturally interpreted as an epidemic model, a viral infection model, or a predator-prey model. When the epidemic model is extended to include logistic homeostasis with r> 0, the infected cells can also proliferate independent of x but experience additional density-dependent mortality as a function of the total population size x+y. This paper explores the consequences of this homeostasis. We will first study System (2.7) and System (2.8) during acute infection. We will then study the response of these systems to treatment.
3. Dynamics without treatment (θ = 0)
When hepatitis C virus first infects a person, the ensuing dynamics depend on the relative parameter values. Since newly infected individuals do not know that they are infected, we assume there is initially no treatment (θ = 0). At first glance, we might expect several different scenarios to ensue, following exposure: infection may fade out without becoming established, infection may spread with limited success and infect only part of the liver, or infection may spread rapidly and infect the whole liver. To understand when the dynamics of System (2.7) under acute infection correspond to each of these situations, it is helpful to walk through the bifurcation structure of System (2.8).
3.1. Without Immigration or Spontaneous Cure
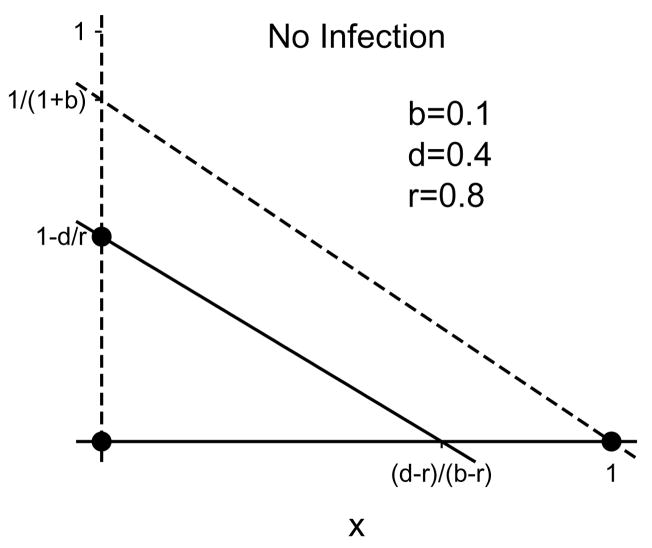
When there is no immigration (s = 0) or spontaneous cure (q = 0), the dynamics are described by System (2.8). System (2.8) is a variant of the Lotka-Volterra equations studied extensively in ecology [21]. The ẋ-nullclines are x = 0 and y = (1 − x)/(1 + b). The ẏ-nullclines are y = 0 and y = 1 − d/r − (1 − b/r)x (Figure 3.1). Up to four stationary solutions to System (2.8) can be found at the intersections of the ẋ and ẏ nullclines. They are
Fig. 3.1.
Example nullclines for System (2.8) when the disease-free equilibrium is globally attracting. The liver-free (x = y = 0), disease-free (x = 1, y = 0), and total-infection (x = 0, y = 1 − d/r) stationary solutions are marked with dots. The solid lines are the ẏ-nullclines, the dotted lines are the ẋ-nullclines. The partial-infection stationary solution is not present for these parameter values.
| (3.1) |
respectively, the liver-free solution, the disease-free solution, the total-infection solution, and the partial-infection solution. The locations and stability conditions for the stationary solutions are summarized in Table 3.1.
Table 3.1.
Stationary solutions for System (2.8), and their characteristics
| Stationary point | Location | Bifurcation conditions | Local stability condition | |
|---|---|---|---|---|
| Liver-free | (0,0) | r = d | Never stable | |
| Disease-free | (1,0) | b = d | b < d | |
| Total-infection | (0, 1 − d/r) | r = d + d/b, r = d | r > d + d/b | |
| Partial-infection |
|
r = d + d/b, b = d | rb/(1 +b) < d < b |
The bifurcations and stability of these four stationary solutions depends on the parameter values in ways summarized in Table 3.1. System (2.8)’s Jacobian is
| (3.2) |
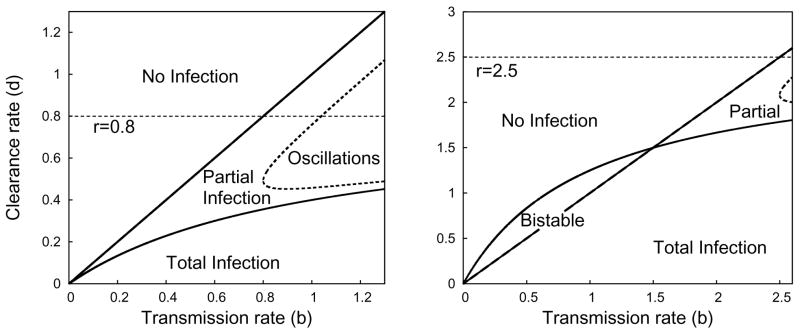
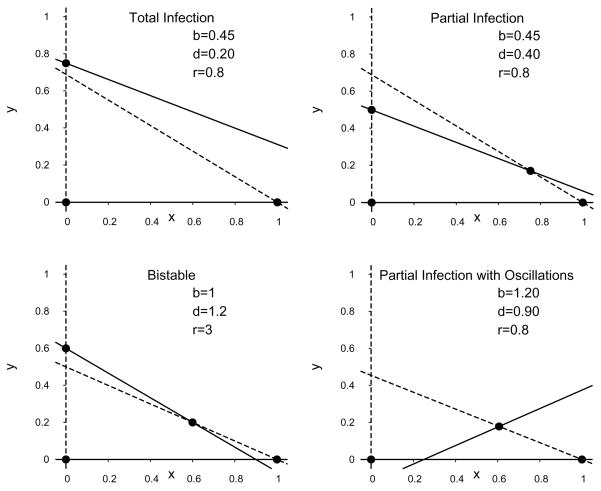
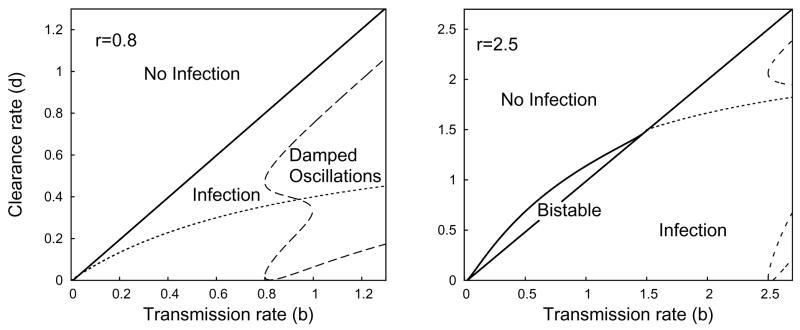
The classification of the parameter space is summarized in Figure 3.2, with examples of each region’s nullclines given in Figure 3.3. Before treatment, the reproductive number of infection
Fig. 3.2.
Plot representing the parameter regions for asymptotic dynamics of System (2.8) when r = 0.8 (left) or r = 2.5 (right). Within the region marked partial infection, the dotted line is the boundary between monotone convergence and oscillatory convergence to the partial infection steady state.
Fig. 3.3.
Example phase planes of System (2.8) for distinct parameter regions. The dashed lines are the ẋ-nullclines and the solid lines are the ẏ-nullclines. The dots represent stationary solutions.
| (3.3) |
at the disease-free equilibrium (1,0). In order for HCV to infect the liver,  must be greater than 1, indicating that on average, an infected hepatocyte causes more than one uninfected cell to become infected. The eigenvalues at the disease-free equilibrium are λ = −1, corresponding to the eigenvector [1,0], and λ = b − d, corresponding to the eigenvector [−1 − b, 1 + b − d]. If
  < 1, the disease-free solution (1,0) is locally attracting. If
  > 1, HCV infects new cells faster than infected cells die, and the asymptotic dynamics may correspond to either partial or total infection of the liver.
The liver-free stationary solution (0,0) is always unstable, switching between a saddle point when infected cells die quickly (r < d) and an unstable node when infected cells die slowly (d < r). If the proliferation rate is slower than the death rate (r < d), then HCV can never totally infect the liver. There is a transcritical bifurcation at d = r, and the total-infection stationary solution (0, 1 − d/r) is only a feasible when the proliferation rate of infected cells is greater than the excess death rate of infected cells (Figure 3.2). From the Jacobian, we see that if d + d/b < r (equivalently, d < rb/(1 + b)), total infection is locally stable, and from the general theory of Lotka-Volterra systems, it is globally stable provided . This includes all cases where d < 0.
The partial-infection stationary solution is present whenever d lies between b and . The local stability of the partially-infected stationary solution can be determined from the characteristic polynomial
| (3.4) |
where λ is an eigenvalue. If , the constant term of the characteristic polynomial at the partial-infection stationary solution is negative, implying (by Decartes’ rule of sign) that there is a single positive root and the partial-infection steady-state is a saddle point. In this situation, we can show that both the disease-free and the total-infection stationary solutions are locally stable. As first shown in Gómez-Acevedo and Li [14], the system is bistable and the asymptotic dynamics will depend in the initial conditions. The constraint r < 1 is sufficient to preclude bistability.
When , the coefficients d/b and
| (3.5) |
of the characteristic polynomial are both positive. From the Routh-Hurwitz conditions [35], it follows immediately that the partial-infection stationary solution is locally stable. From prior work on Lotka-Volterra equations [20], we know that it is also globally stable.
Convergence to the partial-infection stationary solution can be oscillatory if the eigenvalues are complex or monotone if the eigenvalues are real (Figure 3.4). Calculation of the discriminant shows that the convergence is oscillatory whenever
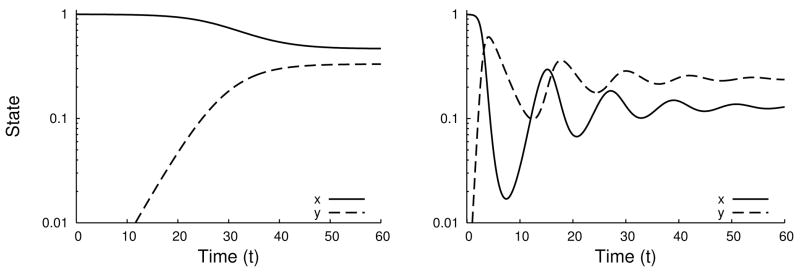
Fig. 3.4.
Time series for System (2.7) of monotone (left, r = 0.6, b = 0.6) and oscillatory (right, r = 0.1, b = 2.6) convergence to the partial infection stationary solution when d = 0.4.
| (3.6) |
This inequality is not easy to interpret by inspection, but it is quadratic in d, so it is easy to handle numerically. The boundaries of the subset of parameter space where convergence is oscillatory asymptotically converge to d(b) = r and d(b) = b as b diverges to ∞. When convergence is oscillatory, the period of oscillations around the stationary solution is
| (3.7) |
A sufficient condition for monotone convergence to the partial-infection stationary solution instead of oscillations is b < r, in which case the convergence rate is governed by the slowest eigenvalue,
| (3.8) |
3.2. With Immigration and Spontaneous Cure
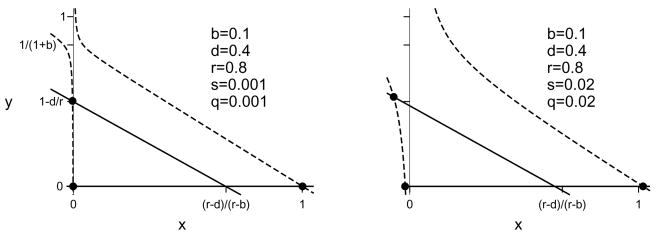
Including immigration (s > 0) and spontaneous clearance (q > 0) in System (2.7) changes the dynamics of System (2.8) in small but important ways (Figure 3.5). The two ẏ-nullclines are y = 0 and
Fig. 3.5.
Example nullclines for System (2.7) when the disease-free equilibrium is globally attracting for immigration and spontaneous clearance rates s = q = 0.001 (left) or s = q = 0.02 (right). The liver-free, disease-free, and total-infection stationary solutions are marked with dots. The liver-free and total-infection stationary solutions have negative x coordinates when the immigration and spontaneous clearance rates are positive. The solid lines are the ẏ-nullclines, the dotted lines are the ẋ-nullclines. The partial-infection stationary solution is not present for these parameter values.
| (3.9) |
Spontaneous clearance moves the nullcline given by Eq. (3.9) slightly to the left, but the ẏ-nullclines are basically the same as those of System (2.8). The change in the ẋ-nullclines is more pronounced. The only ẋ-nullcline in System (2.7) is
| (3.10) |
The ẋ-nullclines have changed from a pair of intersecting lines in System (2.8) to a hyperbola in System (2.7). The shape of the hyperbola is still the same as those of System (2.8) except near the intersection point (0, 1 − d/r). The hyperbola is also shifted slightly down and to the right compared to System (2.8) (Figure 3.5). For large positive and negative x, the nullcline is approximately equal to (1 − x)/(1 + b). There is a vertical asymptote at x = q/(1 + b). The nullcline is positive just to the right of this asymptote and negative just to it’s left. The ẋ-nullcline’s unique y-intercept is y = − s/q. This implies that there can be no biologically feasible stationary solutions with x ≤ q/(1 + b), i.e., total hepatocyte loss is no longer a stationary solution because the model now includes a perpetual source of new hepatocytes. This change also means that there is no longer a bifurcation between partial and total infection (Figure 3.6).
Fig. 3.6.
Plot representing the parameter regions for asymptotic dynamics of System (2.7) with s = 0.01, q = 0 when r = 0.8 (left) or r = 2.5 (right). Compare to Figure 3.1. The dashed line represents the boundary of the parameter region where convergence to the steady state exhibits damped oscillations. The dotted line represents the bifurcation boundary between partial and total infection when s = q = 0. However, there is no formal bifurcation between partial and total infection if s or q is positive because of the structural instability of the transcritical bifurcation in System (2.8).
Two stationary solutions to System (2.7) solve
| (3.11) |
The exact solutions are
| (3.12) |
When s is very small, the solutions of Eq. (3.11) are approximately
| (3.13) |
The solution with the negative square root can never appear biologically because it predicts a negative number of uninfected hepatocytes.
The other two stationary solutions of System (2.7) solve
| (3.14a) |
| (3.14b) |
The solutions can be expressed in terms of radicals, but greater intuition of the effects of s and q relative to the stationary solutions of System (2.8) can be gained though perturbation analysis (Appendix A). When d < min{b, rb/(1+b)}, the one biologically meaningful solution to Eq. (3.14) is
| (3.15) |
corresponding to the total-infection stationary solution of System (2.8), but with a small number of uninfected cells sustained by the sources s and q. The o(s, q) terms in Eq. (3.16) hide higher order effects in s and q that vanish quadratically or faster as s and q approach zero. When rb/(1 + b) < d < b,
| (3.16a) |
| (3.16b) |
is an approximate solution corresponding to the partial-infection stationary solution of System (2.8). The other solution of 3.14 is negative.
When b < d < rb/(1 + b), both solutions to Eq. (3.14) are positive. Again, this can only occur when r > 1, i.e., when infected cells proliferate faster than uninfected ones. Approximate locations are given by Eq. (3.15) and Eq. (3.16). The bifurcation between zero and two roots is a saddle-node bifurcation where the root with smaller x value is a stable node and the root with larger x value is a saddle. The calculation of the exact condition for bistability when s or q is positive is algebraically opaque, requiring the solution of a pair of polynomials that are quadratic in d and a test to distinguish bistability outside the positive quadrant from bistability inside the positive quadrant. The net effect in System (2.7) of this complexity is a minor perturbation of that found for System (2.8) (compare Figures 3.2 and Figure 3.6). Immigration and spontaneous clearance shrink the bistable region of parameter space slightly and shift it so that it occurs for slightly smaller values of d.
The local stability of the stationary solutions to System (2.7) is predicted by the Jacobian matrix
| (3.17) |
The disease-free stationary solution loses stability through a transcritical bifurcation that occurs at det J = 0. Substituting y = 0 into J, det J = 0 if x = 1/2 or (b − r)x = d + q − r. Using the approximation x = 1 + s + o(s), we can show that the disease-free stationary solution is stable when
| (3.18) |
Local stability of the other stationary solutions to System (2.7) can also be approximated analytically, but resulting formulas are difficult to interpret.
4. Treatment Effects
Treatment effects appear in System (2.7) and System (2.8) only through a multiplicative factor (1 − θ) reducing the transmission rate b, where θ is the dimensionless treatment efficacy. Thus, the stationary solution structure of System (2.7) and System (2.8) under treatment is summarized by replacing the x-axis labels in Figures 3.2 and 3.6 by (1 − θ)b. Taking b to be constant, the outcome of drug treatment depends on the drug efficacy θ (Table 4.1, Figure 4.1). There is a critical efficacy
Table 4.1.
Classification of the dynamics of System (2.7) for b > d, 0 < S ≪ 1, 0 < q ≪ 1. These classifications are only approximate. Parameter values that fall near the boundaries of any of these regions may have dynamics that fit multiple classifications. See Figures 4.1 and 4.2 for graphical depictions and example time series.
| Pre-treatment | Pre-treatment state | Treatment | Treatment dynamics | |
|---|---|---|---|---|
| r < d | Partial infection | |||
| θ < θc | reduced infection | |||
| θ > θc | clearance, no treatment delay | |||
|
|
Partial infection | |||
| θ < θc | reduced infection | |||
| θ > θc | clearance, weak treatment delay | |||
|
|
Near total infection | |||
| θ < θp | no effect | |||
| θp < θ < θc | reduced infection | |||
| θc < θ | clearance, strong treatment delay | |||
| d + 1 < r | Near total infection | |||
| θ < θp | no effect | |||
| θp < θ < θc | bistable, no effect | |||
| θc < θ | clearance, strong treatment delay |
Fig. 4.1.
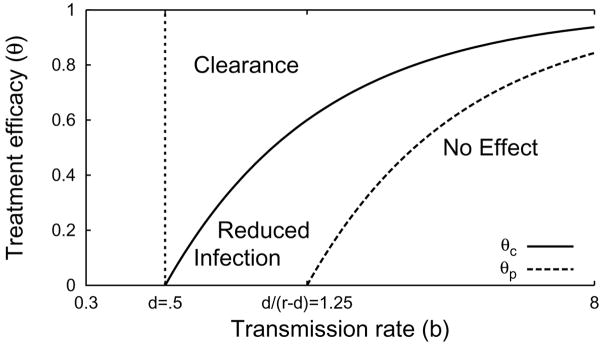
The treatment efficacy θ leading to specific dynamics for various transmission rates b, given d = 0.5, r = 0.9, s = 0 and q = 0. Treatment efficacies below θp have little or no effect on the number of infected hepatocytes. Treatment efficacies between θc and θp reduce the number of infected hepatocytes, but are not sufficient for complete clearance. Treatment efficacies greater than θc lead to complete clearance of infection.
| (4.1) |
such that θ > θc implies treatment will clear the infection. When r < d+1, the critical efficacy θc corresponds to reducing the reproductive number to 1. When r > d+1, the treatment efficacy must be large enough not only to reduce the reproductive number below 1, but also to overcome the local stability of the total-infection stationary solution in the region of bistability.
Below the critical efficacy θc, there is also a fuzzy partial-efficacy threshold
| (4.2) |
The partial-efficacy threshold was derived using the approximate disease-free stability condition (1 − θ)b(1 + s) < d + q + rs and the approximate bifurcation condition d = r(1 − θ)b/(1 + (1 − θ)b) between partial and total infection. These conditions where chosen to correspond approximately to those of System (2.8).
A fuzzy threshold is a weaker form of the standard threshold conditions used in bifurcation analysis. Thresholds like the critical efficacy threshold θc indicate the location of a bifurcation or discontinuity of some form. On a given side of the threshold, changes in parameters can be interpreted as continuous, smooth changes in the system. On opposite sides of the threshold, dynamics are qualitatively distinct, and parameter changes that cross the threshold typically cause non-smooth and discontinuous changes in the system. But in many systems, important differences in dynamics are not separated by a discontinuity; the system can change in a continuous, smooth manner between qualitatively different extremes. Since there is no discontinuity in the system, we can not define an exact threshold. As a next-best recourse, we define a fuzzy threshold that in some sense separates regions of parameter-space with different dynamics. Unlike standard thresholds, which are uniquely defined by their discontinuity, fuzzy thresholds are not uniquely defined; there are infinitely many fuzzy thresholds that distinguish well-separated points in parameter-space, and points in the neighborhood of one fuzzy threshold may be classified in any variety of ways by other fuzzy thresholds. Still, fuzzy thresholds can serve as useful rules of thumb. θp is a fuzzy threshold because the transition between total-infection and partial-infection in System (2.7) does not generally coincide with a bifurcation.
Treatment efficacies between θp and θc can significantly reduce the fraction of hepatocytes that are infected but will not clear infection completely. Treatment efficacies θ < θp do not significantly reduce the fraction of hepatocytes infected (Figure 4.1).
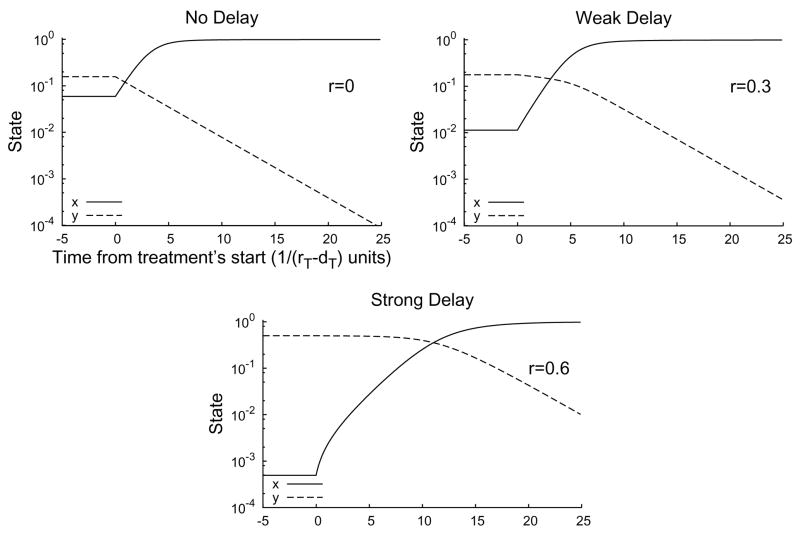
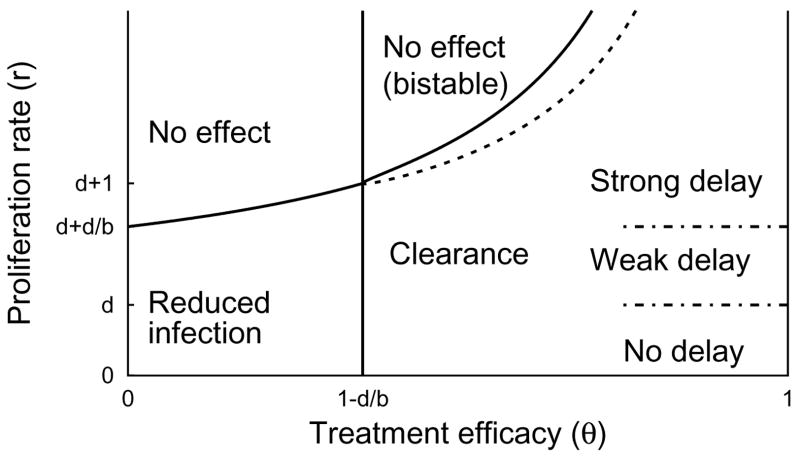
An important aspect of treatment response is the dynamics of the transition from the pre-treatment state to the post-treatment stationary solution. When treatment is only partially effective (θp < θ < θc), the dynamics converge to a new partial-infection stationary solution, and this convergence can be monotone, can overshoot, and can show damped oscillations, depending on the parameter values. When treatment is above the critical efficacy (θc < θ), infection asymptotically decays at rate (1 − θ)b − d. However, in situations with near-total infection, (r > d + d/b), there can be a significant delay before the number of infected hepatocytes begins to decay (Figure 4.2). This delay may be a “strong” delay, where the number of infected hepatocytes does not change for an extended period of time after the start of treatment before decaying exponentially, or a “weak” delay, where the number of number of infected hepatocytes decays slowly at the start of treatment but then accelerates (Figure 4.2). The role of the relative proliferation rate r in treatment response is shown in Figure 4.3. These strong and weak delays are important because they may correspond to the “shoulder phase” observed in HCV viral load time series after the start of treatment [6].
Fig. 4.2.
Time series for System (2.7) with treatment starting at t = 0 for r = 0 (top, left), r = 0.3 (top, right), and r = 0.6 (bottom). The initial condition is the pre-treatment stationary solution. When the proliferation rate r is small (top, left), there is no delay; the number of infected cells (y) decays at a constant rate from the start of treatment. For intermediate proliferation rates (top, right), there may is a weak delay between the start of treatment and the asymptotic clearance of infection. When r is large (bottom), there is a strong delay (about 10 units, here) before the number of uninfected cells (x) reaches equality with the number of infected cells and the number decay rate of infected cells accelerates to its exponential asymptotic rate. Parameter values s = 0.001, q = 0, d = 0.3, b = 5, θ = 1.
Fig. 4.3.
Classification of treatment-response as a function of θ and r when b > d. q = 0, s = 0.001, b = 0.9, d = 0.5. Regions are labelled according to the dynamics observed under treatment, assuming the dynamics were at equilibrium prior to treatment. In the bistable region, both the disease-free and total-infection stationary solutions are locally stable under treatment. The boundaries between the regions of strong delay, weak delay, and no delay are fuzzy, in the case of θ = 1, and the boundaries are even fuzzier for θ < 1. In the sliver between the dotted line and the solid line defining the bistable region our approximation to td in Eq. (4.8) fails because there is no nearby stationary solution to use for u* (see Fig. 4.4). In this sliver, the approximation method described in Appendix C can be used.
Why does this delay occur? Suppose that treatment is highly effective (θ > θc). Biologically, treatment shifts the competitive advantage away from infected to uninfected hepatocytes, but there are initially too few uninfected hepatocytes to displace a significant portion of the infected hepatocytes. Infected hepatocytes only begin to decline when the number of uninfected hepatocytes reaches the same order of magnitude.
The rate of recovery depends on some details of the phase-plane geometry. Let’s consider how the phase plane changes as we increase the efficacy θ when r > d + 1. While θ < θp the total-infection stationary solution is attracting and the disease-free stationary solution is a saddle point. As θ increases to between θp and θc, the disease-free stationary solution becomes locally stable, but the total-infection stationary solution is still stable and attracts orbits from the pre-treatment initial condition. As θ is increased just beyond θ + c, the total-infection stationary solution collides in a saddle-node bifurcation with the unstable partial-infection stationary solution and both solutions disappear. Now, infection will be cleared by treatment. The rate of clearance is controlled by a bottleneck left in the region of the phase-plane where the saddle-node bifurcation occurred (see Appendix C). As the efficacy θ increases further, the bottleneck weakens, but another saddle-node bifurcation occurs in the second quadrant of the phase-plane. The saddle-node bifurcation introduces a new saddle-point stationary solution close to the pre-treatment initial condition. As the bottleneck from the first saddle-node bifurcation is relaxed, the unstable manifold of the new saddle point becomes the primary factor controlling the recovery rate of uninfected hepatocytes.
The distinctions between a strong delay, a weak delay, and no delay (Figures 4.2 and 4.3) are empirically determined ones. When treatment completely prevents new infections (θ = 1), we observe in numerical solutions strong delays when r > d+ d/b, weak delays when d + d/b > r > d, but no delays when r < d. However, these are only observational distinctions, and the classification of delays is less clear for less efficient treatments.
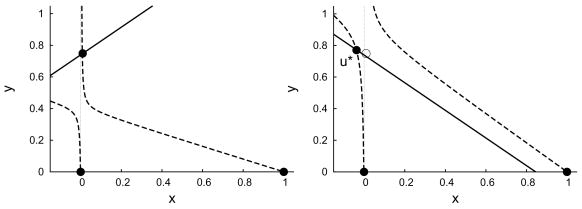
The existence of a treatment delay is most clean-cut in cases like that of Figure 4.4, where almost all hepatocytes are infected before treatment and treatment is highly effective. We will now describe a method for approximating the dynamics at the start of treatment and determining the delay, td, before the number of infected hepatocytes begins to decline in these cases. We can use the linearization of System (2.7) near the new unstable stationary solution u* = (x*, y*) (Figure 4.4) given by the solutions of
Fig. 4.4.
Nullclines of System (2.7) when s = 0.001, q = 0.008, r = 0.8, d = 0.2, and b = 1.5 with before treatment, θ = 0 (left) and at the start of treatment, θ = 14/15 (right). The solid dots represent stationary solutions. The open dot in the right-hand plot corresponds to the attracting stationary solution in the left-hand plot and is the initial condition for the dynamics when treatment begins. The adjacent solid dot u* is the unstable stationary solution around which we linearize to approximate the treatment delay.
| (4.3a) |
| (4.3b) |
that is nearest to the positive quadrant. In the neighborhood of u*, the solution of System (2.7) is approximately given by
| (4.4) |
where u(0) is the pre-treatment equilibrium, and J(u*) is the Jacobian matrix at u*. The matrix exponential can be conveniently expressed in terms of the Lagrange interpolation formula [33]
| (4.5) |
where zn is the n-th eigenvalue and I is the identity matrix. When s and q are small, u* = (x*,y*)≈(0,1−d/r) (see Appendix A), so the Jacobian
| (4.6) |
The eigenvalues are approximately
| (4.7) |
Exact formulas can be obtained using the radical expressions for u* = (x*, y*).
As the final part of the process of determining the treatment delay td, we have to identify a condition that marks the end of a treatment delay and agrees with our intuitive observations. There are many possible choices (see Appendix B for a discussion). We found that the condition x(td) = y(td), corresponding to the point where the number of uninfected cells equals the number of infected cells, was simple, convenient, and robust for calculating td over the strong-delay parameter range. Solving for td, we find
| (4.8) |
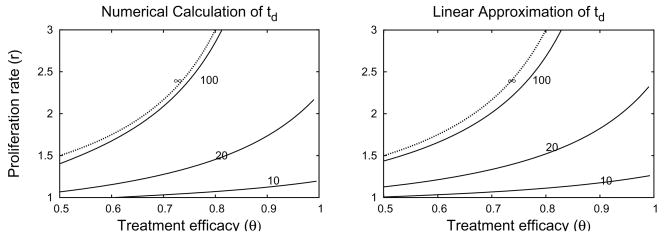
The dimensional delay time is days. A side-by-side comparison of Eq. (4.8) to the actual value calculated by numerical solution of System (2.7) is shown in Figure 4.5. The figure shows that our approximation gives results that are very similar to the numerical solutions.
Fig. 4.5.
Side-by-side comparison of contour plots of the treatment td using numerical solution of system (2.7) (left) and the Formula (4.8) derived from the linear approximation (right). The approximate bound on bistability, , labeled ∞, is the same in both plots. Contour heights are 10, 20,100 and ∞. Parameter values d=0.5, b=1, s=10−3, q=0.θc=0.5 when r=0 in both plots.
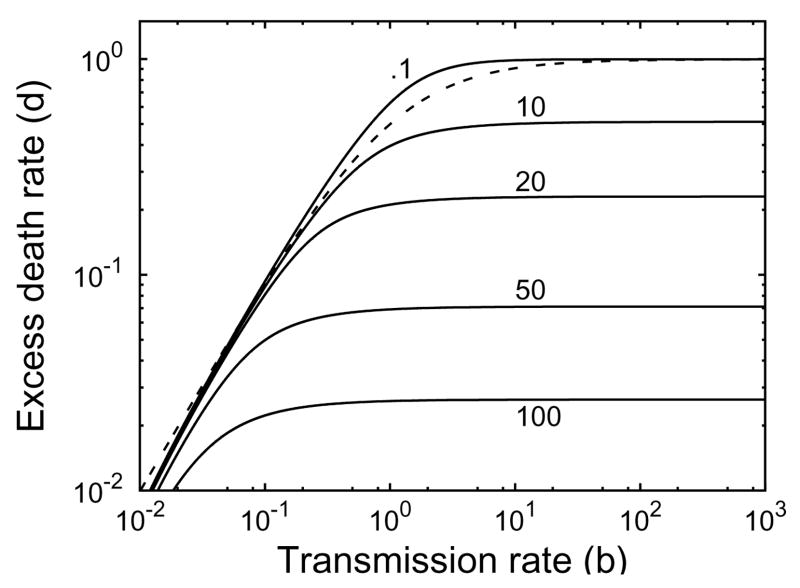
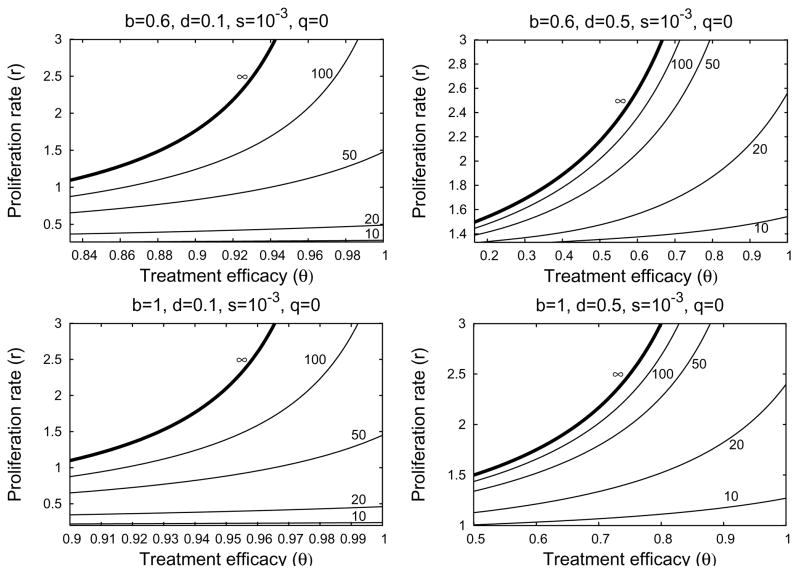
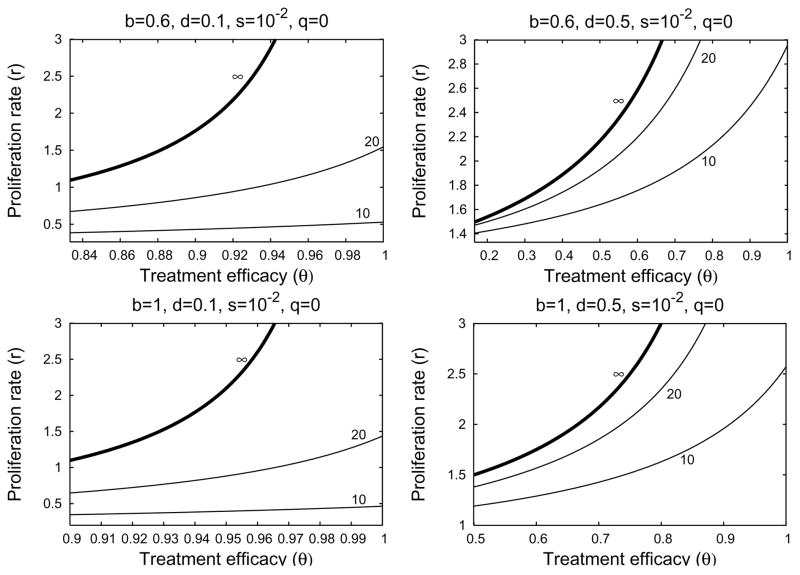
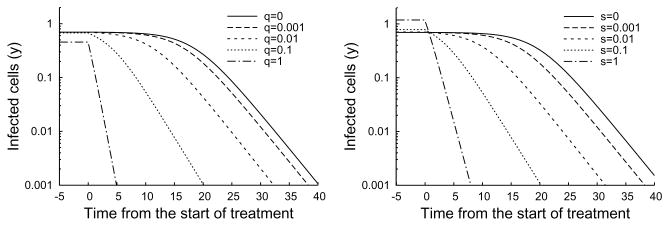
If the relative proliferation rate of infected cells r is fixed at a sufficiently large value (r − d ≥ 1 for example), then the treatment delay increases as the excess death rate d decreases and the transmission rate b increase (Figure 4.6). We see from Figures 4.7 and 4.8 that the treatment delay increases as r increases, until r is sufficiently large to introduce bistability, corresponding to td → ∞. In the strong-delay region of Figure 4.3, the larger the immigration rate s of uninfected hepatocytes, the shorter the treatment delay because there are more uninfected hepatocytes at the start of treatment (compare Figures 4.7 and 4.8). The effect of spontaneous cure (q) is similar to that of immigration (s); more spontaneous cure shortens the treatment delay (Figure 4.9). The sensitivity to immigration and spontaneous cure decreases as the relative proliferation rate r of infected hepatocytes decreases.
Fig. 4.6.
Contour plot of the treatment delay td from Eq. (4.8) as functions of d and b when r =1,θ = 1, s = 10−3 and q=0. Contours at .1, 10, 20, 50, and 100. The dotted line d = rb/(1+b) is an upper bound on the region of strong-delay effect.
Fig. 4.7.
Four contour plots of treatment delay td in the strong-delay region of Figure 4.3, calculated from Formula (4.8) when hepatocyte immigration is slow. In the parameter region above the ∞-contour, treatment is not sufficiently effective to overcome the local stability of the infected-cell population. Below the ∞-contour, treatment successfully clears infection, with the length of the delay given by the contour values. Parameter values are given at the top of each plot. The left-hand boundary in each plot corresponds to θ = θC when r = 0.
Fig. 4.8.
Four contour plots of treatment delay td in the strong-delay region of Figure 4.3, calculated from Formula (4.8). Parameter values are stated at the top of each plot. In the parameter region above the ∞-contour, treatment is not sufficiently effective to overcome the local stability of the infected-cell population. Below the ∞-contour, treatment successfully clears infection, with the length of the delay given by the contour values. In these plots, immigration is fast (s = 10−2) and significantly reduces the delay before treatment reduces the number of infected cells, compared to Figure 4.7. The left-hand boundary in each plot corresponds to θ = θC when r = 0.
Fig. 4.9.
Time series plot of changes in the number of infected cells under treatment with s = 0.001 (left) and q = 0.001 (right). As the curing of infected cells q is increased from 0 to 1, the treatment delay decreases from 15 to 0 (left). Similarly, treatment delay decreases as the immigration rate s increases (right). Note that only vary large values of s and q significantly effect the pre-treatment state. Parameter values d = 0.3, b = 3,θ = 1, r = 1.
There is a small range of values of r for which Eq. (3.14) has no solutions. For this region, u* does not exist, and our approximation to td fails despite the presence of a positive but finite delay. The perturbation approximation to td continues to work for some of this region, but also eventually fails for r just below the exact bistability threshold. Approximation of td in this region can be performed using dynamical systems theory, as described in Appendix C.
5. Discussion
Only about 20% to 30% of HCV-infected individuals spontaneously clear the virus during the early phase of infection [44]. According to our model, when an individual is initially exposed to a small amount of virus, infection can not be established unless the disease-free reproductive number is greater than 1. If the reproductive number is greater than 1, virus will spread among hepatocytes, eventually infecting some or all of the cells it targets. In addition, viral dynamics during this phase may be monotone or oscillatory, but are expected to converge to a stationary equilibrium. Homeostatic proliferation of infected cells has only a small effect on the reproductive number, but diminishes oscillations [4] and increases the proportion of target hepatocytes infected at steady-state. However, the dynamics may be bistable if the proliferation rate of infected hepatocytes is faster than that of uninfected hepatocytes. The HCV kinetics during primary infection, before the adaptive immune response against HCV is induced, both in humans [18] and chimpanzees [29] has been observed to be monotone, i.e., after a fast viral increase the virus stabilizes without observed oscillations in a high viral load steady-state. This lack of observed oscillations supports our hypothesis that homeostatic proliferation of infected cells exists.
The typical HCV RNA decay observed during therapy with standard or pegylated interferon-α alone or in combination with ribavirin is biphasic- characterized by an initial rapid viral decline (first phase) followed by a slower decay (second phase) [37]. In about 30%–40% of treated patients triphasic viral declines have also been observed [19, 48, 1, 23]. In some patients (nonresponders) viral loads may not decline. In others, viral load initially declines (first phase) followed by maintenance of a steady level lower than baseline (flat partial responders). Here we have mathematically characterized a model of HCV dynamics [6] that encompasses the observed viral kinetic profiles under therapy. We speculate that in nonresponders the drug effectiveness, θ, may not exceed θp (Figure 4.1) and therefore viral load does not decline under therapy. Flat partial responders may be explained as a consequence of drug efficacy higher than θp but lower than the critical drug efficacy θC (Figure 4.1). Viral clearance occurs when θ> θc via biphasic or triphasic viral decline when the hepatocyte proliferation rate, r, is lower or higher than the hepatocyte death rate, d, respectively (System (2.7) without “cure”; Figure 4.1).
Using perturbation theory, we showed a delay can occur between the start of treatment and the first measurable decline in the number of infected hepatocytes under efficient therapy (θ > θC) because of the influence of a near-by saddle-node bifurcation in the system (Figure 4.4). Equation (4.8) can be used to approximate the duration of this delay. In terms of viral dynamics, this delay appears as a shoulder phase separating the initial decay in viral load at the start of treatment from the asymptotic clearance phase. One of the conditions for the existence of this delay between the initial decrease and asymptotic clearance is that the number of infected cells is much larger than the number of uninfected cells at the start of therapy. During therapy the number of uninfected cells increases. Because of density-dependent homeostatic processes, the proliferation of infected cells slows as the number of uninfected cells increases. When this proliferation slows to the point at which it no longer keeps up with the rate of infected cell loss, the number of infected cells start to decline. The shoulder persists until the ratio between uninfected cells and infected cells is approximately one. We found that the stopping condition, T/I ≈ 1, for calculating when the shoulder phase ends, is simple and robust for calculating td over a large-shoulder parameter range. Other topping conditions T/I ≈ 1 are discussed in Appendix B.
When using td in the context of the full model (System (2.1)), i.e., calculating the viral shoulder phase and hence a triphasic viral decay, our formula (Eq. (4.8)) has to be adjusted. Since interferon-α mainly inhibits viral production, and we assume that initially the infected cell number remains close to its level before therapy, then the model (System (2.1)) predicts that viral load will decline from its baseline value, V0 according to the equation:
 (t) =
(t) =
 0(1 − ε + εe−ct)[37]. This equation for the first phase of viral decline predicts that at times long compared with 1/c, the average free virion lifetime in serum, the viral load will decline to (1 − ε)
 0 over an interval of length ln(1 − ε)/c (Fig. 2.1). Therefore, our formula (Eq. (4.8)), which estimates the length of time since the start of therapy and the beginning of the third phase of decline (Fig. 2.1 right panel) can be adjusted to the actual viral shoulder duration by subtracting the relaxation time ln(1 − ε)/c from the dimensional form of td.
We have previously predicted, using System (2.1), that the spontaneous curing (q) of infected cells by a noncytolytic immune response is necessary to prevent a significant loss of liver cells during acute HCV infection in chimpanzees [5]. Direct evidence for noncytolytic clearance of HCV from infected cells has not yet been found, but interferon-a has cured replicon cells [2] and clearance of hepatitis-B-virus-infected hepatocytes has been shown to occur through noncytolytic mechanisms [16]. In the context of treatment in chronic-HCV patients, our theory predicts that any shoulder phase will be shortened by a strong noncytolytic response.
HCV is the only known RNA virus with an exclusively cytoplasmic life cycle that is associated with cancer [47]. The mechanisms by which it causes cancer are unclear. It may be possible that the path to hepatocellular carcinoma in chronic hepatitis C shares some important features with human papillomavirus-induced carcinogenesis [17]. Interactions of HCV proteins with key regulators of the cell cycle, e.g., the retinoblastoma protein [34] and p53 [22], may lead to enhanced cellular proliferation over uninfected cells and may also compromise multiple cell cycle checkpoints that act to maintain genomic integrity [11], thus setting the stage for carcinogenesis. In light of these speculations, the proliferation of HCV-infected cells, rI, may be higher than proliferation of uninfected cells, rT. Therefore, in this study we also analyzed this assumption (i.e., rI> rT). We found that when rI > rT bistability arises (under certain parameter values), and imposing rI < rT is sufficient to preclude bistability. However, more experimental work is needed to test the consistency of this view of homeostatic proliferation with the behavior of hepatocytes in vivo. Our model makes some predictions regarding changes in the total hepatocyte numbers over the course of infection and treatment. Since liver function is correlated to hepatocyte numbers, the total number of hepatocytes may be an important medical indicator and may further inform our understanding of HCV.
On a mathematical note, there is as yet no global stability analysis of System (2.1). Of particular importance, a closer analysis of the quasi-steady state approximation is needed. This is emphasized by numerical observations that a Hopf bifurcation of the partial-infection stationary solution can occur if the viral clearance rate c is not sufficiently large. Applications and extension of methods from De Leenheer and Smith [9], De Leenheer and Pilyugin [8] and Korobeinikov [24] may prove useful in further work.
The analyses presented here are important not only for HCV infection but should also be relevant for modeling other infections with hepatotropic viruses, such as hepatitis B virus. Many mathematical models for the study of hepatitis B virus DNA kinetics under therapy ignore the proliferation of virus-infected cells [36]. Interestingly, besides the typical biphasic decay in viral load, other kinetic profiles have been observed, such as triphasic. As our model allows one to predict more complex viral decay profiles, we hope that it will be useful for understanding complex HCV and HBV kinetics under therapy [7].
Acknowledgments
T. Reluga thanks A. Zilman for helpful discussion concerning the calculations in Appendix C.
Appendix A. Perturbation Approximations
Regular perturbation methods can be used to approximate the stationary solutions of System (2.7) in the limits of small s and q, based on the polynomials in Eq. (3.11) and Eq. (3.14a). Eq. (3.11) is independent of q, so let x = x0 + sxs + o(s). Substituting into Eq. (3.11), (x0 + sxs)2 − (x0 + sxs) = s, Collecting like terms,
| (A.1) |
From the zeroth-order term in s, x0 ∊ {0,1}, and to first order, . Thus, the two corresponding stationary solutions for small s and q are
| (A.2) |
Eq. (3.14a) depends on both s and q, so let x = x0 + sxs + qxq +o(s, q). Substituting into Eq. (3.14a) and collecting like terms,
| (A.3) |
To highest order,
| (A.4) |
The first order corrections in s and q are
| (A.5a) |
| (A.5b) |
Eq. (3.14b) can then be used to determine y. In the special case of x0 = 0, the stationary solution is given by Eq. (3.15). This can be used to approximate both the pre-treatment and post-treatment (substituting (1 − θ)b for b) stationary solutions when applying Eq. (4.8).
Appendix B. Choosing a treatment delay threshold
Using Equation (4.4), we can approximate the delay, td, before the number of infected hepatocytes begins to decline. But to do this, we have to find a quantitative rule for determining the end of the treatment delay. One way to do this is to choose a line, represented by a vector k and a constant k0, such that the shoulder ends when the approximate solution intersects this line. Thus, td is defined such that
| (B.1) |
Since we are concerned only with the divergence from steady-state, we can ignore the stable mode of Eq. (4.4), and Eq. B.1 leads to the formula
| (B.2) |
Several choices for k and k0 are summarized in Table B.1, along with their drawbacks. The unstable manifold of u* has the initial direction
| (B.3) |
If we constrain the application of Eq. (B.2) to the region of Figure 4.3 where θ > θc and r > d, we can show that the choice of k = [1, −1], k0 =0 always gives a solution for td. This is because the first component of the eigenvector is positive and the second is negative, ensuring that the orbit approximated by a line in the direction of the eigenvector will always intersect the line y = x. Numerical evidence indicates that this choice is reasonably consistent with the qualitative character of delays, and we will use it throughout this paper. However, it underestimates the delay time in cases where r − d is small. In such situations, k = [1,1], k0 = 1 gives better approximations to td.
Appendix C. Bottle neck calculations
When the growth rate r is slightly smaller than the critical value r* that introduces bistability (Figure 4.3), Equation (4.4) can not be used to estimate the treatment delay td because there is no near-by equilibrium around-which we can linearize. However, we can still approximate the treatment delay by transforming the system near the bifurcation point into normal form [15]. The normal form of a generic saddle-node bifurcation satisfies the first-order differential equation
Table B.1.
Possible stopping condition choices for calculation of td.
| Description | k | k0 | Comment |
|---|---|---|---|
| Upper bound | [1, 1] | 1 | u(t) may not intersect |
| x(t) =y(t) | [1, −1] | 0 | u(t) may not intersect |
| 90% threshold | [0, 1] | .9(1−d/r) | u(t) may not intersect |
| Uninfected cells only | [1, 0] | d/r | td → 0 as d → 0, although the delay may not |
| Uninfected cells only | [1, 0] | .1 | may not correspond to the full delay |
| (C.1) |
where r is the bifurcation parameter, and r= r* is the bifurcation point with a0 > 0 and a2 ≠ 0. Using elementary integration methods, we can show that for r ≈ r*, the time it takes for a solution to pass from a negative initial position to a positive final position, both far from the origin, is approximately given by
| (C.2) |
As r is increased toward r*, the time becomes longer. If r > r*, the time is infinite because solutions are trapped by an intermediate attracting state. For this HCV model, our task to calculate r*, a0, and a2 by transforming System (2.7) into normal-form near the saddle-node bifurcation that introduces bistability.
We can determine the bifurcation point r* by setting the discriminant of x in Equation (3.14a) (with transmission rate (1 − θ)b instead of b) equal to zero. The result is a quadratic polynomial for r*, where the smaller solution corresponds to a saddle-node bifurcation for non-biological values of x, and the larger solution corresponds to bifurcation which is biologically important.
Once r* is known, we calculate the feasible non-hyperbolic equilibrium solution (x*(r*), y*(r*)) using Eq. (3.14). and transform System (2.7) using a change of variables of the form
| (C.3a) |
| (C.3b) |
such that locally, the system has the form
| (C.4a) |
| (C.4b) |
where a0 and a2 satisfy the conditions given above and a3 > 0. This transformation can be perform using the eigenvalue decomposition of the Jacobian at the equilibrium point, and then chosing Mxr and Myr to eliminate extra terms in u̇ and v̇. The O(v) terms are neglected because v converges to 0 exponentially near the bifurcation. The procedure is easily implemented numerically, but we have not produced a simple analytic formula for the result.
Footnotes
Portions of this work were done under the auspices of the U. S. Department of Energy under contract DE-AC52-06NA25396 and supported by NIH grants AI28433, RR06555, AI06525, and P20-RR18754 and the Human Frontiers Science Program grant RPG0010/2004.
References
- 1.Bekkering FC, Schalm SW. Changes in anti-viral effectiveness of interferon after dose reduction in chronic hepatitis C patients: A case control study. BMC Gastroenterology. 2001;1:14. doi: 10.1186/1471-230X-1-14. [DOI] [PMC free article] [PubMed] [Google Scholar]
- 2.Blight KJ, McKeating JA, Rice CM. Highly permissive cell lines for subgenomic and genomic hepatitis C virus RNA replication. Journal of Virology. 2002;76:13001–13014. doi: 10.1128/JVI.76.24.13001-13014.2002. [DOI] [PMC free article] [PubMed] [Google Scholar]
- 3.Dahari H, Feilu A, Garcia-Retortillo M, Forns X, Neumann AU. Second hepatitis C replication compartment indicated by viral dynamics during liver transplantation. Journal of Hepatology. 2005;42:491–498. doi: 10.1016/j.jhep.2004.12.017. [DOI] [PubMed] [Google Scholar]
- 4.Dahari H, Lo A, Ribeiro RM, Perelson AS. Modeling hepattis C virus dynamics: Liver regeneration and critical drug efficacy. Journal of Theoretical Biology. 2007;47:371–381. doi: 10.1016/j.jtbi.2007.03.006. [DOI] [PMC free article] [PubMed] [Google Scholar]
- 5.Dahari H, Major M, Zhang X, Mihalik K, Rice CM, Perelson AS, Feinstone SM, Neumann AU. Mathematical modeling of primary hepatitis C infection: Noncytolytic clearance and early blockage of virion production. Gastroenterology. 2005;128:1056–1066. doi: 10.1053/j.gastro.2005.01.049. [DOI] [PubMed] [Google Scholar]
- 6.Dahari H, Ribeiro RM, Perelson AS. Triphasic decline of HCV RNA during antiviral therapy. Hepatology. 2007;46:16–21. doi: 10.1002/hep.21657. [DOI] [PubMed] [Google Scholar]
- 7.Dahari H, Shudo E, Ribeiro RM, Perelson AS. Modeling complex decay profiles of hepatitis B virus during antiviral therapy. Hepatolgy. doi: 10.1002/hep.22586. (in press) [DOI] [PMC free article] [PubMed] [Google Scholar]
- 8.De Leenheer P, Pilyugin S. Multi-strain virus dynamics with mutations: A global analysis. Arxiv preprint arXiv:0707.4501. [DOI] [PubMed] [Google Scholar]
- 9.De Leenheer P, Smith H. Virus Dynamics: A Global Analysis. SIAM Journal on Applied Mathematics. 2003;63:1313–1327. [Google Scholar]
- 10.Di Liberto G, Féray C. The anhepatic phase of liver transplantation as a model for measuring the extra-hepatic replication of hepatitis C virus. Journal of Hepatology. 2005;42:441–443. doi: 10.1016/j.jhep.2005.02.001. [DOI] [PubMed] [Google Scholar]
- 11.Duensing S, Munger K. Mechanisms of genomic instability in human cancer: Insights from studies with human papillomavirus oncoproteins. International Journal of Cancer. 2004;109:157–162. doi: 10.1002/ijc.11691. [DOI] [PubMed] [Google Scholar]
- 12.Fausto N. Liver regeneration and repair: hepatocytes, progenitor cells, and stem cells. Hepatology. 2004;39:1477–1487. doi: 10.1002/hep.20214. [DOI] [PubMed] [Google Scholar]
- 13.Fried MW, Shiffman ML, Reddy KR, Smith C, Marinos G, Goncales FL, Haussinger D, Diago M, Carosi G, Dhumeaux D, Carxi A, Lin A, Hoffman J, Yu J. Peginterferon alfa-2a plus ribavirin for chronic hepatitis C virus infection. New England Journal of Medicine. 2002;347:975–982. doi: 10.1056/NEJMoa020047. [DOI] [PubMed] [Google Scholar]
- 14.Gómez-Acevedo H, Li MY. Backward bifurcation in a model for HTLV-I infection of CD4+ T cells. Bulletin of Mathematical Biology. 2005;67:101–114. doi: 10.1016/j.bulm.2004.06.004. [DOI] [PubMed] [Google Scholar]
- 15.Guckenheimer J, Holmes P. Nonlinear Oscillations, Dynamical Systems, and Bifurcations of Vector Fields. Springer; New York, NY: 1983. [Google Scholar]
- 16.Guidotti LG, Rochford R, Chung J, Shapiro M, Purcell R, Chisari FV. Viral clearance without destruction of infected cells during acute HBV infection. Science. 1999;284:825. doi: 10.1126/science.284.5415.825. [DOI] [PubMed] [Google Scholar]
- 17.Hebner CM, Laimins LA. Human papillomaviruses: basic mechanisms of pathogenesis and oncogenicity. Reviews in Medical Virology. 2006;16:83–97. doi: 10.1002/rmv.488. [DOI] [PubMed] [Google Scholar]
- 18.Herring BL, Tsui R, Peddada L, Busch M, Delwart EL. Wide range of quasispecies diversity during primary hepatitis C virus infection. Journal of Virology. 2005;79:4340–4346. doi: 10.1128/JVI.79.7.4340-4346.2005. [DOI] [PMC free article] [PubMed] [Google Scholar]
- 19.Herrmann E, Lee J, Marinos G, Modi M, Zeuzem S. Effect of ribavirin on hepatitis C viral kinetics in patients treated with pegylated interferon. Hepatology. 2003;37:1351–1358. doi: 10.1053/jhep.2003.50218. [DOI] [PubMed] [Google Scholar]
- 20.Hofbauer J, Sigmund K. Evolutionary Games and Population Dynamics. Cambridge University Press; Cambridge, UK: 1998. [Google Scholar]
- 21.Hutchinson GE. An Introduction to Population Ecology. Yale University Press; New Haven, CT: 1978. [Google Scholar]
- 22.Kao CF, Chen SY, Chen JY, Lee YHW. Modulation of p53 transcription regulatory activity and post-translational modification by hepatitis C virus core protein. Oncogene. 2004;23:2472–2483. doi: 10.1038/sj.onc.1207368. [DOI] [PubMed] [Google Scholar]
- 23.Kieffer TL, Sarrazin C, Miller JS, Welker MW, Forestier N, Kwong AD, Zeuzem S. Telaprevir and pegylated interferon-alpha-2a inhibit wild-type and resistant genotype 1 hepatitis C virus replication in patients. Hepatology. 2007;46:631–639. doi: 10.1002/hep.21781. [DOI] [PubMed] [Google Scholar]
- 24.Korobeinikov A. Global properties of basic virus dynamics models. Bulletin of Mathematical Biology. 2004;66:879–883. doi: 10.1016/j.bulm.2004.02.001. [DOI] [PubMed] [Google Scholar]
- 25.Lindenbach BD, Rice CM. Unravelling hepatitis C virus replication from genome to function. Nature. 2005;436:933–938. doi: 10.1038/nature04077. [DOI] [PubMed] [Google Scholar]
- 26.Macdonald RA. “Lifespan” of liver cells. Autoradio-graphic study using tritiated thymidine in normal, cirrhotic, and partially hepatectomized rats. Archives of Internal Medicine. 1961;107:335–343. doi: 10.1001/archinte.1961.03620030023003. [DOI] [PubMed] [Google Scholar]
- 27.Mackay IR. Hepatoimmunology: A perspective. Special Feature. Immunology and Cell Biology. 2002;80:36–44. doi: 10.1046/j.1440-1711.2002.01063.x. [DOI] [PubMed] [Google Scholar]
- 28.Macsween RNM, Burt AD, Portmann BC, Ishak KG, Scheuer PJ, Anthony PP. Pathology of the Liver. Churchill Livingstone. 1987 [Google Scholar]
- 29.Major ME, Dahari H, Mihalik K, Puig M, Rice CM, Neumann AU, Feinstone SM. Hepatitis C virus kinetics and host responses associated with disease and outcome of infection in chimpanzees. Hepatology. 2004;39:1709–1720. doi: 10.1002/hep.20239. [DOI] [PubMed] [Google Scholar]
- 30.Manns MP, McHutchison JG, Gordon SC, Rustgi VK, Shiffman M, Reindollar R, Goodman ZD, Koury K, Ling MH, Albrecht JK. Peginterferon alfa-2b+ ribavirin compared with interferon alfa-2b+ ribavirin for initial treatment of chronic hepatitis C: a randomised trial. The Lancet. 2001;358:958–965. doi: 10.1016/s0140-6736(01)06102-5. [DOI] [PubMed] [Google Scholar]
- 31.Meuleman P, Libbrecht L, De Vos R, De Hemptinne B, Gevaert K, Vandekerckhove J, Roskams T, Leroux-Roels G. Morphological and biochemical characterization of a human liver in a uPA-SCID mouse chimera. Hepatology. 2005;41:847–856. doi: 10.1002/hep.20657. [DOI] [PubMed] [Google Scholar]
- 32.Michalopoulos GK, DeFrances MC. Liver regeneration. Science. 1997;276:60–66. doi: 10.1126/science.276.5309.60. [DOI] [PubMed] [Google Scholar]
- 33.Moler C, Loan CV. Nineteen dubious ways to compute the exponential of a matrix, twenty-five years later. SIAM Review. 2003;45:3–49. [Google Scholar]
- 34.Munakata T, Nakamura M, Liang Y, Li K, Lemon SM. Down-regulation of the retinoblastoma tumor suppressor by the hepatitis C virus NS5B RNA-dependent RNA polymerase. Proceedings of the National Academy of Sciences. 2005;102:18159–18164. doi: 10.1073/pnas.0505605102. [DOI] [PMC free article] [PubMed] [Google Scholar]
- 35.Murray JD. Mathematical Biology. 2. Springer; New York: 1993. [Google Scholar]
- 36.Neumann AU. Hepatitis B viral kinetics: A dynamic puzzle still to be resolved. Hepatology. 2005;42:249–54. doi: 10.1002/hep.20831. [DOI] [PubMed] [Google Scholar]
- 37.Neumann AU, Lam NP, Dahari H, Gretch DR, Wiley TE, Layden TJ, Perelson AS. Hepatitis C viral dynamics in vivo and the antiviral efficacy of interferon-alpha therapy. Science. 1998;282:103–107. doi: 10.1126/science.282.5386.103. [DOI] [PubMed] [Google Scholar]
- 38.NIH. National institutes of health consensus development conference: management of hepatitis C. Hepatology. 2002;36:S3–20. [Google Scholar]
- 39.Pedersen IM, Cheng G, Wieland S, Volinia S, Croce CM, Chisari FV, David M. Interferon modulation of cellular microRNAs as an antiviral mechanism. Nature. 2007;449:919–922. doi: 10.1038/nature06205. [DOI] [PMC free article] [PubMed] [Google Scholar]
- 40.Perelson A, Neumann A, Markowitz M, Leonard J, Ho D. HIV-1 dynamics in vivo: virion clearance rate, infected cell life-span, and viral generation time. Science. 1996;271:1582–1586. doi: 10.1126/science.271.5255.1582. [DOI] [PubMed] [Google Scholar]
- 41.Perelson AS. Modelling viral and immune system dynamics. Nature Reviews Immunology. 2002;2:28–36. doi: 10.1038/nri700. [DOI] [PubMed] [Google Scholar]
- 42.Perelson AS, Herrmann E, Micol F, Zeuzem S. New kinetic models for the hepatitis C virus. Hepatology. 2005;42:749–754. doi: 10.1002/hep.20882. [DOI] [PubMed] [Google Scholar]
- 43.Powers KA, Ribeiro RM, Patel K, Pianko S, Nyberg L, Pockros P, Conrad AJ, McHutcmson J, Perelson AS. Kinetics of hepatitis C virus reinfection after liver transplantation. Liver Transplantation. 2006;12:207–216. doi: 10.1002/lt.20572. [DOI] [PubMed] [Google Scholar]
- 44.Rehermann B, Nascimbeni M. Immunology of hepatitis B virus and hepatitis C virus infection. Nature Reviews Immunology. 2005;5:215–229. doi: 10.1038/nri1573. [DOI] [PubMed] [Google Scholar]
- 45.Ribeiro R. Dynamics of alanine aminotransferase during hepatitis C virus treatment. Hepatology. 2003;38:509–517. doi: 10.1053/jhep.2003.50344. [DOI] [PubMed] [Google Scholar]
- 46.Seeff LB. Natural history of chronic hepatitis C. Hepatology. 2002;36:S35–S46. doi: 10.1053/jhep.2002.36806. [DOI] [PubMed] [Google Scholar]
- 47.Seeff LB, Hoofnagle JH. Epidemiology of hepatocellular carcinoma in areas of low hepatitis B and hepatitis C endemicity. Oncogene. 2006;25:3771–3777. doi: 10.1038/sj.onc.1209560. [DOI] [PubMed] [Google Scholar]
- 48.Sentjens RE, Weegink CJ, Beld MG, Cooreman MC, Reesink HW. Viral kinetics of hepatitis C virus RNA in patients with chronic hepatitis C treated with 18 MU of interferon alpha daily. European journal of gastroenterology and hepatology. 2002;14:833–840. doi: 10.1097/00042737-200208000-00004. [DOI] [PubMed] [Google Scholar]
- 49.Sherlock S, Dooley J. Diseases of the Liver and Biliary System. Black-well: Science; 2002. [Google Scholar]
- 50.Theise ND, Nimmakayalu M, Gardner R, Illei PB, Morgan G, Teperman L, Henegariu O, Krause DS. Liver from bone marrow in humans. Hepatology. 2000;32:11–16. doi: 10.1053/jhep.2000.9124. [DOI] [PubMed] [Google Scholar]
- 51.Thimme R, Oldach D, Chang KM, Steiger C, Ray SC, Chisari FV. Determinants of viral clearance and persistence during acute hepatitis C virus infection. Journal of Experimental Medicine. 2001;194:1395–1406. doi: 10.1084/jem.194.10.1395. [DOI] [PMC free article] [PubMed] [Google Scholar]
- 52.Wei X, Ghosh S, Taylor M, Johnson V, Emini E, Deutsch P, Lifson J, Bonhoeffer S, Nowak M, Hahn B, et al. Viral dynamics in human immunodeficiency virus type 1 infection. Nature. 1995;373:117–122. doi: 10.1038/373117a0. [DOI] [PubMed] [Google Scholar]


