

Abstract
Late-term thrombosis on drug-eluting stents is an emerging problem that might be addressed using extremely thin, biologically-active hydrogel coatings. We report a dip-coating strategy to covalently link poly(ethylene glycol) (PEG) to substrates, producing coatings with <≈100 nm thickness. Gelation of PEG-octavinylsulfone with amines in either bovine serum albumin (BSA) or PEG-octaamine was monitored by dynamic light scattering (DLS), revealing the presence of microgels before macrogelation. NMR also revealed extremely high end group conversions prior to macrogelation, consistent with the formation of highly crosslinked microgels and deviation from Flory-Stockmayer theory. Before macrogelation, the reacting solutions were diluted and incubated with nucleophile-functionalized surfaces. Using optical waveguide lightmode spectroscopy (OWLS) and quartz crystal microbalance with dissipation (QCM-D), we identified a highly hydrated, protein-resistant layer with a thickness of approximately 75 nm. Atomic force microscopy in buffered water revealed the presence of coalesced spheres of various sizes but with diameters less than about 100 nm. Microgel-coated glass or poly(ethylene terephthalate) exhibited reduced protein adsorption and cell adhesion. Cellular interactions with the surface could be controlled by using different proteins to cap unreacted vinylsulfone groups within the coating.
Keywords: polyethylene glycol, albumin, microgel, nanogel, surface modification, cell adhesion, protein adsorption
1. Introduction
Thin hydrogel coatings may prove to be useful for reducing coagulation and thrombosis on blood-contacting devices with complex geometries, such as endovascular stents. However, the density of poly(ethylene glycol) (PEG) in the coating must be quite high to achieve a substantial reduction in protein adsorption [1, 2]. We have found that single layers or even multiple layers of PEG coated on a surface do not provide the required cell adhesion resistance for long-term effectiveness [3]. This suggested to us that the use of relatively large aggregates containing high densities of PEG to form the thin coatings may ensure adequate surface coverage even with a limited number of attachment sites on the material.
A number of strategies have been explored to produce thin PEG-based coatings. Glow discharge treatment of surfaces with tetraglyme produces surfaces that exhibit low amounts of fibrinogen adsorption [4, 5]. Surface-initiated free-radical polymerization of hydrophilic monomers promotes polymerization and crosslinking in a limited region above the substrate [6, 7]. Adsorption of high molecular weight PEG/polylysine copolymers onto endovascular stents reduces restenosis after implantation,[8] although long-term stability of the adsorbed copolymers may be a concern [9]. Copolymers of methyl methacrylate and PEG are also quite effective in reducing non-specific cell adhesion on a variety of surfaces [10–13]. A single or very thin crosslinked layer of “star” (multiarm) PEG reduces non-specific cell adhesion on surfaces [14–16]. Covalent layer-by-layer methods have also been described, in some cases yielding coatings with resistance to protein adsorption and cell adhesion [17–19]. However, our previous efforts using a covalent layer-by-layer method to apply dense coatings of PEG to surfaces proved to be quite laborious and afforded only a moderate reduction in cell adhesion [3]. This suggested that the use of higher molecular weight polymers or larger polymer aggregates (microgels) may more readily achieve dense PEG coverage, especially on surfaces with low densities of reactive groups.
Microgels have been used extensively to produce or enhance surface coatings (e.g. latex paints) [20]. The definition of microgel by IUPAC has evolved from “a network of microscopic dimensions”[21] to the more recent recommendation: “particle of gel of any shape with an equivalent diameter of approximately 0.1 to 100 µm” [22]. ‘Nanogel’ is now “a gel with an equivalent diameter in the range of 1–100 nm”. For simplicity, microgel will herein refer to both the nano- and microscale regimes. Microgels can be readily produced by emulsion polymerization, in which macrogel formation is hindered by the segregation of initiator, monomer and/or polymer in the heterogeneous solution [20, 23, 24]. However, many examples exist in which microgels form in homogenous solutions. For example, polymerization of N-isopropylacrylamide in water at high temperatures leads to microgel formation due to precipitation [25–27]. Other examples exist where microgels form during polymerization, likely due to steric or electrostatic stabilization rather than precipitation [28–31]. By manipulating solvent quality, some systems can produce stable microgels without gelation even after complete reaction of end-groups [30].
We hypothesized that Flory’s principle of equal reactivity would not hold during the crosslinking of multiarm PEG by Michael-type addition, likely due to steric stabilization. The principle of equal reactivity states that reactive groups on growing polymer chains are just as likely to react as monomers [32]. In the monocondensation of molecules with functionalities (f) greater than 2, the gel point is reached at an end-group conversion (p) of p= 1/(f−1) [33]. If the principle of equal reactivity applies, the majority of molecules in this crosslinking reaction will be monomers and dimers at the point of gelation [32]. However, if growing polymer chains become less reactive with increasing size, the gel point may be delayed and a large fraction of the PEG may be present in microgels prior to gelation.
Using PEG-octavinylsulfone (PEG-OVS) and either bovine serum albumin (BSA) or PEG-octaamine (PEG-OA) as crosslinkers, we found evidence for substantial microgel formation before macrogelation. Monte Carlo simulations of the crosslinking process illustrated that a decrease in reactivity with increasing chain size may delay the gel point and favor the formation of microgels at the expense of monomers and dimers. The reaction between amines and vinylsulfones is somewhat sluggish, allowing us to maintain a well-mixed system with reproducible sizes of microgels observed by dynamic light scattering (DLS). The crosslinking reaction could be further slowed by dilution or freezing. Taking advantage of the higher reactivity of vinylsulfones with thiols, the crosslinking-solutions containing PEG microgels could be reacted with thiol-functionalized surfaces without macrogelation. Optical waveguide lightmode spectroscopy (OWLS) and quartz crystal microbalance with dissipation (QCM-D) measurements demonstrated the presence of thin hydrogel layers that were extremely resistant to fibrinogen adsorption. A single incubation of the surface with a microgel solution reduced non-specific cell adhesion to an extent that was much greater than 20 layers of PEG applied via a covalent layer-by-layer method [3]. Overall, the resistance to cell adhesion indicates that partially crosslinked multi-arm PEG may be useful in producing thin but dense PEG films on a variety of surfaces.
2. Materials and Methods
2.1. Microgel syntheses
Unless otherwise noted, all reagents were purchased from Sigma Aldrich. Poly(ethylene glycol)-octavinylsulfone (PEG-OVS, 96% end-group conversion) and PEG-octaamine (PEG-OA, 91% end-group conversion) were synthesized from 8-arm PEG-OH (mol wt 10,000, Shearwater Polymers, Huntsville, AL) as described previously [34, 35]. PEG-OVS, PEG-OA, and bovine serum albumin (BSA) solutions were prepared at 200 mg/mL in phosphate buffered saline (PBS; 0.2 g/L KCl, 0.2 g/L KH2PO4, 8 g/L NaCl, 1.15 g/L anhydrous Na2HPO4, pH 7.4) and sterile filtered with 0.22 µm sterile syringe tip filters (Millipore). PEG-OVS/BSA or PEG-OVS/ PEG-OA microgel solutions were formed through Michael-type conjugate addition reactions by respectively mixing PEG-OVS with either BSA or PEG-OA solutions at 0.4:1 or 1:1 ratios of amine to vinylsulfone groups. Ratios were prepared assuming that 8 moles of accessible functional groups per mole of PEG-OVS or PEG-OA were available and that bovine serum albumin had approximately 36 lysines sterically-accessible for reaction [34]. Microgel solutions were maintained at 37°C and rotated at 40 RPM until the desired mean effective diameters were reached, as recorded by DLS.
2.2. Modeling microgel formation
Using a custom-written program written in C, 50,000 eight arm PEG macromers were represented in 50,000 × 8 arrays s(see Supplementary Materials for code). Separate arrays were used to represent PEG-OA and PEG-OVS. A random number generator selected an element from each array. If neither element (i.e. end-group) had previously reacted, a bond was formed, essentially as described previously [36]. To simulate steric stabilization, two additional random numbers between 0 and 1 were generated. If the random numbers were greater than (# macromers)−3/5, where # macromers is the size of the chain to which the end-group belongs, the reaction was allowed to occur. Intramolecular reactions between free end-groups were always allowed to occur. To verify the accuracy of the Monte Carlo simulation, results without steric stabilization were compared to the Flory-Stockmayer equation [37, 38]:
| [1] |
where p is the percentage end-group conversion and f is the functionality.
2.3. Characterization of microgel formation
Mean effective hydrodynamic diameters (dPCS) were determined by dynamic light scattering/photon correlation spectroscopy (DLS/PCS; 90Plus Particle Size Analyzer, Brookhaven Instruments, Holtsville, NY) at a scattering angle of 90° and wavelength of 658 nm. Disposable polystyrene cuvettes (Brookhaven Instruments) were cleaned 1× with 95% ethanol and 2× with DI water prior to use. Polymerizing samples (30 µL) were collected at regular intervals and diluted with PBS (3 mL) in cleaned cuvettes and analyzed at 25°C. Data presented represent the average results of 3 measurements for each microgel synthesis with acquisition times of 1 min. Calculation of dPCS and statistical analysis of the results were performed using Brookhaven Instruments Particle Sizing Software (version 2.34, Brookhaven Instruments), which uses an intensity-weighted model assuming a log-normal distribution of particle sizes. We also used the software to calculate volume-weighted mean effective diameters.
Increases in BSA molecular weight over the time course of gelation was monitored with SDS-PAGE. BSA and PEG-OVS were mixed at amine to vinylsulfone ratios of 0.4:1 and aliquots (20 µg) were collected every hour and mixed with Laemmli sample buffer (0.01% bromophenol blue, 2% sodium dodecyl sulfate, 25% glycerol, 62.5 mM Tris-HCl, pH 6.8) and separated by gel electrophoresis using standard protocols. ImageJ software (NIH) was used to quantify the relative intensities of 66 kD unreacted BSA monomer bands stained with Coomassie Blue (Bio-Rad Laboratories, Inc.), which were in turn used to calculate the fraction of reacted BSA. 2nd-order kinetic analysis was performed to determine the rate of free BSA monomer consumption [39]. Equation 2, valid for a 2nd order reaction, was evaluated and plotted against corresponding time points.
| [2] |
Parameters ao and bo represent the initial concentrations of BSA and PEG-OVS, and x represents the amount of consumed BSA. A linear best-fit determined kA from the slope, which is the rate of reaction for free BSA monomer.
Nuclear magnetic resonance spectroscopy (NMR) was used to determine the percentage of reacted vinylsulfone groups while PEG-OVS was crosslinked with PEG-OA. The PEG-OVS/ PEG-OA microgels are well-suited for 1H NMR analysis due to the simplicity of the signal from the PEG backbone. PEG-OVS and PEG-OA solutions (200 mg/mL) were prepared in 20 mM potassium phosphate in D2O and mixed at a 1:1 (v/v) ratio. At various timepoints before gelation, samples of the microgel solution (10 mg of total polymer) were collected and dissolved in deuterated chloroform containing 0.71% N,N-dimethylformamide (DMF; used as an internal standard) prior to analysis on a 300 MHZ Varian Mercury-300 NMR. Integrated vinylsulfone peaks at 6.27 ppm (d, 2H, =CH2) and 6.16 ppm (d, 2H, =CH2) were normalized against the integrated DMF peak at 7.76 ppm (s,1H, -OCH ) in each NMR spectra.
2.4. Reaction with surfaces
Round glass coverslips (12 mm dia., Ted Pella Inc.) were functionalized with mercaptopropyltrimethoxysilane (MPTS) for covalent reaction with unreacted vinylsulfone groups in microgel solutions. Coverslips were cleaned by washing 3× in DI water and 3× in ethanol prior to oxygen-plasma etching, which was performed at 50% power for 10 min with a 40 kHz, 100 W plasma etcher (Diener Electronic, Femto model). The hydroxylated coverslips were then washed 3× in acetone and reacted for 1 h at 25°C with a 5% (v/v) solution of MPTS in acetone. Surfaces were washed 3× in acetone and cured for 1 h at 100°C under nitrogen. MPTS coverslips were incubated for 1 h with microgel solutions (dPCS =100–120 nm), washed 3× in PBS, and incubated overnight with PBS, BSA (50 mg/mL), or bovine fibrinogen (bFg, 2.5 mg/mL) at 37°C to respectively form uncapped, BSA-capped, or fibrinogen-capped microgel-coated surfaces.
Oxygen-plasma treated OWLS waveguide chips (MicroVacuum Ltd.) were vapor silanized with MPTS in preparation for covalent reaction with microgel solutions. After hydroxylation with oxygen plasma for 10 min at 50% power, the waveguide chips were placed on a polyethylene rack within a 100 mL Pyrex bottle attached to a Liebig condenser (Supplementary Figure 1). A 5% solution of MPTS in acetone was boiled at reflux for 24 h to provide a continuous silane vapor for reaction with the hydroxylated Si/Ti/O2 waveguide chip surface. Silanized waveguide chips were cured for 20 min at 100°C under nitrogen, and PEG-OVS/BSA microgel coatings were applied to surfaces as described above for MPTS-silanized coverslips.
QCM-D crystals with silicon dioxide coatings (Q-Sense, QSX 303, Gothenburg, Sweden) were O3-cleaned for 15 min in a homemade O3 chamber and immersed in an initially-boiling solution of 5:1:1 DI water:ammonium hydroxide:hydrogen peroxide for 30 min while the solution cooled to remove organics from the substrate surfaces. Cleaned crystals were immediately silanized by placement into 5% (v/v) MPTS in acetone for 1 h at room temperature and subsequently baked at 100 °C for 1 h. Silanized crystals were stored under nitrogen until use, which was always within 24 h.
Poly(ethylene terephthalate) films (PET, 0.05 mm thick, McMaster Carr, Chicago, IL) were functionalized with air-plasma prior to coating with microgel solutions. Circular sections (12 mm dia.) were cut from PET sheets and washed 3× in DI water and ethanol prior to radio frequency glow discharge air plasma (RFGD) treatments for 10 min at 50% power. Air-plasma etched PET (RFGD-PET) surfaces were incubated with 1:3 dilutions of microgels (dPCS=40–50 nm) in PBS for 12 h. Coated RFGD-PET was washed and stored in PBS until use in cell adhesion assays.
2.5. Cell culture and adhesion experiments
Chinese hamster ovary (CHO) cells (ATCC, Manassas, VA) were cultured in F-12 Kaighn’s medium (Gibco) supplemented with 10% fetal bovine serum (FBS) and 1% antibiotic-antimycotic (ABAM). Human aortic endothelial cells (HAEC; Lonza, Walkersville, MD) were cultured in endothelial growth medium (EGM, MCDB 131 medium) supplemented with 10 ng/ml epidermal growth factor, 10 µg/mL heparin, 1.0 µg/mL hydrocortisone, 1% penicillin-streptomycin, 5% FBS, and 12 µg/mL bovine brain extract (Clonetics). 3T3 fibroblasts were cultured in Dulbecco’s Modified Eagle’s Medium (DMEM, Gibco) supplemented with 4.5 g/L D-glucose, L-glutamine, 110 mg/L sodium pyruvate, 10% FBS and 1% penicillin-streptomycin. Microgel-coated coverslips were placed into 24-well plates of tissue-culture polystyrene (Becton Dickinson Labware, Franklin Lakes, NJ) and washed 3× with PBS and 1× with the appropriate cell media. Wells were seeded with cells and incubated for 12 h at 37 °C. CHO cells and fibroblasts were seeded at 2.5 × 10⁵ cells/cm2, while endothelial cells were seeded at the lower surface concentration of 3.5 × 10⁴ cells/cm2. After incubation, surfaces were washed 3× with media and cell adhesion was assessed by phase contrast microscopy. Photomicrographs were taken at 10× magnification and the number of attached cells was counted manually. The cell adhesion experiments were modified slightly for the long-term fibroblast reseeding experiments. Surfaces were washed and seeded with cells at 2.5 × 10⁵ cells/cm2 every 48 h and observed by microscopy every 24 h. Microscopy was performed on unwashed surfaces to observe the aggregation of non-adherent fibroblasts in solution.
2.6. OWLS measurements and analysis
Si/Ti/O2, MPTS-silanized, and BSA-capped PEG-OVS/BSA microgel-coated OWLS waveguide chips were analyzed inside the flow chamber of a MicroVacuum OWLS 110 optical waveguide lightmode spectrometer (MicroVacuum Ltd). All experiments were performed at a flow rate of 0.1 mL/min at 37°C and with a time step of 30 s. Waveguide surfaces were first equilibrated under DI water until a transverse magnetic mode refractive index variation of < 1 × 10⁻⁶ was obtained. For microgel characterization at each step of the coating process, MPTS-silanized waveguide chips were coated with microgels in situ and tested for fibrinogen adsorption using the following sequence of flowing solutions: 1) DI water, 2) PBS, 3) 2 h incubation with PEG-OVS/BSA microgel solutions (dPCS = 100–120 nm) in PBS, 4) PBS wash/equilibration, 5) overnight incubation with BSA in PBS, 6) PBS wash/equilibration, 7) 2 h incubation with 2.5 mg/mL bFg in PBS, 8) PBS wash/equilibration, and 9) DI water wash/equilibration. Waveguide chips precoated with BSA-capped PEG-OVS/BSA microgels were analyzed specifically for fibrinogen adsorption using the following series of solutions: 1) DI water, 2) PBS, 3) 2 h incubation with 2.5 mg/mL or 20 mg/mL bFg in PBS, 4) PBS wash/equilibration, and 5) DI water wash/equilibration.
Measured effective refractive indices were analyzed with MicroVacuum BioSense Software (MicroVacuum Ltd), which calculated mass on the waveguide surfaces using de Feijter’s formula [40]:
| [3] |
where M is the adsorbed mass, dA is the thickness of the adsorbed layer, dn/dc is the refractive index increment of the adsorbate, nA is the refractive index of the adsorbed layer, and nC is the refractive index of the cover medium. To calculate the amount of attached microgels on the waveguide surfaces, a refractometer was used to determine the value of the refractive index increment for PEG-OVS/BSA microgel solutions (dn/dc = 0.150 g/cm3). A value of dn/dc = 0.182 for g/cm3 was used for the analysis of adsorbed fibrinogen [40].
2.7. QCM-D measurements and analysis
A quartz crystal microbalance with dissipation monitoring (QCM-D, model Q-Sense D300) was used to monitor mass deposition on quartz crystals. Frequency (F) and dissipation (D) were recorded at the fundamental frequency (f = 5 MHz) and the 3rd, 5th, and 7th overtones (f = 15, 25, and 35 MHz) as functions of time. During all experiments, incubation solutions and the crystal were preheated to and maintained at 37 °C.
After F and D reached steady state in PBS, 0.5 mL PEG-OVS/BSA microgels (dPCS =100–120 nm) were diluted by 50% with PBS and incubated with the crystal for 1 h. The crystal was then thoroughly washed with 30 mL PBS. After F and D again reached steady state, the crystal was incubated with 0.5 mL 100 mg/mL BSA (0.22 µm-filtered) for approximately 2 h. Following another 30 mL PBS wash, the crystal was incubated with 0.5 mL 2.5 mg/mL bFg (0.22 µm-filtered) for 90 min. A final wash with 30 mL PBS was conducted until steady state. Control experiments were conducted similarly, with 100 mg/mL BSA substituted for microgels. Between all experiments, the instrument was thoroughly cleaned with a 1% SDS solution and DI water to remove any residual material.
F and D results corresponding to the 3rd, 5th, and 7th overtones were analyzed using Q-Tools software (version 2.1.6.134, Q-Sense) using a single-layer Voight (viscoelastic) model. Fluid density (1000 kg/m3) and fluid viscosity (6.915 × 10⁻⁴ kg/m-s), corresponding to PBS at 37°C, were kept fixed. Using optical densities obtained from OWLS (mOWLS) analysis in conjunction with modeled Voight masses (mQCM),[41, 42] corresponding layer densities were estimated as:
| [4] |
Our previous measurement of the volume fraction solid for PEG-OVS/BSA macrogels was used to estimate ρmacrogel = 1.0335 g/cm3. Initially assuming layer densities of 1100 kg/m3, thickness, shear modulus, viscosity, and Voight mass of a deposited layer were modeled. In an iterative fashion, a new effective density was calculated from the Voight mass using equation 4 and used in the model to update parameters until solutions converged.
Atomic force microscopy (AFM, Nanoscope V multimode SPM, Veeco Instruments) was utilized in tapping mode in PBS. PEG-OVS/BSA coatings were applied to MPTS glass surfaces as described, with and without BSA capping. In situ surface imaging was performed using silicon nitride tips (Nanoprobe, Veeco) with drive frequencies of 7.5 ± 0.4 kHz, a nominal spring constant of 0.06 N m−1, and scan rates of 1–1.2 Hz.
3. Results
3.1. Characterization of microgel formation
Amines within BSA or PEG-OA were crosslinked with vinylsulfone end-groups of PEG-OVS through a Michael-type conjugate addition reaction, forming PEG-OVS/BSA or PEG-OVS/ PEG-OA microgel solutions, respectively. The protocol for microgel formation and covalent attachment to glass surfaces is outlined in Figure 1. Microgels were formed by combining 200 mg/mL solutions of either BSA or PEG-OA with 200 mg/mL PEG-OVS at an amine to vinylsulfone ratio of 1:1. Additionally, some PEG-OVS/BSA microgels were formed at an amine to vinylsulfone ratio of 0.4:1. When rotated at 37°C, the 0.4:1 and the 1:1 ratio PEG-OVS/BSA solutions reached the gel point after 44.6 ± 0.6 h and 7.0 ± 0.5 h, respectively. PEG-OVS/PEG-OA solutions mixed at a 1:1 ratio formed gels in 6.7 ± 0.3 h. The longer gelation time of the 0.4:1 ratio was beneficial for microgel characterization, while the 1:1 ratio was employed for a more rapid microgel formation protocol. Regardless of the ratio used, an exponential increase in PEG-OVS/BSA microgel mean effective diameter with time was observed by dynamic light scattering (DLS) until gelation (Fig. 2a,b). PEG-OVS/BSA microgels were not detected by DLS until reaching a dPCS of 31.6± 4.5 nm, which occurred after approximately 50% of the total gelation time. The largest detectable PEG-OVS/BSA dPCS prior to gelation was 159.3 ± 16.5 nm. Note that the measured mean effective diameters (dPCS) are intensity-weighted and thus monomers, dimers and other small aggregates will contribute very little to this average. The intensity-weighted measurement was a highly reproducible measure of microgel formation, but the dPCS should not be confused with the more physically meaningful number-weighted or volume-weighted mean particle sizes.
Figure 1.

Crosslinking of bovine serum albumin (BSA) and poly(ethylene glycol)-octavinylsulfone (PEG-OVS, MW 10,000) may lead to microgel formation if the principle of equal end-group reactivity does not apply. Vinylsulfone groups on PEG molecules undergo a Michael-type addition with solvent-exposed and sterically accessible lysines on BSA, forming covalent linkages at neutral pH. If the crosslinking reaction is slowed before the gel point by dilution, microgel-containing solutions can be rapidly reacted with nucleophile-derivatized surfaces, such as thiol-silanized glass.
Figure 2.

Evidence for formation of microgels during the crosslinking reaction: a) Dynamic light scattering (DLS) with intensity-weighted (dPCS) and volume-weighted mean effective diameters of reacting PEG-OVS/BSA solutions (0.4:1 ratio of BSA amine groups to PEG vinylsulfone groups, 44 h gel time). b) NMR was used to measure the kinetics of end-group conversion during the reaction of PEG-OVS with PEG-octaamine (both MW 10,000; 1:1 ratio of PEG-OA to PEG-OVS, 6.5 h gel time). The time scales of both (a) and (b) were normalized relative to their respective gel times and error bars display the standard deviations for 4 separate reactions. c) SDS-PAGE of BSA during the crosslinking reaction with PEG-OVS. d) Analysis of the 2nd order reaction kinetics for part (c) for two separate experiments (circles: first experiment; squares: second experiment; ordinate units: L/mol·h).
An exponential increase in the percentage of reacted vinylsulfone groups was observed by NMR during the formation of PEG-OVS/PEG-OA microgels (Fig. 2a,b). Only 4.6% ± 3.3% of available vinylsulfone groups had reacted after reaching 50% of the gelation time, while 64.0% ± 2.4% was the highest detectable end-group conversion prior to gelation. The rate of reaction of BSA with PEG-OVS was calculated from SDS-PAGE. BSA was reacted with PEG-OVS at the 0.4:1 amine to vinylsulfone ratio, and samples were collected at various timepoints for separation by SDS-PAGE. Crosslinking of BSA with PEG-OVS was apparent within 1 min of the start of the reaction, while unreacted BSA was no longer evident after 20 h, corresponding to the time at which correlograms became reliable by DLS (Fig. 2c). After 84% of the gelation time had passed (38 h), there was no detectable BSA with a molecular weight below 131 kD. This timepoint corresponded to a dPCS of about 100 nm, a degree of crosslinking that was used in most subsequent experiments. Concentrations of unreacted BSA were estimated from the SDS-PAGE gels and analyzed using the method of integration for second-order reactions with different stoichiometries [39], revealing a reaction rate constant of 3.15 ± 0.11 × 10⁻³ M−1s−1 for the reaction of free BSA with PEG-OVS (Fig. 2d).
3.2. Modeling microgel formation
Monte Carlo simulations of the reaction between PEG-OA and PEG-OVS demonstrated that lower intermolecular reactivities, perhaps due to steric stabilization between growing polymer chains, may explain the presence of microgels during the crosslinking reaction (Figure 4 A–C). As an estimate of the effects of steric stabilization on the reactivity of polymer end-groups, the probability of a reaction occurring was scaled to (# macromers)−3/5, i.e. the reactivity of end-groups decreased as the radius of gyration increased. The rationale for this choice was that in a growing microgel, groups closer to the surface may be more likely to react. Thus, reactivity may scale with the ratio of surface area to volume (i.e. 3/r). In a single multiarm PEG, it may be assumed that all of the arms are equally likely to react (reactivity = χ0). Normalizing to monomers, larger aggregates of multiarm PEG should have fewer reactive groups at the surface, with overall normalized reactivity χ/χ0 that scales as r0/r. Given some measure of polymer size such as radius of gyration (Rg), reactivity should then scale as Rg,0/Rg. In a good solvent, the radius of gyration scales with the molecular weight raised to the 3/5 power [43]. If χ0 is set to 1, reactivity will scale with (# macromers)−3/5.
Figure 4.

AFM analysis of: (A) MPTS glass, 10 × 10 microns, (B) PEG-OVS/BSA microgel-coated MPTS glass, 10 × 10 microns , (C) PEG-OVS/BSA microgel-coated MPTS glass with BSA capping step, 10 × 10 microns, (D) PEG-OVS/ BSA microgel-coated MPTS glass, 3 × 3 microns with height profiles. The height data scales are 20 nm for (A), 30 nm for (B) and (D), and 120 nm for (C).
It was found that lowering the end-group reactivity of larger polymer chains decreased the number of monomers and dimers when p > 0.14 (i.e. past the theoretical gel point; pgel = 0.1429, pgel is the end-group conversion at the gel point) and promoted the formation of 10–100 mers (Figures 3A and 3B). At the same time, the formation of large aggregates was suppressed well past the theoretical gel point (Figure 3C) [38]. Distributions of chain sizes just prior to the gel point are also shown (Figure 3D–F). To validate the simulation, we compared the results without steric stabilization with the Flory-Stockmayer equation, demonstrating excellent agreement (Supplementary Fig. 2).
Figure 3.

Monte Carlo simulation of the reaction between PEG-OVS and PEG-OA suggested a mechanism for microgel formation: (A–C) The weight fraction of polymer chains with 1–2, 3–9, 10–100, 101–1000 or >1000 mers is shown. The simulation assumed: (A,C) equal reactivity of functional groups regardless of polymer size (Flory-Stockmayer), or (B,C) reactivity scaled as (mol. wt.)−3/5, an estimate of the effects of steric stabilization. With equal reactivity of end groups, monomers and dimers are present in large amounts even well past the theoretical gel point (pgel = 0.1429, the end-group conversion at the gel point). For equally reactive end groups, polymer chains with 10–100 monomer units were never more prevalent than monomers and dimers. With steric stabilization considered, large polymer chains were not present until p > 0.23, indicating a delay in gelation well past pgel. At p= 0.21–0.23, greater than 60% of the mass of polymer was contained in 10–100 mer chains. (D–F) The distribution of polymer sizes just prior to the gel point without (D) and with steric stabilization considered (E, F).
3.3. Covalent attachment of microgels to glass surfaces
The following steps were utilized to covalently attach microgel coatings to glass: 1) oxygen-plasma etching, 2) silanization with mercaptopropyltrimethoxysilane (MPTS), 3) 1 h incubation with a dilute microgel suspensions in PBS pH 7.4 at 37°C, and 4) overnight incubation with 50 mg/mL BSA. Microgels with dPCS between 100–120 nm were the largest microgels capable of reacting with the MPTS functionalized surfaces at a 1:1 dilution within 1 h without a noticeable increase in size as measured by DLS at the end of the reaction. This dPCS was chosen to maximize the amount of PEG attached to the surface while minimizing the risk of macrogelation on the surface. The presence of microgel coatings on the glass surfaces was verified by XPS (Table 1). After application of the microgel coating, the Si atomic concentration of the surfaces decreased from 27.4% to 1.03%, and the N/Si ratio of the surfaces increased by over 600-fold. The microgel-coated surfaces contained more nitrogen than anticipated for PEG alone (theoretical atomic composition of PEG: 66.7% C, 33.3% O, 0% N,) and more carbon than anticipated for BSA alone (theoretical atomic composition of BSA: 63.6% C, 19.4% O, 16.9 % N). Using the measured C/N atomic ratio, a BSA-capped microgel layer was estimated to be 71.4% BSA and 28.6% PEG. The nature of the microgel coating on the surfaces of MPTS functionalized glass was also studied by atomic force microscopy (AFM) in PBS. By AFM, the uncapped PEG-OVS/BSA microgel coatings appeared to consist of coalesced spheres with diameters smaller than 100 nm (Figure 4B & 4D). Although some areas on the microgel-coated surfaces appear to be uncovered, these areas are only a few nanometers lower than the rest of the surface. After addition of the BSA capping layer, the resolution of the images decreased dramatically, perhaps due to the excess of negative charges on BSA (Figure 4C).
Table 1.
Elemental composition of treated glass surfaces, as determined by XPS.
| Surface | Atomic Conc. (%) | Atomic Ratios | ||||||
|---|---|---|---|---|---|---|---|---|
| O | N | C | S | Si | C/N | C/O | N/Si | |
| O2 Plasma | 59.16 | 0.59 | 10.34 | 0.47 | 26.52 | 17.53 | 0.17 | 0.02 |
| MPTS | 54.00 | 0.88 | 15.47 | 1.11 | 27.43 | 17.58 | 0.29 | 0.03 |
| Microgel | 18.02 | 12.62 | 67.37 | 0.7 | 1.03 | 5.34 | 3.74 | 12.25 |
3.4. Properties and protein adsorption resistance of PEG-OVS/BSA microgel coatings
The optical mass and protein adsorption resistance of microgel coatings was quantified with OWLS. Since OWLS has an upper limit of sensitivity above the waveguide surface [44], vapor silanization was employed instead of solution silanization, to limit silane aggregation. Solutions of PEG-OVS/BSA microgels (dPCS = 100–120 nm) were flowed over Si/Ti/O2 or MPTS waveguide surfaces, resulting in surface mass densities of 115.0±0.7 ng/cm2 and 267.38±8.58 ng/cm2, respectively. Resistance to protein adsorption was tested by comparing the adsorption of bovine fibrinogen (bFg) on MPTS surfaces to BSA-capped PEG-OVS/BSA microgel surfaces. While bFg readily adsorbed to the MPTS surface at 201.9 ± 1.2 ng/cm2, no detectable change in refractive index was observed for the microgel surface when switching from the PBS solution to the 2.5 mg/mL bFg solution in PBS (Fig. 5a). To verify that the microgel coated OWLS waveguide chip was still sensitive to refractive index changes above the microgel surface, the adsorption experiment was repeated with an 8-fold higher concentration of bFg (a thick coating, e.g. > 200 nm, could prevent detection of protein on or above the coating) [45]. The refractive index of the 20 mg/mL bFg solution was 0.0042 higher than PBS alone, and this difference in refractive index was detected by OWLS when switching from PBS to 20 mg/mL bFg in PBS on the microgel surface, indicating that the coating was thin enough to detect changes on the surface (Fig. 5b). After switching the solution back to PBS and DI water for washing, only 4.1 ± 0.9 ng/cm2 of bFg was detected in comparison to 192 ± 3.3 ng/cm2 on the MPTS surface under the same conditions.
Figure 5.

OWLS analysis of fibrinogen adsorption to microgel-coated surfaces. Si/Ti/O2 surfaces of OWLS waveguide chips were oxygen-plasma etched, vapor-silanized with MPTS, and incubated with PEG-OVS/BSA microgels (dPCS = 100–120 nm). The adsorption of bovine fibrinogen (bFg) from: a) 2.5 mg/mL, or b) 20 mg/mL solutions onto microgel-coated surfaces was monitored. All surfaces were exposed to the same series of solutions flowing at 0.1 mL/min at 37°C: (1) DI water, (2) PBS pH 7.4, (3) 2.5 mg/mL or 20 mg/mL bovine fibrinogen in PBS pH 7.4, (4) wash with PBS, pH 7.4, and (4) wash with DI water. The higher concentration of bovine fibrinogen in part b demonstrated that the microgel layer was thin enough to detect protein above the microgel coating.
QCM-D was used to monitor microgel coatings on MPTS surfaces. Quartz sensors were silanized in solution with MPTS prior to QCM-D analysis. Microgel coatings were formed on the surfaces using the same protocol as for glass slides, including the final capping step with BSA. Incubations with microgel solutions (dPCS = 100–120 nm), BSA solutions, and bFg solutions were all performed within the QCM-D itself (Fig. 6). By combining OWLS-measured optical masses with QCM-D frequency and dissipation measurements, the thickness, Voight mass, shear viscosity, and elastic modulus of the coatings were calculated (Table 2). Comparison between the optical mass and Voight mass for PEG-OVS/BSA microgels revealed the presence of a highly hydrated coating ( ~97% water). Measurements of protein adsorption on the microgel-coated surfaces correlated well between OWLS and QCM analysis, revealing negligible changes in effective refractive index or frequency, respectively, after incubation with fibrinogen solutions. None of the differences in the calculated parameters were found to be statistically significant when comparing BSA-capped PEG-OVS/BSA microgels before and after incubation with fibrinogen.
Figure 6.

QCM-D frequency and dissipation changes illustrating the attachment of microgels to the MPTS-silanized crystal and subsequent resistance to non-specific protein adsorption. The following solutions were flowed over the crystal: (1) 0.5 mL of BSA/PEG-OVS microgels (dPCS = 100–120 nm) flowed onto the crystal and then incubated for 60 min. (2) 30 mL wash with PBS and incubation with PBS until readings stabilized. (3) 0.5 mL of 100 mg/mL BSA flowed over the crystal and incubated for about 90 minutes. (4) 30 mL wash with PBS and incubation with PBS until readings stabilized. (5) 0.5 mg/mL of 2.5 mg/mL bovine fibrinogen flowed over crystal and incubated for 2 h. (6) 30 mL wash and incubation with PBS until readings stabilized.
Table 2.
Physical properties of PEG-OVS/ BSA microgels measured with OWLS and QCM.
| PEG-OVS/BSA Microgels | PEG-OVS/BSA Microgels (BSA cap) | PEG-OVS/BSA Microgels (BSA cap) + bFg | |
|---|---|---|---|
| Optical mass (ng/cm2) | 267.3±8.5 | 532.6±77.0 | 579.4±5.9 |
| Density (kg/m3) | 1001.2±0.1 | 1002.6±0.2 | 1002.7±0.5 |
| Thickness (nm) | 75.2±8.6 | 65.7±5.4 | 71.0±12.0 |
| Voight mass (ng/cm2) | 7523.7±855.6 | 6582.3±544.5 | 7122.3±1197.1 |
| Elastic Shear Modulus (kPa) | 16.1±11.5 | 16.3±8.8 | 15.9±10.1 |
| Shear Viscosity (cP) | 1.1±0.2 | 1.2±0.2 | 1.2±0.2 |
3.5. Resistance of microgel-coated glass to cell adhesion
Glass slides were coated with microgel solutions and incubated with CHO, fibroblast and endothelial cells to test for resistance to cell adhesion and spreading. CHO cells and fibroblasts readily adhere to materials, while endothelial cells are relevant to use of the coatings on a blood-contacting materials. Phase contrast photomicrographs of cells adhered to PEG-OVS/BSA microgel coatings capped with BSA are displayed in Figure 7. All cell types adhered to and spread on MPTS surfaces and BSA-coated MPTS surfaces during the 24 h incubation period. While fewer cells adhered to the PEG-OVS grafted surfaces, no spread cells and few adhered cells were found on the microgel-coated surfaces (Fig. 7). Long-term resistance to fibroblast adhesion was tested on BSA-capped PEG-OVS/BSA microgel-coated surfaces by reseeding cells onto surfaces every 2 days. Non-adherent fibroblasts were observed to clump into aggregates above the surfaces and the BSA-capped PEG-OVS/BSA microgels resisted cell adhesion for 19 days (Fig. 8). In contrast, extensive fibroblast adhesion was observed on non-silanized glass surfaces after the first day of incubation (Fig. 8, insets).
Figure 7.
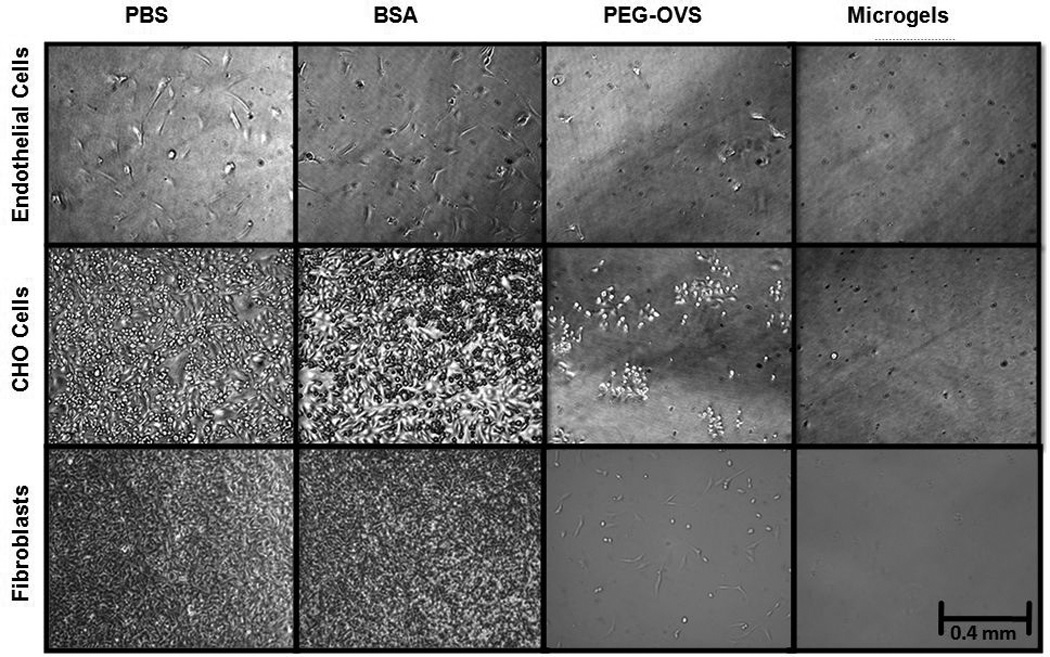
Cell adhesion on microgel-coated glass at 10× magnification after a 24 h incubation with endothelial (3.5 × 10⁴ cells/cm2), CHO (2.5 × 10⁵ cells/cm2), or fibroblast (2.5 × 10⁵ cells/cm2) cells. MPTS-silanized glass coverslips were incubated at 37°C with one of the following solutions: PBS for 12 h, 100 mg/mL BSA for 12 h, 100 mg/mL PEG-OVS for 12 h, or PEG-OVS/BSA microgels (dPCS = 100–120 nm) for 1 h followed by capping with 50 mg/mL BSA for 12 h.
Figure 8.

Cell adhesion to microgel-coated glass at 10× magnification after repeated seedings with fibroblasts after: a) 1 day, b) 5 days, and c) 19 days. MPTS surfaces coated with BSA-capped BSA/PEG-OVS microgels were washed and reseeded with fibroblasts every 2 days at 2.5 × 10⁵ cells/cm2. Cell spreading was not observed until 19 days, at which time aggregates of fibroblasts spread. Controls consisting of non-silanized glass incubated with BSA-capped BSA/PEG-OVS microgels are displayed in the lower right corner of each image at 10× magnification, showing complete cell spreading.
Cell adhesion and spreading was quantified on the treated surfaces (Fig. 9a, b). Although fibroblasts tended to spread more on the surfaces than CHO cells, no spread cells of any type were found on the microgel-coated slides. Capping the microgel surfaces with BSA resulted in a small, but insignificant decrease in cell adhesion compared to uncapped microgel coatings (Fig. 9c, Fig. 10b). PEG-OVS/PEG-OA microgel coatings capped with BSA displayed slightly more cell adhesion than PEG-OVS/BSA gels capped with BSA, but the difference was also not statistically significant (Fig. 9c, Fig. 10c). The resistance of BSA-capped PEG-OVS/BSA microgel coatings to CHO and fibroblast adhesion was not influenced by preincubation with fibrinogen immediately prior to cell seeding (Fig. 9a,b, Fig 10e). BSA-capped PEG-OVS/PEG-OA microgel coatings were less resistant to cell adhesion after incubation with fibrinogen solutions (Fig. 10f). Cell adhesion to PEG-OVS/BSA microgel coatings was promoted when a bovine fibrinogen cap was used instead of a BSA cap, suggesting the presence of reactive vinylsulfone groups in the coating before the capping step but not after(Fig. 9a, b, c, Fig. 10d). Compared to our previous results with a covalent layer-by-layer method,[3] the microgel coatings were far superior in preventing cell adhesion (Fig. 9c).
Figure 9.

Cell counting results for CHO and fibroblast adhesion to microgel surfaces. a) Comparison of CHO cell adhesion to MPTS-silanized glass incubated overnight with (in order from left to right): (1) PBS pH 7.4; (2) 50 mg/mL bovine serum albumin (BSA) in PBS; (3) 100 mg/mL PEG-OVS in PBS; (4–5) PEG-OVS/BSA microgels (dPCS = 100–120 nm), capped with (4) BSA or (5) bovine fibrinogen (bFg), and (6) PEG-OVS/BSA microgels (dPCS = 100–120 nm), capped with BSA then incubated with 2.5 mg/mL bFg in PBS for 2 h at 37°C. b) Fibroblast adhesion after the same surface treatments described in part a. c) CHO cell adhesion to MPTS-silanized glass reacted with: (in order from top to bottom): (1) 100 mg/mL PEG-OVS in PBS; (2) 20 PEG-OVS layers alternating with DTT applied using a layer-by-layer method; (3–4) PEG-OVS/PEG-OA microgels (dPCS = 100–120 nm) capped with (3) BSA; (4) BSA then incubated with bFg for 2 h; (5–8) PEG-OVS/BSA microgels (dPCS = 100–120 nm) that were capped with: (5) PEG-OVS, (6) BSA, (7) BSA, then incubated with bFg for 2 h, or (8) bFg. CHO and fibroblast cells were seeded at a density of 2.5 × 10⁵ cells/cm2 and incubated with the surfaces for 24 h at 37°C.
Figure 10.

10× magnification of CHO cell adhesion on glass slides for 24 h demonstrating the effects of the crosslinker and final capping step. MPTS-silanized glass was incubated with: a) 2.5 mg/mL bovine fibrinogen in PBS at pH 7.4 for 2 h, b) PEG-OVS/BSA microgels overnight in PBS pH 7.4 at 37°C, c) PEG-OVS/PEG-OA microgels capped overnight with 50 mg/mL BSA in PBS pH 7.4 at 37°C, d) PEG-OVS/BSA microgels capped overnight at 37°C with 2.5 mg/mL bovine fibrinogen in PBS pH 7.4, e) PEG-OVS/BSA microgels capped overnight with 50 mg/mL BSA and subsequently incubated for 2 h at 37°C with a 2.5 mg/mL bovine fibrinogen. f) PEG-OVS/PEG-OA microgels capped overnight with 50 mg/mL BSA and subsequently incubated for 2 h at 37°C with 2.5 mg/mL bovine fibrinogen.
3.6. Application of microgel coating to PET surfaces
Microgel coatings were applied to PET surfaces by a 2-step process and tested for cell adhesion. The first step was etching of the surface with air-plasma to provide a low surface density of amine groups [46]. The second step was incubation with a 1:3 dilution of PEG-OVS/ BSA microgel solutions (dPCS =40.1 ± 0.99 nm) for 12 h. A longer incubation time was utilized compared to the coating of thiol-functionalized surfaces due to the slower reaction between vinylsulfone and primary amines.[47] A diluted, smaller dPCS microgel solution was used to limit microgel growth over the 12 h incubation. Mean effective diameters were found to still be below 100 nm after the longer incubation period. Even without a capping step, microgel coatings on RFGD-PET demonstrated considerable resistance to CHO cell adhesion (2.3 ± 3.2 adhered cells/mm2) compared to RFGD-PET (1100 ± 216 cells/mm2), BSA-adsorbed RFGD-PET (850 ± 129 cells/mm2) and PEG-OVS grafted RFGD-PET (975 ± 95cells/mm2) (Fig. 11).
Figure 11.

CHO cell adhesion at 24 h to air RFGD-treated PET films that were incubated with: a) PBS, b) BSA, c) PEG-VS, or d) PEG-OVS/BSA microgels. 10× magnification.
4. Discussion
We have previously demonstrated that delivery of a signaling lipid from macroscopic PEG-OVS/BSA gels increased the migration rate of endothelial cells attached to the hydrogel surface via cell adhesion peptides [34, 48]. Here, we present a nanoscale version of this gel that can be covalently attached to biomaterials as a thin coating. The coatings were generated on surfaces by covalently attaching PEG-containing microgels under physiological conditions. This was achieved using a dip-coating methodology wherein thiol-functionalized glass was incubated with dilute microgel solutions to permit rapid attachment to surfaces within a timeframe that permitted minimal growth in microgel mean effective diameters. Compared with strategies that require spin coating, the dip-coating methodology may be useful for coating devices of varying size, shape and geometry. Because the microgels were attached to surfaces during the process of gelation, unreacted VS-groups remained available for additional crosslinking with a capping molecule. Capping of unreacted VS-groups with BSA or PEG-OA may increase the crosslink density within the coating and add a passivating surface layer. Using bioactive capping molecules, cellular responses may also be controlled.
The presence of a very broad distribution of polymer sizes during crosslinking is expected, but the distribution is likely different from that described by Flory and Stockmayer. This was particularly evident from the high end group conversion measured by NMR, which indicates significant intramolecular crosslinking (i.e. ramification) during crosslinking. The presence of particles with diameters greater than about 30 nm as observed by DLS and the spherical structures with diameters <≈100 nm observed by AFM also support the presence of microgels in the crosslinking solutions. According to Flory-Stockmayer theory, monomers and dimers should predominate at the gel point (Figure 3D). If all end groups were equally reactive, any single particle that grew to a significant size would rapidly subsume the other molecules. Additionally, molecular dynamics simulations have shown that chain flexibility alone leads to deviations from Flory-Stockmayer theory that result in microgel formation [49]. Microgel formation may be substantial in PEG hydrogels due to PEG’s flexibility and ability to promote steric stabilization. Monte Carlo simulations of hydrogel formation were performed to assess the size distributions that result for decreasing reactivity with increasing chain size. The simulation predicted an enhancement in the weight fraction of polymer chains between 10–100 mers, with a broad distribution found between 1 and 1000 mers just prior to the gel point. The presence of >50 wt% PEG particles sconsisting of 10–100 mers (mol. wt. 105–106) could explain the results observed by DLS and AFM. However, single angle DLS is not well-suited to analyze broad distributions of polymers, so further analysis using polymer fractionation and multi-angle laser light scattering is needed to validate the simulation.
NMR indicated that the rate of reaction actually increased as reactive groups were consumed. The exponential increase in the rate of reaction was correlated with the exponential increase in mean effective diameter measured by DLS. Clearly, intramolecular crosslinking is significant, as p = 0.64 was observed before gelation. This is only possible if intramolecular reactions were more likely than intermolecular reactions, since the gel point would otherwise be expected at p = 0.1428. While the number of crosslink sites in similar condensation gels has been determined by swelling measurements [50], detailed knowledge of the kinetics of crosslinking and microgel formation is sparse. However, NMR should be a useful tool in such studies. Additionally, if solvent conditions could be found such that all of the reactive groups within a microgel could be entirely consumed before gelation occurred, this would enhance the study of microgel size distributions.
We characterized microgel coatings by combining results from OWLS and QCM, which respectively measure the solid and liquid components of highly hydrated layers [42, 51]. Additionally, OWLS provided an independent measurement of optical masses that was used to increase confidence in viscoelastic QCM models [41, 42]. PEG-OVS/BSA hydrogel coatings were found to have a higher water content than hydrated protein layers, and the resulting density was much closer to that of water [42]. In comparison to hydrated laminin films that were previously characterized using the Voight model, the microgel coatings possessed a comparable thickness, but had a higher shear modulus and a slightly lower viscosity [52]. The increased shear modulus likely reflected the effects of covalent crosslinks within the hydrogel coatings versus non-covalent interactions in the multi-domain protein. AFM revealed the presence of coalesced spheres that were consistent with the size range of particles detected by DLS.
The relative role of BSA versus PEG in the resistance of the microgel coatings to cell adhesion is unknown. BSA-capped coatings were similar to PEG-OA-capped coatings in initial cell adhesion (Fig. 9c), but BSA-capped PEG-OVS/PEG-OA surfaces that were incubated with fibrinogen before cell seeding displayed some cell adhesion (Fig. 10f). The BSA-capped PEG-OVS/BSA microgels were the most robust, but it is possible that with further optimization an all-PEG system could perform equally well. The temporary non-fouling properties of adsorbed albumin films are well-documented in both in vitro and in vivo studies, [53–55] so it may emerge that PEG/albumin microgel coatings perform better than all-PEG systems. However, the albumin films may be subject to degradation by proteases and potential immunological responses. Switching the capping protein from BSA to fibrinogen led to cell adhesion, similar to Almany et al. who developed hydrogel scaffolds from PEGylated fibrinogen fragments to support smooth muscle cell and endothelial cell ingrowth [56]. In the current study, the entire fibrinogen protein was coupled without reduction of disulfide bonds. The use of whole proteins versus cell adhesion peptides may be advantageous in promoting specific cell adhesion and presents a multitude of options for new bioactive coatings.
Strong evidence has emerged for the advantages of high molecular weight, covalently attached PEG-containing polymers, lattices or microgels for producing thin layers that reduce cell adhesion. High molecular weight poly(L-lysine)-graft-poly(ethylene glycol) (PLL-g-PEG) adsorbed on surfaces reduces initial cell adhesion, but cell adhesion is observed over a period of two weeks [57]. Covalent linkage of PLL-g-PEG to aldehyde-functionalized PET may lead to more stable coatings [58]. Banerjee et al. used a comb copolymer of methyl methacrylate (MMA) and PEG-methacrylate (PEGMA)/methyl PEGMA, as well as a coalesced PMMA latex, to coat glass substrates to a thickness of 225 nm, which completely inhibited N46 fibroblast adhesion for 24 h [59]. More similar to the current study, Groll et al. tested star-PEG molecules with six isocyanate-terminated arms in which crosslinking was initiated just prior to spin-coating on substrates to a thickness of 30 nm. Both osteogenic sarcoma (SaOS) cells and human fibroblasts did not adhere to either of the coated substrates at 24 h [60]. Crosslinking of star PEG during attachment to surfaces is expected to result in higher coating densities and surface coverage [61]. Nolan et al. fabricated theromoresponsive microgel particles that were about 200 nm in diameter at 37°C and comprised of poly(N-isopropylacrylamide-co-acrylic acid) (pNIPAm-co-AAc) internally-crosslinked with PEG-diacrylate. When spin coated on aminofunctionalized glass, microgels with 5 mol% PEG 700 significantly reduced 3T3 fibroblast adhesion over 72 h [62]. More recently, similar microgels were reacted onto benzophenone-functionalized PET discs, which successfully inhibited IC-21 macrophage adhesion over 48 h [27]. Although synthesis and characterization is challenging, the potential for such nanoscale coatings to enhance cell and protein resistance seems particularly promising. However, as improvements in coatings emerge, more challenging cell culture models may be warranted for evaluation prior to in vivo testing.
In testing the long-term resistance to cell adhesion in vitro, cell reseeding is advantageous. Drumheller et al. demonstrated that semi-interpenetrating network (semi-IPN) thin films containing a PEG-acrylate/acrylic acid copolymer, resisted fibroblasts cell adhesion for over two-weeks with reseeding every three days [63]. Additionally, semi-IPN films containing high MW PEG-acrylate or PEG-diol completely resisted fibroblast adhesion for up to 30 days with weekly reseeding [64]. The microgel coatings presented here, when capped with BSA, exhibited a resistance to cell adhesion for almost three weeks, with reseeding every two days. As more effective PEG coating strategies are developed, it would be advantageous if such reseeding protocols became standard for assessing cell adhesion resistance, as a first step towards in vivo testing.
5. Conclusion
We have fabricated and characterized PEG-OVS-based microgel solutions for use as protein and cell-resistant bioactive coatings. The microgel solutions were covalently reacted with biomaterial surfaces uaing a dip-coating methodology. The difference in nucleophilicity of thiols and primary amines was exploited to achieve the slow growth in microgel size and rapid attachment to surfaces. OWLS and QCM analysis demonstrated minimal protein adsorption on the capped films, while DLS, NMR and Monte Carlo simulations were used to begin to elucidate the mechanism for microgel formation. Cell adhesion and spreading were inhibited on microgel-coated glass and PET, but cell adhesion was promoted by a fibrinogen-capped coating. If the resistance to cell adhesion translates to blood compatibility, PEG-based microgels could be useful to produce bioactive barriers between blood and vascular devices.
Supplementary Material
Vapor-silanization procedure: (a) Samples within a covered polyethylene rack were placed inside a glass chamber containing 20 mL of 5% MPTS in acetone that was heated under reflux. (b) Photomicrograph of vapor-silanized MPTS glass reacted with microgels and seeded with CHO cells. No significant differences in resistance to cell adhesion were observed with vapor and solution-silanized glass.
Validation of Monte Carlo simulation, comparing the simulation to the Flory-Stockmayer equation (equation 1 in text). Monte Carlo simulation results are shown for the weight fraction of 2-mers (squares), 3-mers (circles), 5-mers (triangles) and 10-mers (diamonds). The corresponding theoretical predictions are shown as solid lines.
Acknowledgments
We gratefully acknowledge funding from NIH R01HL085364 (DLE), American Heart Association Predoctoral Fellowship 0715676Z (EAS), and the Center for Materials Innovation at Washington University in St. Louis (DLE). We are extremely grateful to Prof. Ashutosh Chilkoti, Prof. Stefan Zauscher, and Ryan Hill at Duke University (Biomedical Engineering and the Center for Biologically Inspired Materials & Material Systems) for use of the QCM-D.
Footnotes
Publisher's Disclaimer: This is a PDF file of an unedited manuscript that has been accepted for publication. As a service to our customers we are providing this early version of the manuscript. The manuscript will undergo copyediting, typesetting, and review of the resulting proof before it is published in its final citable form. Please note that during the production process errors may be discovered which could affect the content, and all legal disclaimers that apply to the journal pertain.
Contributor Information
Evan A. Scott, Department of Biomedical Engineering and Center for Materials Innovation, Washington University in St. Louis, Campus Box 1097, One Brookings Dr., St. Louis, MO 63105
Michael D. Nichols, Department of Biomedical Engineering and Center for Materials Innovation, Washington University in St. Louis, Campus Box 1097, One Brookings Dr., St. Louis, MO 63105
Lee H. Cordova, Department of Biomedical Engineering and Center for Materials Innovation, Washington University in St. Louis, Campus Box 1097, One Brookings Dr., St. Louis, MO 63105
Brandon J. George, Department of Biomedical Engineering and Center for Materials Innovation, Washington University in St. Louis, Campus Box 1097, One Brookings Dr., St. Louis, MO 63105
Young-Shin Jun, Department of Energy, Environment and Chemical Engineering and Center for Materials Innovation, Washington University in St. Louis, Campus Box 1097, One Brookings Dr., St. Louis, MO 63105.
Donald L. Elbert, Department of Biomedical Engineering and Center for Materials Innovation, Washington University in St. Louis, Campus Box 1097, One Brookings Dr., St. Louis, MO 63105.
References
- 1.Jeon S, Lee J, Andrade J, DeGennes P. Protein Surface Interactions in the Presence of Polyethylene Oxide .1. Simplified Theory. Journal of Colloid and Interface Science. 1991;142:149–158. [Google Scholar]
- 2.Elbert D, Hubbell J. Surface treatments of polymers for biocompatibility. Annual Review of Materials Science. 1996;26:365–394. [Google Scholar]
- 3.Kim J, Wacker BK, Elbert DL. Thin polymer layers formed using multiarm poly(ethylene glycol) vinylsulfone by a covalent layer-by-layer method. Biomacromolecules. 2007;8:3682–3686. doi: 10.1021/bm700756z. [DOI] [PubMed] [Google Scholar]
- 4.Lopez GP, Ratner BD, Tidwell CD, Haycox CL, Rapoza RJ, Horbett TA. Glow discharge plasma deposition of tetraethylene glycol dimethyl ether for fouling-resistant biomaterial surfaces. J Biomed Mater Res. 1992;26:415–439. doi: 10.1002/jbm.820260402. [DOI] [PubMed] [Google Scholar]
- 5.Cao L, Sivaprasad S, Ratner BD, Horbett TA. Glow discharge plasma treatment of polyethylene tubing with tetraglyme results in ultralow fibrinogen adsorption and greatly reduced platelet adhesion. Journal of Biomedical Materials Research Part A. 2006;79A:788–803. doi: 10.1002/jbm.a.30908. [DOI] [PubMed] [Google Scholar]
- 6.Hill-West JL, Chowdhury SM, Slepian MJ, Hubbell JA. Inhibition of thrombosis and intimal thickening by in situ photopolymerization of thin hydrogel barriers. Proc Natl Acad Sci U S A. 1994;91:5967–5971. doi: 10.1073/pnas.91.13.5967. [DOI] [PMC free article] [PubMed] [Google Scholar]
- 7.Kizilel S, Sawardecker E, Teymour F, Perez-Luna VH. Sequential formation of covalently bonded hydrogel multilayers through surface initiated photopolymerization. Biomaterials. 2006;27:1209–1215. doi: 10.1016/j.biomaterials.2005.08.025. [DOI] [PubMed] [Google Scholar]
- 8.Billinger M, Buddeberg F, Hubbell JA, Elbert DL, Schaffner T, Mettler D, et al. Polymer stent coating for prevention of neointimal hyperplasia. The Journal of invasive cardiology. 2006;18:423–426. discussion 7. [PubMed] [Google Scholar]
- 9.Lussi JW, Falconnet D, Hubbell JA, Textor M, Csucs G. Pattern stability under cell culture conditions--A comparative study of patterning methods based on PLL-g-PEG background passivation. Biomaterials. 2006;27:2534–2541. doi: 10.1016/j.biomaterials.2005.11.027. [DOI] [PubMed] [Google Scholar]
- 10.Banerjee P, Irvine DJ, Mayes AM, Griffith LG. Polymer latexes for cell-resistant and cell-interactive surfaces. Journal of Biomedical Materials Research. 2000;50:331–339. doi: 10.1002/(sici)1097-4636(20000605)50:3<331::aid-jbm6>3.0.co;2-t. [DOI] [PubMed] [Google Scholar]
- 11.Irvine DJ, Mayes AM, Griffith LG. Nanoscale Clustering of RGD Peptides at Surfaces Using Comb Polymers. 1. Synthesis and Characterization of Comb Thin Films. Biomacromolecules. 2001;2:85–94. doi: 10.1021/bm005584b. [DOI] [PubMed] [Google Scholar]
- 12.Hyun J, Ma H, Zhang Z, P BT, A C. Universal Route to Cell Micropatterning Using an Amphiphilic Comb Polymer. Advanced Materials. 2003;15:576–579. [Google Scholar]
- 13.Zhang Z, Ma H, Hausner DB, Chilkoti A, Beebe TP. Pretreatment of Amphiphilic Comb Polymer Surfaces Dramatically Affects Protein Adsorption. Biomacromolecules. 2005;6:3388–3396. doi: 10.1021/bm050446d. [DOI] [PubMed] [Google Scholar]
- 14.Kuhl PR, Griffith-Cima LG. Tethered epidermal growth factor as a paradigm for growth factor-induced stimulation from the solid phase. Nat Med. 1996;2:1022–1027. doi: 10.1038/nm0996-1022. [DOI] [PubMed] [Google Scholar]
- 15.Groll J, Haubensak W, Ameringer T, Moeller M. Ultrathin coatings from isocyanate terminated star PEG prepolymers: Patterning of proteins on the layers. Langmuir. 2005;21:3076–3083. doi: 10.1021/la047438n. [DOI] [PubMed] [Google Scholar]
- 16.Hoffmann J, Groll J, Heuts J, Rong HT, Klee D, Ziemer G, et al. Blood cell and plasma protein repellent properties of Star-PEG-modified surfaces. Journal of Biomaterials Science-Polymer Edition. 2006;17:985–996. doi: 10.1163/156856206778366059. [DOI] [PubMed] [Google Scholar]
- 17.Amirpour ML, Ghosh P, Lackowski WM, Crooks RM, Pishko MV. Mammalian Cell Cultures on Micropatterned Surfaces of Weak-Acid, Polyelectrolyte Hyperbranched Thin Films on Gold. Anal Chem. 2001;73:1560–1566. doi: 10.1021/ac000907f. [DOI] [PubMed] [Google Scholar]
- 18.Ghosh P, Lackowski WM, Crooks RM. Two new approaches for patterning polymer films using templates prepared by microcontact printing. Macromolecules. 2001;34:1230–1236. [Google Scholar]
- 19.Lackowski WM, Ghosh P, Crooks RM. Micron-Scale Patterning of Hyperbranched Polymer Films by Micro-Contact Printing. J Am Chem Soc. 1999;121:1419–1420. [Google Scholar]
- 20.Funke W, Okay O, Joos-Muller B. Microgels - Intramolecularly crosslinked macromolecules with a globular structure. Microencapsulation - Microgels - Iniferters. 1998;136:139–234. [Google Scholar]
- 21.Metanomski WV. Compendium of Macromolecular Nomenclature: The Purple Book. Oxford: Blackwell Science; 1991. [Google Scholar]
- 22.Aleman J, Chadwick AV, He J, Hess M, Horie K, Jones RG, et al. Definitions of terms relating to the structure and processing of sols, gels, networks, and inorganic-organic hybrid materials (IUPAC Recommendations 2007) Pure and Applied Chemistry. 2007;79:1801–1827. [Google Scholar]
- 23.Baker WO. Microgel, A New Macromolecule - Relation to sol and gel as structural elements of synthetic rubber. Industrial and Engineering Chemistry. 1949;41:511–520. [Google Scholar]
- 24.Smith WV, Ewart RH. Kinetics of emulsion polymerization. J Chem Phys. 1948;16:592–599. [Google Scholar]
- 25.Gan DJ, Lyon LA. Synthesis and protein adsorption resistance of PEG-modified poly(N-isopropylacrylamide) core/shell microgels. Macromolecules. 2002;35:9634–9639. [Google Scholar]
- 26.Nolan CM, Reyes CD, Debord JD, Garcia AJ, Lyon LA. Phase transition behavior, protein adsorption, and cell adhesion resistance of poly(ethylene glycol) cross-linked microgel particles. Biomacromolecules. 2005;6:2032–2039. doi: 10.1021/bm0500087. [DOI] [PubMed] [Google Scholar]
- 27.Singh N, Bridges AW, Garcia AJ, Lyon LA. Covalent tethering of functional microgel films onto poly(ethylene terephthalate) surfaces. Biomacromolecules. 2007;8:3271–3275. doi: 10.1021/bm700516v. [DOI] [PubMed] [Google Scholar]
- 28.Graham NB, Mao JW. Microgels .2. Solution polymerization using a urethane stepgrowth mechanism. Colloids and Surfaces a-Physicochemical and Engineering Aspects. 1996;118:211–220. [Google Scholar]
- 29.Graham NB, Mao JW, Urquhart A. Microgels .4. The preparation of novel microgels and their applications. Angewandte Makromolekulare Chemie. 1996;240:113–121. [Google Scholar]
- 30.Graham NB, Cameron A. Nanogels and microgels: The new polymeric materials playground. Pure and Applied Chemistry. 1998;70:1271–1275. [Google Scholar]
- 31.de Groot JH, Zurutuza A, Moran CR, Graham NB, Hodd KA, Norrby S. Water-soluble microgels made by radical polymerization in solution. Colloid and Polymer Science. 2001;279:1219–1224. [Google Scholar]
- 32.Flory PJ. Kinetics of polyesterification: A study of the effects of molecular weight and viscosity on reaction rate. J Am Chem Soc. 1939;61:3334–3340. [Google Scholar]
- 33.Flory PJ. Molecular Size Distribution in Three Dimensional Polymers. I. Gelation. J Am Chem Soc. 1941;63:3083–3090. [Google Scholar]
- 34.Wacker BK, Scott EA, Kaneda MM, Alford SK, Elbert DL. Delivery of sphingosine 1-phosphate from poly(ethylene glycol) hydrogels. Biomacromolecules. 2006;7:1335–1343. doi: 10.1021/bm050948r. [DOI] [PMC free article] [PubMed] [Google Scholar]
- 35.Elbert DL, Hubbell JA. Conjugate addition reactions combined with free-radical cross-linking for the design of materials for tissue engineering. Biomacromolecules. 2001;2:430–441. doi: 10.1021/bm0056299. [DOI] [PubMed] [Google Scholar]
- 36.Falk M, Thomas RE. Molecular size distribution in random polyfunctional condensation with or without ring formation: Computer simulation. Can J Chem. 1974;52:3285–3295. [Google Scholar]
- 37.Stockmayer WH. Theory of molecular size distribution and gel formation in branched-chain polymers. J Chem Phys. 1943;11:45–55. [Google Scholar]
- 38.Flory PJ. Principles of polymer chemistry. Ithaca: Cornell University Press; 1953. [Google Scholar]
- 39.Laidler K. Chemical Kinetics. 3rd ed. New York: Harper & Row, Inc.; 1987. [Google Scholar]
- 40.de Feijter JA, Benjamins J, Veer FA. Ellipsometry as a tool to study the ad-sorption of synthetic biopolymers at the air-water interface. Biopolymers. 1978;17:1759–1772. [Google Scholar]
- 41.Hook F, Kasemo B, Nylander T, Fant C, Sott K, Elwing H. Variations in coupled water, viscoelastic properties, and film thickness of a Mefp-1 protein film during adsorption and cross-linking: a quartz crystal microbalance with dissipation monitoring, ellipsometry, and surface plasmon resonance study. Anal Chem. 2001;73:5796–5804. doi: 10.1021/ac0106501. [DOI] [PubMed] [Google Scholar]
- 42.Voros J. The density and refractive index of adsorbing protein layers. Biophys J. 2004;87:553–561. doi: 10.1529/biophysj.103.030072. [DOI] [PMC free article] [PubMed] [Google Scholar]
- 43.de Gennes PG. Scaling Concepts in Polymer Physics. Ithaca, NY: Cornell University Press; 1979. [Google Scholar]
- 44.Picart C, Gergely C, Arntz Y, Voegel JC, Schaaf P, Cuisinier FJ, et al. Measurement of film thickness up to several hundreds of nanometers using optical waveguide lightmode spectroscopy. Biosens Bioelectron. 2004;20:553–561. doi: 10.1016/j.bios.2004.03.005. [DOI] [PubMed] [Google Scholar]
- 45.Lukosz W. Principles and Sensitivities of Integrated Optical and Surface-Plasmon Sensors for Direct Affinity Sensing and Immunosensing. Biosens Bioelectron. 1991;6:215–225. [Google Scholar]
- 46.Riccardi C, Barni R, Selli E, Mazzone G, Massafra MR, Marcandalli B, et al. Surface modification of poly(ethylene terephthalate) fibers induced by radio frequency air plasma treatment. Applied Surface Science. 2003;211:386–397. [Google Scholar]
- 47.Friedman M, Cavins JF, Wall JS. Relative Nucleophilic Reactivities of Amino Groups and Mercaptride Ions in Addition Reactions with alpha, beta-Unsaturated Compounds. Journal of American Chemical Society. 1965;87:3672–3682. [Google Scholar]
- 48.Wacker BK, Alford SK, Scott EA, Das Thakur M, Longmore GD, Elbert DL. Endothelial cell migration on RGD-peptide-containing PEG hydrogels in the presence of sphingosine 1-phosphate. Biophys J. 2008;94:273–285. doi: 10.1529/biophysj.107.109074. [DOI] [PMC free article] [PubMed] [Google Scholar]
- 49.Hosono N, Masubuchi Y, Furukawa H, Watanabe T. A molecular dynamics simulation study on polymer networks of end-linked flexible or rigid chains. The Journal of Chemical Physics. 2007;127:164905–164909. doi: 10.1063/1.2790007. [DOI] [PubMed] [Google Scholar]
- 50.Metters A, Hubbell J. Network Formation and Degradation Behavior of Hydrogels Formed by Michael-Type Addition Reactions. Biomacromolecules. 2005;6:290–301. doi: 10.1021/bm049607o. [DOI] [PubMed] [Google Scholar]
- 51.Wittmer CR, Phelps JA, Saltzman WM, Van Tassel PR. Fibronectin terminated multilayer films: protein adsorption and cell attachment studies. Biomaterials. 2007;28:851–860. doi: 10.1016/j.biomaterials.2006.09.037. [DOI] [PMC free article] [PubMed] [Google Scholar]
- 52.Malmstrom J, Agheli H, Kingshott P, Sutherland DS. Viscoelastic modeling of highly hydrated laminin layers at homogeneous and nanostructured surfaces: quantification of protein layer properties using QCM-D and SPR. Langmuir. 2007;23:9760–9768. doi: 10.1021/la701233y. [DOI] [PubMed] [Google Scholar]
- 53.Chang TM. Removal of endogenous and exogenous toxins by a microencapsulated absorbent. Can J Physiol Pharmacol. 1969;47:1043–1045. doi: 10.1139/y69-170. [DOI] [PubMed] [Google Scholar]
- 54.Imai Y, Tajima K, Nose Y. Biolized materials for cardiovascular prosthesis. Trans Am Soc Artif Intern Organs. 1971;17:6–9. [PubMed] [Google Scholar]
- 55.Eberhart RC, Munro MS, Frautschi JR, Lubin M, Clubb FJ, Jr, Miller CW, et al. Influence of endogenous albumin binding on blood-material interactions. Ann N Y Acad Sci. 1987;516:78–95. doi: 10.1111/j.1749-6632.1987.tb33032.x. [DOI] [PubMed] [Google Scholar]
- 56.Almany L, Seliktar D. Biosynthetic hydrogel scaffolds made from fibrinogen and polyethylene glycol for 3D cell cultures. Biomaterials. 2005;26:2467–2477. doi: 10.1016/j.biomaterials.2004.06.047. [DOI] [PubMed] [Google Scholar]
- 57.Lussi JW, Falconnet D, Hubbell JA, Textor M, Csucs G. Pattern stability under cell culture conditions--a comparative study of patterning methods based on PLL-g-PEG background passivation. Biomaterials. 2006;27:2534–2541. doi: 10.1016/j.biomaterials.2005.11.027. [DOI] [PubMed] [Google Scholar]
- 58.Blattler TM, Pasche S, Textor M, Griesser HJ. High salt stability and protein resistance of poly(L-lysine)-g-poly(ethylene glycol) copolymers covalently immobilized via aldehyde plasma polymer interlayers on inorganic and polymeric substrates. Langmuir. 2006;22:5760–5769. doi: 10.1021/la0602766. [DOI] [PubMed] [Google Scholar]
- 59.Banerjee P, Irvine DJ, Mayes AM, Griffith LG. Polymer latexes for cell-resistant and cell-interactive surfaces. Journal of biomedical materials research. 2000;50:331–339. doi: 10.1002/(sici)1097-4636(20000605)50:3<331::aid-jbm6>3.0.co;2-t. [DOI] [PubMed] [Google Scholar]
- 60.Groll J, Fiedler J, Engelhard E, Ameringer T, Tugulu S, Klok HA, et al. A novel star PEG-derived surface coating for specific cell adhesion. J Biomed Mater Res A. 2005;74:607–617. doi: 10.1002/jbm.a.30335. [DOI] [PubMed] [Google Scholar]
- 61.Gasteier P, Reska A, Schulte P, Salber J, Offenhausser A, Moeller M, et al. Surface grafting of PEO-based star-shaped molecules for bioanalytical and biomedical applications. Macromol Biosci. 2007;7:1010–1023. doi: 10.1002/mabi.200700064. [DOI] [PubMed] [Google Scholar]
- 62.Nolan CM, Reyes CD, Debord JD, Garcia AJ, Lyon LA. Phase transition behavior, protein adsorption, and cell adhesion resistance of poly(ethylene glycol) cross-linked microgel particles. Biomacromolecules. 2005;6:2032–2039. doi: 10.1021/bm0500087. [DOI] [PubMed] [Google Scholar]
- 63.Drumheller PD, Elbert DL, Hubbell JA. Multifunctional poly(ethylene glycol) semi-interpenetrating polymer networks as highly selective adhesive substrates for bioadhesive peptide grafting. Biotechnology and Bioengineering. 1994;43:772–780. doi: 10.1002/bit.260430812. [DOI] [PubMed] [Google Scholar]
- 64.Drumheller PD, Hubbell JA. Densely crosslinked polymer networks of poly(ethylene glycol) in trimethylolpropane triacrylate for cell-adhesion-resistant surfaces. Journal of biomedical materials research. 1995;29:207–215. doi: 10.1002/jbm.820290211. [DOI] [PubMed] [Google Scholar]
Associated Data
This section collects any data citations, data availability statements, or supplementary materials included in this article.
Supplementary Materials
Vapor-silanization procedure: (a) Samples within a covered polyethylene rack were placed inside a glass chamber containing 20 mL of 5% MPTS in acetone that was heated under reflux. (b) Photomicrograph of vapor-silanized MPTS glass reacted with microgels and seeded with CHO cells. No significant differences in resistance to cell adhesion were observed with vapor and solution-silanized glass.
Validation of Monte Carlo simulation, comparing the simulation to the Flory-Stockmayer equation (equation 1 in text). Monte Carlo simulation results are shown for the weight fraction of 2-mers (squares), 3-mers (circles), 5-mers (triangles) and 10-mers (diamonds). The corresponding theoretical predictions are shown as solid lines.