

Abstract
S100A4, also known as mts1, is a member of the S100 family of Ca2+-binding proteins that is directly involved in tumor invasion and metastasis via interactions with specific protein targets, including nonmuscle myosin-IIA (MIIA). Human S100A4 binds two Ca2+ ions with the typical EF-hand exhibiting an affinity that is nearly 1 order of magnitude tighter than that of the pseudo-EF-hand. To examine how Ca2+ modifies the overall organization and structure of the protein, we determined the 1.7 Å crystal structure of the human Ca2+-S100A4. Ca2+ binding induces a large reorientation of helix 3 in the typical EF-hand. This reorganization exposes a hydrophobic cleft that is comprised of residues from the hinge region, helix 3, and helix 4, which afford specific target recognition and binding. The Ca2+-dependent conformational change is required for S100A4 to bind peptide sequences derived from the C-terminal portion of the MIIA rod with submicromolar affinity. In addition, the level of binding of Ca2+ to both EF-hands increases by 1 order of magnitude in the presence of MIIA. NMR spectroscopy studies demonstrate that following titration with a MIIA peptide, the largest chemical shift perturbations and exchange broadening effects occur for residues in the hydrophobic pocket of Ca2+-S100A4. Most of these residues are not exposed in apo-S100A4 and explain the Ca2+ dependence of formation of the S100A4–MIIA complex. These studies provide the foundation for understanding S100A4 target recognition and may support the development of reagents that interfere with S100A4 function.
S100A4, also called mts1, is a member of the S100 family of small, homodimeric, EF-hand Ca2+ binding proteins. S100 proteins are expressed in a tissue specific manner and bind to a variety of target proteins, resulting in the regulation of specific cellular processes, including cell-cycle regulation, protein phosphorylation, cell growth, motility, differentiation, and survival (1-4). While S100A4 is expressed in a wide range of normal tissues (5, 6), it is recognized that an increased level of S100A4 expression correlates with a high incidence of metastasis and poor prognosis for cancer patients (7, 8). High S100A4 expression levels are associated with several metastatic cancers, including breast (9), colorectal (10), bladder (11), esophageal (12), non-small cell lung (13), gastric (14), medulloblastoma (15), pancreatic (16), prostate (17), and thyroid (18). In colorectal cancer, S100A4 is a direct transcriptional target of the β-catenin–T-cell factor (TCF) complex (19), a component of the Wnt/β-catenin pathway that is frequently unregulated as a result of mutations that affect the phosphorylation and stabilization of β-catenin (20-22). In medulloblastoma, enhanced S100A4 expression occurs via ErbB2 signaling and the PI3K/Akt and Erk 1/2 pathways (15). These findings suggest that multiple signaling cascades can lead to elevated S100A4 levels.
S100A4-induced metastasis observed in vivo is thought to result from S100A4-mediated increases in motility and invasion observed at the cellular level (8, 19). At the molecular level, S100A4 is recognized as a Ca2+-activated switch (8, 23), which in the Ca2+-loaded form adopts a conformation that allows it to bind target proteins. Cytoskeletal and signaling targets of S100A4 include nonmuscle myosin-IIA (24, 25), tropomyosin (26), F-actin (27), and liprin β1, an interacting protein of the LAR family of transmembrane tyrosine phosphatases (28).
The Ca2+-dependent interaction of S100A4 with myosin-IIA prevents oligomerization and promotes the monomeric, unassembled state of myosin-IIA (29). This observation is consistent with data showing that the S100A4 binding site maps to the C-terminal end of the coiled coil of the myosin-IIA heavy chain (29) and that the S100A4 binding site overlaps the extended assembly competence domain, which is required for myosin-II assembly (30, 31). Furthermore, phosphorylation by casein kinase 2 on Ser1943 of the myosin-IIA heavy chain, which is downstream of the S100A4 binding site, inhibits S100A4 binding and protects against S100A4-induced disassembly of myosin-IIA filaments (29, 32). Thus, heavy chain phosphorylation, as well as Ca2+ binding, regulates the S100A4-myosin-IIA interaction. In addition, S100A4 modulates the polarization and motility of carcinoma cells through a direct interaction with myosin-IIA (33). This interaction likely plays a role in the contribution of S100A4 to metastasis (8).
The interaction of S100A4 with myosin-IIA is strictly Ca2+-dependent (25, 29). Similar to other S100 proteins, S100A4 is a symmetric homodimer with each subunit containing two EF-hand Ca2+-binding loops: a C-terminal typical EF-hand and an N-terminal pseudo-EF-hand comprised of 14 residues (instead of 12). The apo-S100A4 consists of four helices and a small β-sheet with two helices from each subunit (1, 4, 1′, and 4′) forming a tight X-type four-helix bundle that comprises the dimer interface (23). When Ca2+ binds, helix 3 in each S100A4 subunit rotates by ∼60° relative to helix 4 and exposes a hydrophobic cleft in a manner similar to that observed for other S100 proteins (34-36).
To further characterize the interaction between myosin-IIA and S100A4, we examined the binding of S100A4 to Ca2+ and peptides derived from the C-terminus of myosin-IIA. These data together with the X-ray structure of the Ca2+-S100A4 have allowed us to map the surface on Ca2+-activated S100A4 that interacts with myosin-IIA. Such information is necessary to understand the Ca2+ dependence of the S100A4–MIIA1 interaction and could be useful for understanding how S100A4 depolymerizes highly stable myosin-IIA filaments. These results could also aid in the design of S100A4 inhibitors, some of which may hold promise as therapeutic agents for metastatic cancers.
EXPERIMENTAL PROCEDURES
Bacterial Expression and Purification of Wild-Type and Δ13C S100A4
Full-length human S100A4 was cloned into the NdeI/BamHI sites of the pET23a protein expression vector (Novagen Inc.), and the recombinant protein was purified as described previously (29). Protein yields of full-length S100A4 were typically 20 mg of purified protein per liter of bacterial culture. The Δ13C S100A4, in which the 13 C-terminal residues were deleted, was cloned into the NdeI/HindIII sites of the pET23a vector. For NMR, the S100A4 protein preparation was modified such that defined medium was used with 15N-labeled NH4Cl and 13C6-labeled glucose as the only nitrogen and carbon sources, respectively, as described previously (23). Mass spectrometric analysis confirmed the purity of these proteins and indicated that the N-terminal methionine is not present in the purified protein (data not shown).
Peptides
The S100A4 C-terminal tail peptide (Ac-EFFEGFPDKQPRKK, corresponding to residues Glu88–Lys101 of S100A4), which comprises the immediate C-terminus of S100A4, was synthesized by Biosynthesis Inc. (Lewisville, TX). Myosin-IIA peptides (MIIA1908–1923, Ac-DAMNREVSSLKNKLRR-CONH2;FITC-MIIA1908–1923,FITC-Ahx-DAMNREVSSLKNKLRR-OH; MIIA1899–1923, Ac-ELEDATETADAMNREVSSLKNKLRR-CONH2; MIIA1893–1923, Ac-RRKLQRELEDATETADAMNREVSSLKNKLRR-CONH2) were synthesized by Biosynthesis Inc. The FITC peptide used as a probe is not amidated on the C-terminus and has an aminohexanoic acid (Ahx) linker prior to the start of the peptide sequence. The molecular weight and purity (>95%) of all peptides were verified using mass spectrometry and HPLC, respectively. The concentration values for all peptide solutions were determined by quantitative amino acid analysis.
For experiments with FITC-MIIA1908–1923, a 5 mM stock solution was prepared in 20 mM Tris (pH 7.5), 150 mM KCl, 1 mM DTT, and 0.02% NaN3, aliquoted, and stored at −80 °C. A C-terminal fragment of the human myosin-IIA heavy chain that corresponds to residues 1851–1960 (MIIA1851–1960) was cloned into the EcoRI/NdeI sites of pET23a. The myosin-IIA tail fragment (MIIA1851–1960) was expressed in BL21-CodonPlus competent cells without induction (Stratagene, Cedar Creek, TX). Cell pellets were collected, resuspended in a lysis buffer containing 50 mM Tris (pH 7.5), 10% glycerol, 300 mM KCl, 2 mM DTT, 1 mM EDTA, 1 mM PMSF, and chymostatin, leupeptin, and pepstatin (5 μg/mL each), and frozen at −80 °C. Thawed cell pellets were sonicated, heated to 95 °C for 25 min, cooled on ice, and spun at 27000g for 20 min. The resulting supernatant was dialyzed against 20 mM Tris (pH 7.5) and 0.02% NaN3 for subsequent purification on a High Q Sepharose anion exchange column. Fractions containing the myosin-IIA tail fragment were pooled and run on a Bio-Rad Bio-Scale Ceramic Hydroxyapatite type I column using a 0.005 to 0.4 M K2HPO4 gradient. The MIIA1851–1960 protein concentration was determined using the modified Lowry assay (Pierce) and a MIIA1851–1960 standard at a known concentration. The concentration of the MIIA1851–1960 standard was determined by amino acid analysis (Keck Biotechnology Resource Laboratory at Yale University, New Haven, CT).
Protein Crystallization
The protein was dialyzed into 20 mM Tris (pH 7.5), 20 mM KCl, 10 mM DTT, 20 mM CaCl2, and 0.02% NaN3 and concentrated to 20–30 mg/ mL (∼0.85–1.28 mM dimer) using a 3000 MWCO Millipore Amicon centrifugal concentrator. Prior to crystallization, prochlorperazine (PCP) was added to a final concentration of 5 mM. Diffraction quality crystals were obtained by hanging drop vapor diffusion at 21 °C by mixing 1 μL of S100A4 and PCP with 1 μL of reservoir solution containing 0.05 M ammonium sulfate, 0.05 M Bis-Tris (pH 6.5), and 27.5% pentaerythritol ethoxylate (15/4 EO/OH) and equilibrating the samples against reservoir solution for 2–3 weeks. Diffraction from these crystals is consistent with space group P3221 with two S100A4 chains per asymmetric unit and the following unit cell dimensions: a = b = 52.4 Å, c = 140.4 Å.
Structure Solution
Crystals of S100A4 with dimensions of 0.1 mm × 0.1 mm nitrogen. × 0.2 mm were flash-cooled in liquid Single anomalous dispersion (SAD) data (see Table 1) were collected at the X6A beamline (National Synchrotron Light Source, Brookhaven, NY) using an ADSC Q210 CCD detector (Area Detector Systems Corp., Poway, CA) and 1.7 Å wavelength radiation to enhance the anomalous signal from sulfur atoms and Ca2+ ions. Native data were collected on a Quantum 315 CCD detector (Area Detector Systems Corp.) with 1.0 Å wavelength radiation on the X29A beamline (National Synchrotron Light Source). Intensities were integrated using HKL2000 and reduced to amplitudes using TRUNCATE (37, 38). Experimental SAD phases were determined using SHELXD (39) and SHELXE (40), and the initial model was generated by the autobuilding algorithm in Arp/wArp (41). Further model building and refinement were performed with REFMAC and COOT (38, 42). The quality of the final structure was verified with composite omit maps,and the stereochemistry was checked with WHATCHECK (43) and PROCHECK (44). The final model contained two subunit chains of 96 residues each (Ala2–Gln97), four Ca2+ ions, and 226 water molecules with Rcryst and Rfree values of 0.197 and 0.222, respectively. PCP was not visible in either the initial experimental or final refined electron density maps, even though diffraction quality crystals appeared only in the presence of the inhibitor. The LSQKAB and SSM algorithms were used for structural superimpositions (38, 45). Structural similarity with other S100 family members was analyzed using DALI (46, 47). Interhelix angles and distances were calculated using INTERHLX (48). Quaternary structure and accessible surface areas were analyzed using the PISA server using a 4 Å cutoff (http://www.ebi.ac.uk/msd-srv/prot_int/cgi-bin/piserver). Molecular contacts were analyzed with the program CONTACT (38).
Table 1.
Dissociation Constants for Ca2+ Binding to S100A4
| [EF1] (μM) | [EF2] (μM) | |
|---|---|---|
| S100A4 (low salt) | 54.4 ± 10.8a | 3.3 ± 1.3a |
| S100A4 (high salt) | >500b | 2.6 ± 1.3b |
| S100A4 and MIIA1851–1960 (high salt) | 3.6 ± 0.2c | 0.26 ± 0.01c |
The dissociation constants for Ca2+ binding to each S100A4 EF-hand domain were determined by ITC under low-salt conditions [20 mM Tris (pH 7.5), 20 mM KCl, and 250 μM TCEP].
These values are from published studies (71). The dissociation constants for Ca2+ binding to each S100A4 EF-hand domain were determined using a 5,5′Br2-BAPTA competition assay under high-salt conditions [20 mM Tris (pH 7.5), 150 mM KCl, 1 mM DTT, and 0.02% NaN3].
The dissociation constants for Ca2+ binding to each S100A4 EF-hand domain in the presence of MIIA1851–1960 were determined using a 5,5′Br2-BAPTA competition assay under high-salt conditions [20 mM Tris (pH 7.5), 150 mM KCl, 1 mM DTT, and 0.02% NaN3].
NMR Spectroscopy
Purified S100A4 was dialyzed against Chelex-100-treated buffer, which included 0.1 mM Tris-d11 (pH 7.5) and 0.1 mM DTT, and then lyophilized, redissolved in a small aliquot of ddH2O, and stored at −80 °C. The Ca2+-loaded NMR samples contained an S100A4 subunit concentration of 0.25–1 mM, 0.34 mM NaN3, 8 mM NaCl, 16 mM Tris-d11, 0.1 mM EDTA, 6 mM DTT, 6 mM CaCl2, and 10% D2O. For all NMR samples, the pH was adjusted with cold HCl to 6.0 with continuous stirring. Prior to use, stock solutions of all buffer components were passed through a Chelex-100 column to remove any trace metals. NMR data were collected at 37 °C with either a Bruker DMX 600 NMR spectrometer (600.13 MHz for protons) or a Bruker Avance 800 US2 spectrometer (800.27 MHz for protons) both equipped with pulsed-field gradients, four frequency channels, and triple-resonance, z-axis gradient cryogenic probes. Unless otherwise stated,a1s relaxation delay was used and quadrature detection in the indirect dimensions was obtained with States–TPPI phase cycling (49). Data were processed on Linux workstations (Red Hat version 9.0) using the processing program NMRPipe (50). Time domain data in the indirect dimensions were extended by no more than one-third using standard linear prediction routines (51), except for data in constant time domains that were extended 2-fold using mirror-image linear prediction (52). All proton chemical shifts are reported with respect to the H2O or HDO signal taken as 4.658 ppm relative to external TSP (0.0 ppm) at 37 °C. The 13C and 15N chemical shifts were indirectly referenced using the following ratios of zero-point frequencies at 37 °C: 0.10132905 for 15N to 1H and 0.25144953 for 13C to 1H (53-55).
Uniformly 15N-labeled S100A4 was used to collect the two-dimensional (2D) 1H–15N fast HSQC spectrum (56), the three-dimensional (3D) 15N-edited NOESY-HSQC spectrum with a 100 ms mixing time (57), the 3D 15N-edited HOHAHA-HSQC spectrum with a 60 ms DIPSI-2rc spin-lock and a 10 kHz rf field strength (58, 59), and the 3D 15N-edited HMQC-NOESY-HSQC spectrum with a 125 ms mixing time (60). A uniformly 13C- and 15N-labeled S100A4 sample was used to conduct the 3D CBCA(CO)NH (61, 62), 3D HNCACB (63), 3D HN(CO)CA (64), and HNCA (65) triple-resonance NMR experiments. In all of the 15N-edited experiments, the fast-HSQC detection scheme was incorporated into the sequence to avoid water saturation, and undesired magnetization was alleviated using pulsed field gradients throughout the various NMR pulse sequences (66).
Thermodynamic Binding Studies
Binding of Ca2+ and myosin-IIA peptides to apo-S100A4 and Ca2+-S100A4, respectively, was analyzed by measuring heat changes using a VP-ITC titration microcalorimeter (MicroCal, Inc., Northampton, MA). All protein, peptide, and metal solutions were degassed under vacuum and equilibrated at 37 °C prior to titration. The sample cell (1.4 mL) contained 20 mM Tris (pH 7.5), 20 mM KCl, 250 μM TCEP, and 75 μM S100A4 in the Ca2+ titrations with c values ranging between 5 and 200. The S100A4-containing buffer described above was supplemented with 800 μM CaCl2 for titrations monitoring myosin-IIA peptide binding to Ca2+-S100A4. In all titrations, the reference cell contained water. Stock concentrations for injection of the titrant were 3 mM CaCl2 and 0.5 mM MIIA1893–1923, with all of the other buffer conditions matched to the sample. Solutions were injected in 5 μL aliquots using the default injection rate of 10 s with a 360 s interval between injections, which allowed the trace to return to baseline before the next injection. The resulting titration curves were corrected for the protein-free buffer control and analyzed using the Origin for ITC software supplied by MicroCal.
Fluorescence anisotropy measurements were performed at 22 °C using a Fluoromax-3 spectrofluorometer (Jobin Yvon Inc.). Individual reaction mixtures (200 μL) contained 100 nM FITC-MIIA1908–1923 and 0–30 μM S100A4 dimer in 20 mM Tris (pH 7.5), 150 or 20 mM KCl, 1 mM DTT, 0.02% NaN3, and 0.5 mM CaCl2. Anisotropy was measured with excitation at 494 nm and emission at 516 nm. Measurements were acquired at the magic angle corresponding to the angle of 55° between the vectors of polarization of the excitation and emission light using a G factor of 0.634 previously determined for FITC on this instrument. Competition assays with MIIA1893–1923 and MIIA1851–1960 contained 15 μM S100A4 dimer, 100 nM FITC-MIIA1908–1923, 0.3 mM CaCl2, and 0–40 and 0–30 μM peptide, respectively, in 20 mM Tris (pH 7.5), 150 or 20 mM KCl, 1 mM DTT, 0.02% NaN3, and 0.5 mM CaCl2. Controls included experiments representing maximum anisotropy (15 μM S100A4, 100 nM FITC-MIIA1908–1923, and calcium) and minimum anisotropy (100 nM FITC-MIIA1908–1923 and calcium). Experiments were performed in triplicate and results fit to a sigmoidal dose–response equation with a variable slope to obtain the EC50 value. Using this value, the dissociation constant for the peptides was obtained using the equation Kd = KdPEC50)/[S], where EC50 is the concentration at half-maximal binding of the competing peptide determined from fitting the raw data, KdP is the dissociation constant for binding of FITC-MIIA1908–1923 to S100A4, and [S] represents the concentration of S100A4 dimer.
Ca2+ binding affinities for EF1 and EF2 of S100A4 in the presence of myosin-IIA were determined using a 5,5′Br2-BAPTA competition assay as described previously (67). Calcium was titrated into a solution containing 25 μM 5,5′Br2-BAPTA, 12.5 μM S100A4 dimer, and 125 μM MIIA1851–1960 at 25 °C in 20 mM Tris (pH 7.5), 150 mM KCl, 1 mM DTT, and 0.02% NaN3, and the decrease in absorbance was monitored at 263 nm. The total amount of Ca2+ in the protein preparation was less than 0.1 mol of Ca2+/mol of protein. Using Caligator, averaged data from five titrations from four independent experiments were fit to two Ca2+ binding sites using a stepwise macroscopic binding equation in the presence of chelator (68).
Analytical Ultracentrifugation
Sedimentation equilibrium and velocity experiments were performed with a Beckman XL-I analytical ultracentrifuge equipped with absorbance optics and a Ti60 rotor at 25 °C. The sedimentation boundaries were monitored at 280 nm. Wild-type and Δ13C S100A4 were dialyzed into a buffer containing 20 mM Tris (pH 7.5), 150 mM KCl, 1 mM TCEP, 0.02% NaN3, and either 10 mM CaCl2 (Ca2+-bound) or 2 mM EDTA and 2 mM EGTA (Ca2+-free). Sedimentation velocity experiments were conducted at 55000 rpm using double-sector centerpieces. S100A4 subunit concentrations from 10 to 100 μM were analyzed [DCDT+ version 2.0.9 (69)]. Sedimentation equilibrium experiments were conducted using six-channel centerpieces; three concentrations of protein were analyzed for each experiment (wild-type Ca2+-bound S100A4, 28, 54, and 74 μM; wild-type apo-S100A4, 23, 38, and 52 μM; Ca2+-bound Δ13C S100A4, 39, 61, and 90 μM). The absorbance scans obtained following 24 h equilibrations at 15000 and 22000 rpm were globally analyzed using HeteroAnalysis version 1.0.114 (J. L. Cole and J. W. Lary, Analytical Ultracentrifugation Facility, Biotechnology Services Center, University of Connecticut, Storrs, CT) for the weight-average molecular weight or the dimer–tetramer equilibrium constant. The ν-bar values of 0.7346 and 0.7337 were calculated from the amino acid composition of wild-type S100A4 and Δ13C S100A4, respectively. Density and viscosity values were provided by Sednterp version 1.06 (B. Hayes, T. Laue, and J. Philo, Sedimentation Interpretation Program, 2003, University of New Hampshire, Durham, NH). The best-fit parameters and their 95% joint confidence intervals are reported. The calculated masses of wild-type S100A4 and Δ13C S100A4 monomers are 11597 and 9991.4 Da, respectively.
RESULTS
Ca2+ binding to Apo-S100A4
Like all S100 proteins, S100A4 has a pseudo-EF-hand (residues Ser20–Glu33; EF1) and a typical EF-hand (residues Asp63–Glu74; EF2). Since the interaction between S100A4 and target proteins such as MIIA depends on Ca2+ binding to the typical EF-hand, we examined the Ca2+ binding properties of S100A4 (70, 71). Under low-salt conditions used for NMR, human S100A4 binds two Ca2+ ions with the high-affinity site (EF2; Ca2Kd = 3.3 ± 1.3 μM) exhibiting a dissociation constant that is 1 order of magnitude tighter than that of the low-affinity site [EF1; Ca1Kd = 54 ± 11 μM (Figure 1 and Table 1)]. As reported previously, at physiological salt levels the high-affinity site on S100A4 binds Ca2+ with a similar Kd (Ca2Kd = 2.6 ± 1.0 μM), but the pseudo-EF-hand shows no appreciable affinity for Ca2+ (70-73). At physiological salt levels in the presence of a myosin-IIA peptide (MIIA1851–1960), the Ca2+ binding affinity of S100A4 in both the pseudo-EF- and typical EF-hands increases by more than 1 order of magnitude [Ca1Kd = 3.6 ± 0.2 μM; Ca2Kd = 0.26 ± 0.01 μM (Figure 1 and Table 1)].
Figure 1.

Thermodynamic data showing Ca2+ binding to S100A4. (A) Isothermal titration calorimetry (ITC) data demonstrating the interaction of S100A4 with Ca2+ (n = 2). (B) Competition assay with the chelator 5,5′Br2-BAPTA to examine the affinity of S100A4 for Ca2+ in the presence of MIIA1851–1960. The decrease in absorbance was monitored at 263 nm for a mixture containing 25 μM 5,5′Br2-BAPTA, 12.5 μM S100A4 dimer, and 125 μM MIIA1851–1960. The inset shows the saturation curve representation for the best fit in Caligator.
To determine which amino acid residues in human S100A4 were most affected by Ca2+ binding in solution, Ca2+ titrations of human apo-S100A4 were monitored using NMR spectroscopic methods. Upon addition of Ca2+, most S100A4 resonances disappeared and then reappeared with new chemical shift values consistent with Ca2+ binding to S100A4 in the slow exchange regime on the NMR chemical shift time scale. In such a binding regime, the shifted correlations of Ca2+-S100A4 could not be followed during the titration and required that they be completely reassigned a priori. The largest of these chemical shift perturbations (>900 Hz) are clustered in the two EF-hand Ca2+-binding loops and in helix 4 (Figure 2), which is consistent with Ca2+ binding to both EF-hands. In addition to these largest perturbations, significant changes in chemical shift (>200 Hz) were observed for numerous other residues throughout the protein and support the notion that a significant conformational change occurs in human S100A4 upon binding Ca2+, as reported previously for murine S100A4 (74).
Figure 2.

Chemical shift perturbations following the addition of Ca2+ to apo-S100A4. (A) Bar graph of the cumulative 1H, 15N, and 13C chemical shift perturbations observed per residue upon the addition of Ca2+ to apo-S100A4. (B) Ribbon diagram of Ca2+-S100A4 showing the subunits in red and blue. Residues highlighted in yellow exhibited the largest perturbations (as per the dashed red line at 900 Hz in panel A).
Structure Determination
Initial attempts to determine the S100A4 structure using molecular replacement methods with several existing NMR structures of S100 family members, including rat S100B (PDB entry 1DT7), rabbit S100A6 (PDB entry 1JWD) and human apo-S100A4 (PDB entry 1M31), were not successful. The excellent diffraction quality and relatively high symmetry of the S100A4 crystals suggested that sulfur SAD might be feasible. The four methionine residues, four cysteine residues, and two Ca2+ ions present in this 101-amino acid protein were expected to yield a significant anomalous signal when data were collected with 1.7 Å radiation. Indeed, all four Ca2+ ions and most of the sulfur atoms in the asymmetric unit (containing two protein chains) were located with SHELXD (Figure 3A), allowing near-automated tracing of the entire structure (Figure 3B). In the final refined model, 92.0, 6.9, and 1.1% of residues fall into the favorable, allowed, and generous areas of the Ramachandran plot, respectively (Table 2) (44). Residues with less favorable backbone conformations are located in the conformationally flexible loops of S100A4.
Figure 3.

(A) Heavy atom positions detected by SHELXD based on the SAD signal at 1.7 Å wavelength. Green and orange spheres denote Ca2+ ions and sulfur atoms, respectively. (B) Refined model of S100A4 (residues Ala2-Gly21) superimposed onto the 2Fo – Fc electron density map, contoured at 1σ.
Table 2.
Crystallographic Data and Refinement Statistics
| SAD | native | |
|---|---|---|
| Data collection | ||
| beamline | NSLS-X6A | NSLS-X29A |
| wavelength (Å) | 1.7 | 1.0 |
| resolution limits (Å) | 20–1.95 | 20–1.63 |
| no. of observed reflections | 299244 | 288354 |
| no. of unique reflections | 16952 | 28584 |
| completeness (%) | 89.4 (50.2)a | 99.9 (99.9)a |
| Rmergeb | 0.053 (0.367)a | 0.096 (0.685)a |
| Refinement Statistics | ||
| no. of protein non-hydrogen atoms | 2458 | |
| no. of water molecules | 226 | |
| Rcrystc | 0.197 (0.245)a | |
| Rfreec | 0.222 (0.302)a | |
| average B-factor (Å2) | 25.1 | |
| rmsd from Ideality | ||
| bond lengths (Å) | 0.013 | |
| bond angles (deg) | 1.4 | |
| torsion angles (deg) | 23.1 | |
| Ramachandran plot | ||
| core | 92.0% | |
| allowed | 6.9% | |
| generous | 1.1% | |
Values in parentheses indicate statistics for the high-resolution bin.
Rmerge = ΣΣj | Ij(hkl) – 〈I(hkl)〉|/ΣΣj|〈I(hkl)〉|, where Ij is the intensity measurement for reflection j and 〈I〉 is the mean intensity over j reflections.
R cryst/Rfree = Σ∥Fo(hkl)| – |Fc(hkl)∥Σ|Fo(hkl)|, where Fo and Fc are observed and calculated structure factors, respectively. No σ cutoff was applied. Five percent of the reflections were excluded from refinement and used to calculate Rfree.
Three-Dimensional Structure of Ca2+-S100A4
Most of the crystallized S100A4 construct is well-defined in the experimental electron density map except for residues at the extreme C-terminus, Pro98–Lys101, which are not included in the model. Typical of the S100 family, each of the two S100A4 chains in the asymmetric unit is predominantly R-helical with four major helices per chain denoted H1–H4 (Figure 4A). As with other S100 protein family members, helices 1 and 4 from one subunit are arranged in an antiparallel manner with helices 1′ and 4′ of the second subunit to form an X-type four-helix bundle at the dimer interface. The two independent chains superimpose with a rms deviation of 0.71 Å for all CR atoms with the most significant differences of ∼1.9 Å residing in the conformationally flexible C-terminal tail (residues Phe89–Gln97).
Figure 4.
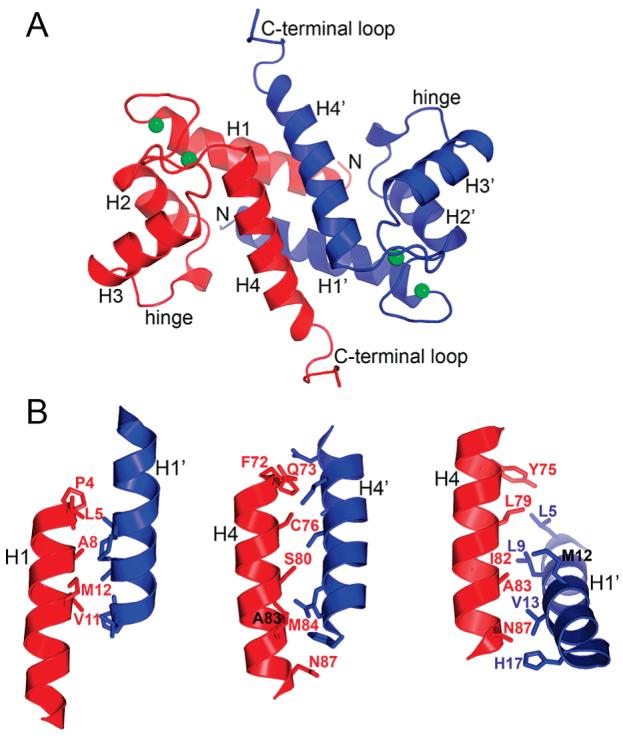
Molecular architecture of the Ca2+-S100A4 dimer. (A) Ribbon diagram of the dimer, where the two subunits are colored blue and red. The key structural elements common for the S100 family are indicated. Green spheres denote Ca2+ ions. (B) Details of the dimer interface of S100A4 involving helix 1–1′, 4–4′, and 1–4′ (1′–4) contact areas.
Several Ca2+-S100 structures have been determined by X-ray crystallography and NMR (Table 3). A DALI search for homologous structures reveals that the most structurally similar dimeric S100 family member is human S100A6 with a Z score of 15.1 and a rms deviation of 1.5 Å. The most significant structural differences between S100A4 and S100A6 occur in the hinge region between helices 2 and 3 (residues Leu42–Asp51). Interestingly, monomeric Ca2+-calbindin is also very similar to S100A4 with a Z score of 11.7 and a rms deviation of 1.9 Å (Table 3). The positions and orientations of helices 1–4 in the two proteins are comparable (Table 4) with the largest conformational difference of ∼12 Å occurring in the hinge region. Notably, in calbindin, the relative orientations of helices 1 and 4 (crucial elements of the dimer interface in S100 proteins) are well preserved, even though the helices are significantly shorter than in S100A4.
Table 3.
Structural Differences between Apo and Ca2+-S100A4 and Other S100 Proteins
| rms deviation between Cα atoms (Å)/Z scorea |
|||
|---|---|---|---|
| apob | Ca2+-boundc | sequence identity (%) |
|
| S100A1 | 3.2/7.3d (86) | 2.6/10.3e (92) | 49 |
| S100A6 | 2.1/9.6f (84) | 1.5/15.1g (89) | 50 |
| S100A7 | n/a | 2.3/11.3h (87) | 27 |
| S100A8 | n/a | 2.2/13.3i (88) | 34 |
| S100A9 | n/a | 1.3/13.0j (81) | 32 |
| S100A11 | 3.2/7.0k (87) | 2.0/14.5l (95) | 27 |
| S100A12 | n/a | 1.5/14.3m (87) | 40 |
| S100A13 | 3.7/7.0n (83) | 1.5/14.5o (86) | 34 |
| S100B | 3.5/8.4p (88) | 2.4/11.7q (92) | 48 |
| calbindin D9K |
3.1/4.6r (67) | 1.9/11.7s (73) | 38 |
| calcyclin | 2.9/9.1t (87) | 2.8/10.5u (88) | 51 |
Calculated using DaliLite (47); values in parentheses indicate the number of superimposed atoms.
PDB entry 1M31 (23).
PDB entry 2Q91 (this work).
PDB entry 1K2H (77).
PDB entry 1ZFS (35).
PDB entry 1K9P (76).
PDB entry 1K96 (76).
PDB entry 1PSR (100).
PDB entry 1MR8 (105).
PDB entry 1IRJ (106).
PDB entry 1NSH (95).
PDB entry 1QLS (96).
PDB entry 1E8A (107).
PDB entry 1YUR (97).
PDB entry 2H2K (98).
PDB entry 1SYM (78).
PDB entry 1QLK (34).
PDB entry 1KCY (108).
PDB entry 4ICB (108).
PDB entry 2CNP (75).
PDB entry 1JWD (99).
Table 4.
Interhelical Angles and Distances in S100A4a
| interhelical angle (deg) |
interhelical distance (Å) |
|||||||||
|---|---|---|---|---|---|---|---|---|---|---|
| 1–2 | 1–3 | 1–4 | 2–3 | 2–4 | 3–4 | 1–1′ | 4–4′ | 1–1′ | 4–4′ | |
| Ca2+-S100A4 | 139 ± 1 | −118 ± 2 | 130 ± 2 | 102 ± 2 | −32 ± 2 | 107 ± 2 | −151 ± 1 | 145 ± 1 | 13.9 ± 0.5 | 10.1 ± 0.5 |
| apo-S100A4b | 119 ± 2 | −55 ± 4 | 120 ± 2 | 151 ± 4f | −45 ± 3 | 162 ± 4 | −152 ± 4 | 153 ± 4 | n/a | n/a |
| Ca2+-S100A1c | 132 ± 1 | −102 ± 2 | 131 ± 2 | 125 ± 2 | −29 ± 1 | 121 ± 2 | −157 ± 3 | 152 ± 3 | 12.5 ± 0.2 | 11.1 ± 0.4 |
| apo-S100A1d | 120 ± 3 | −45 ± 2 | 107 ± 2 | 148 ± 2 | −46 ± 1 | −150 ± 1 | −165 ± 3 | 176 ± 2 | n/a | n/a |
| calbindine | 129 ± 1 | −116 ± 2 | 123 ± 2 | 111 ± 2 | −31 ± 1 | 118 ± 2 | n/a | n/a | n/a | n/a |
The helices in S100A4 are defined as follows: helix 1, Pro4-Ser20; helix 2, Lys31-Glu41; helix 3, Glu52-Leu62; helix 4, Phe72-Glu88.
From ref 23.
From ref 35.
From ref 77.
From ref 108.
In the orginal report (23), the interhelical angle for helices 2 and 3 in apo-S100A4 was mistakenly reported as a negative value.
The two S100A4 chains in the asymmetric unit interact to form a tight dimer with an interface that is observed throughout the S100 family. The dimer interface buries 3225 Å2 of accessible surface area, 86% of which is contributed by helix 1 (residues Pro4–Ser20) and helix 4 (residues Phe72–Glu88) (Figure 4 and Table 5). There are a total of 34 residue-to-residue interchain contacts. Of these, 10 contacts are between helices 1 and 1′, 12 contacts between helices 4 and 4′, and 12 contacts between helices 1 and 4′ and helices 1′ and 4 (Figure 4B). There are 12 hydrogen bonds within the dimer interface, some of which are asymmetric (Glu6 O∊1–Ser44′ Oγ, Glu6 O∊2–Ser44′ Oγ, Glu6 O∊2–Ser43′ N, His17 N∊2–Asn87′ Oδ1, and their symmetry mates). In addition, hydrogen bonds are observed between Ser80 Oγ and Ser80′ Oγ, Ser80 Oγ and Ser44′ N, Lys26 Nζ and Glu91′ O∊1, and Lys26 Nζ and Glu91′ O∊2. In homologous S100 structures, the predominantly nonpolar nature of the subunit interface is conserved, but the actual degree of sequence conservation is low. For example, among four S100 structures with at least 48% overall sequence identity to S100A4 (Table 3) (75-78), only five of 23 interface residues (21.7%) are conserved, indicating a higher than average level of sequence variability of the dimer interface in the S100 family.
Table 5.
Residues at the Dimer Interface of S100A4
| helix 1 - 1′ interactions | ||||||||||
| position | 4 | 5 | 8 | 11 | 12 | |||||
| residue | P | L | A | V | M | |||||
| helix 4 – 4′ interactions | ||||||||||
| position | 72 | 73 | 76 | 80 | 83 | 84 | 87 | |||
| residue | F | Q | C | S | A | M | N | |||
| helix 1 – 4′ interactions | ||||||||||
| position | 5 | 9 | 12 | 13 | 17 | 75 | 79 | 82 | 93 | 87 |
| residue | L | L | M | V | H | Y | L | I | A | N |
Ca2+ Coordination in S100A4
Calcium ions bind to the pseudo-EF- and typical EF-hands at sites located between helices 1 and 2 and helices 3 and 4, respectively. In the pseudo-EF-hand, the Ca2+ ion is coordinated by the main chain carbonyl oxygens of Ser20, Glu23, Asp25, and Lys28; the side chain carboxylate of Glu33 (both oxygen atoms); and a water molecule (Figure 5A). Thus, the pseudo-EF-hand primarily coordinates Ca2+ with main chain carbonyl oxygen atoms. In the C-terminal typical EF-hand, the Ca2+ ion is coordinated by the side chains of Asp63, Asn65, Asp67, and Glu74 (both oxygen atoms); the carbonyl oxygen of Glu69; and a water molecule (Figure 5B). In both EF-hands, the Ca2+ ion is coordinated by seven oxygen atoms with average ion–oxygen distances of 2.4 Å, which is similar to those of other crystallographically determined S100 structures (Table 3). NMR and X-ray structures of related family members (e.g., S100B) show similar Ca2+ coordination in the typical EF-hand with contributions from carboxylate oxygen atoms in the X, Y, Z, −Z, and −Z′ positions and from a backbone carbonyl oxygen in the −Y position. The final coordination position (−X) is occupied by a water molecule in the X-ray structure, which could not be observed experimentally by NMR. In contrast, the NMR structure of Ca2+-S100B and the X-ray structure of Ca2+-S100A4 exhibit differences in Ca2+ coordination at the pseudo-EF-hand. Specifically, the NMR-based model, which relied heavily on lanthanide luminescence data (79), identified only four protein ligands and required modeling together with the NMR data to predict the Ca2+ ligands, whereas in the X-ray structures of Ca2+-S100B and Ca2+-S100A4, all seven protein ligands to oxygen are observed (34, 79). This discrepancy in Ca2+ coordination can be attributed to the high mobility exhibited by several regions of S100B in solution, which has been observed on multiple time scales using 15N relaxation NMR measurements for both S100B and S100A4 (80) (unpublished observations) and may account for why the pseudo-EF-hand binds Ca2+ more weakly than the typical EF-hand. In addition, despite identical coordination numbers and protein–ion distances, the reduced Ca2+ affinity exhibited by the pseudo-EF-hand may result from the required conformational adjustment of the four main chain carbonyl oxygen atoms within the pseudo-EF-hand (81). These adjustments may be more energetically costly than positioning the more flexible side chains within the typical EF-hand.
Figure 5.
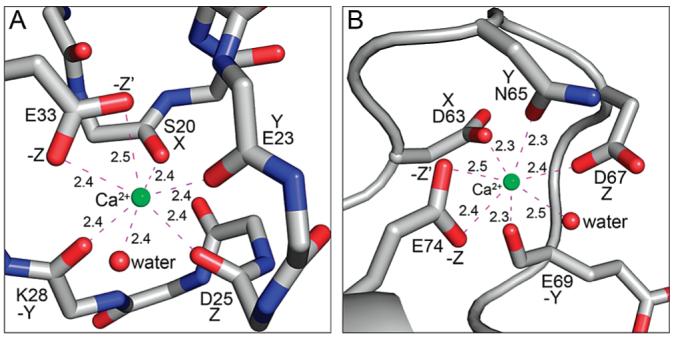
Structures of the Ca2+-loaded S100A4 EF-hands. (A) N-Terminal pseudo-EF-hand. The Ca2+ ion is coordinated by the main chain carbonyl oxygens of Ser20, Glu23, Asp25, and Lys28; the side chain carboxylate of Glu33 (both oxygens), and a water molecule. (B) C-Terminal typical EF-hand. The Ca2+ ion is coordinated by the side chains of Asp63, Asn65, Asp67, and Glu74 (both oxygens); the carbonyl oxygen of Glu69; and a water molecule. Green and red spheres denote Ca2+ and water atoms, respectively.
Ca2+ Switch in S100A4
It is well-appreciated that S100A4 undergoes a Ca2+-dependent conformational rearrangement, which is required for the recognition and binding of its various protein targets (8). For the first time, this conformational change can be described at atomic resolution by comparing the structures of the apo and Ca2+-loaded forms of S100A4. Specifically, the interhelical angle between helices 3 and 4 in each subunit of apo-S100A4 is 162 ± 2°, and in the Ca2+-bound state, it is 107 ± 2°, indicating a Ca2+-dependent change of −55°. Changes of −63° and −49° in the interhelical angles between helices 1 and 3 and helices 2 and 3, respectively, are observed as well (Figure 6A and Table 4). Accompanying these large helix movements are numerous reorientations of residues that are critical for coordination of Ca2+ (Figure 6B,C). Upon Ca2+ activation, helices 3 and 2 move most (55° and −23°, respectively) whereas helices 1 and 4 move least (1° and 12°, respectively) relative to their positions in the apo state. This is not surprising given that helices 1 and 4 are locked in the core of the dimer interface.
Figure 6.
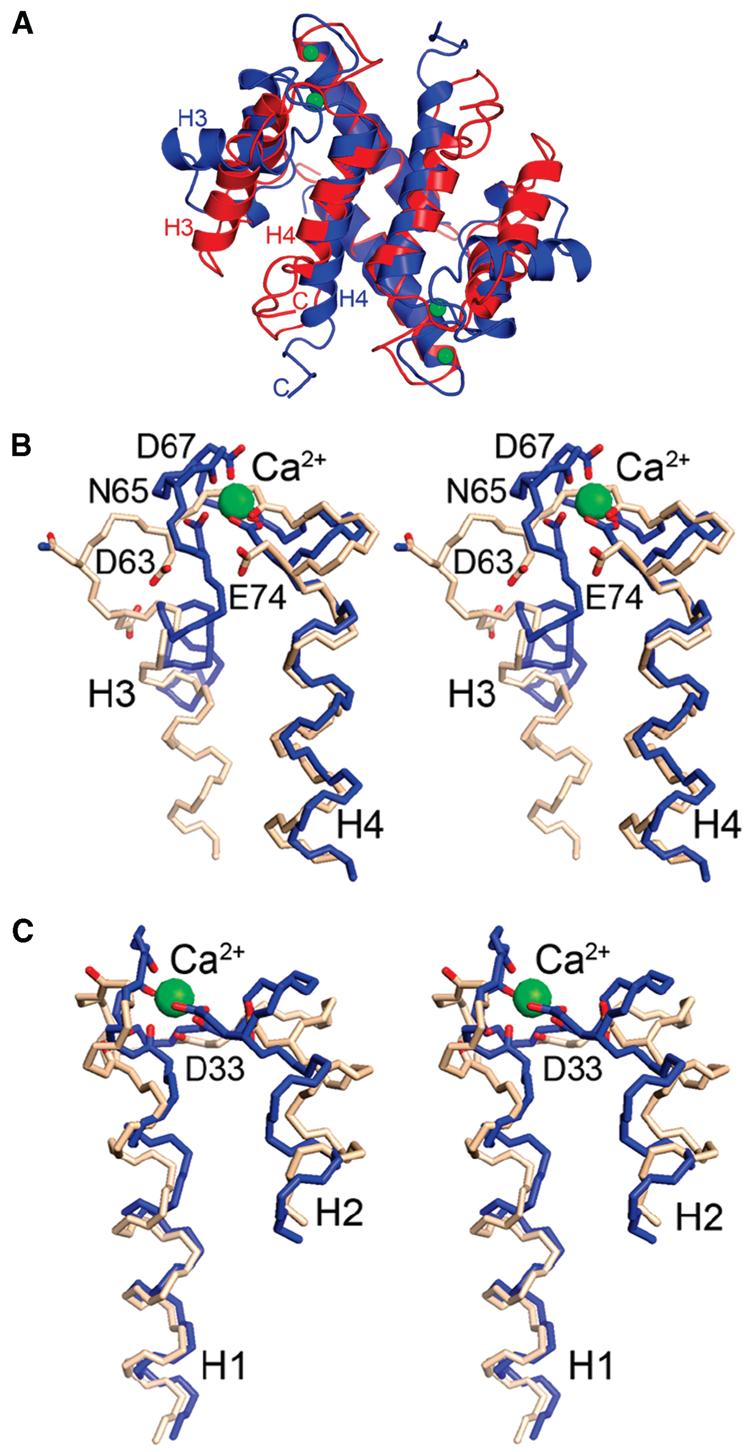
Conformational rearrangements in S100A4 caused by Ca2+ binding. (A) Ribbon diagrams comparing the three-dimensional structures of apo-S100A4 (red) and Ca2+-S100A4 (blue). Green spheres denote Ca2+ ions. Stereoviews of the (B) pseudo-EF-hand and (C) typical EF-hand of apo-S100A4 (beige) and Ca2+-S100A4 (blue). The Ca2+-coordinating oxygen atoms are colored red in both the apo and Ca2+-bound states.
As a result of the reorientation of helix 3, the number of residue contacts between helices 3 and 4 decreases from four to three and the number of contacts between helices 3 and 2 increases from six to eight, including the formation of two new hydrogen bonds, Lys35–Glu52 and Lys31–Gln56. In addition, residues that line the peptide binding pocket in Ca2+-S100A4 are subject to dramatic shifts to achieve their productive binding conformation. For example, the side chain of Phe45 moves ∼14 Å from a solvent-exposed environment in apo-S100A4 to a location at the bottom of the binding pocket where it interacts with the side chain of Phe78 from helix 4. Leu46 which is buried in a hydrophobic cluster with residues Leu38, Leu42, Ile82, and Met85 in apo-S100A4 positions next to Leu38, Phe45, Ala54, Phe55, and Leu58. In the Ca2+-S100A4 dimer, the guanidinium group of Arg49 moves from a solvent-exposed position to the edge of the binding pocket to form a salt bridge with the carboxylate of Asp51. Lys57 moves away from Pro91 in apo-S100A4 to the edge of the pocket and forms a hydrogen bond with Asn61. In the Ca2+-S100A4 dimer, Asn61, Phe78, Cys81, and Met85 shift slightly to adjust to the new positions of the above-mentioned residues. These substantial side chain movements are consistent with the large chemical shift perturbations that are detected upon addition of Ca2+ in our NMR studies (Figure 2).
Crystal Packing Interactions
An examination of the crystal packing interactions shows that the C-terminal tail (residues Glu91–Gln97) of each S100A4 chain interacts with the deep cleft formed between helices 3 and 4 of the 2-fold crystallographically related molecule (Figure 7A). This pocket in other S100 proteins generally functions as the target recognition cleft. As a result of these interactions, a left-handed superhelix of S100A4 dimers is observed that runs parallel to the crystallographic c-axis (Figure 7B). Many of the interdimeric interactions between the C-terminal tail of one dimer and the target binding cleft of the symmetry related molecule are nonpolar, involving residues Glu91–Gln97 of the C-terminal tail and residues Phe45, Leu46, Arg49, Lys57, Asn61, Phe78, Cys81, and Met85 of the binding pocket (Figure 8). Of a total of 19 residue-to-residue contacts, only three are direct hydrogen bonds, and several more are indirect hydrogen bonds mediated by water molecules. The side chains of Glu91 and Asp95 exhibit weak density and relatively high B-factors, although they can be modeled to participate in potential ionic interactions with Arg49, Asn61, and Lys57, respectively, in the pocket. The most C-terminal residues (Pro98-Lys101) are not visible in the electron density map.
Figure 7.
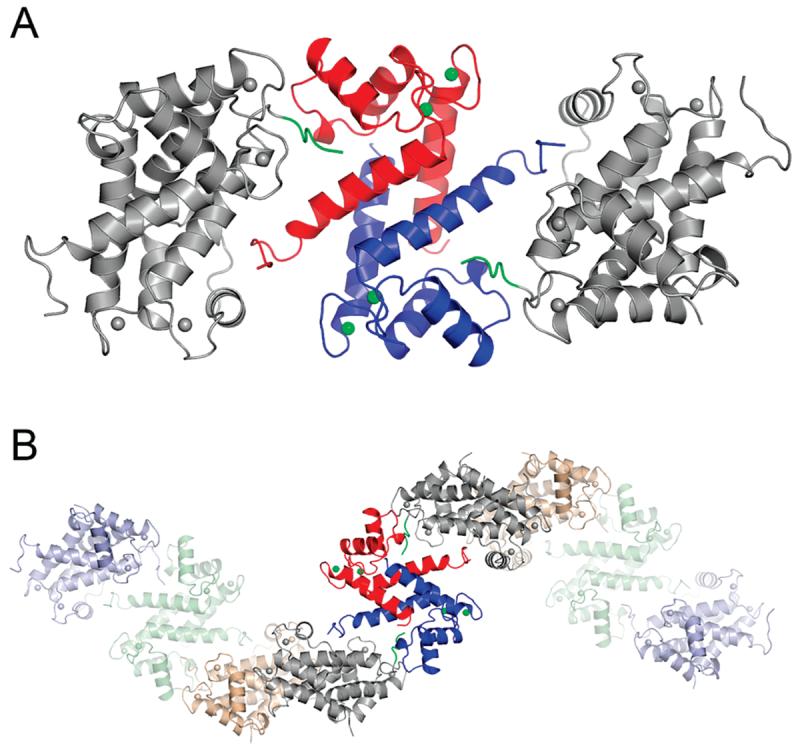
Self-association of S100A4 molecules in the crystal lattice. (A) The S100A4 dimer is shown with one red and one blue subunit. The symmetry-related molecules (gray) in the S100A4 crystals are positioned such that their C-terminal tails (green) bind to the hydrophobic cleft of the central molecule. (B) The interacting S100A4 dimers form infinite superhelical structures in the crystal.
Figure 8.
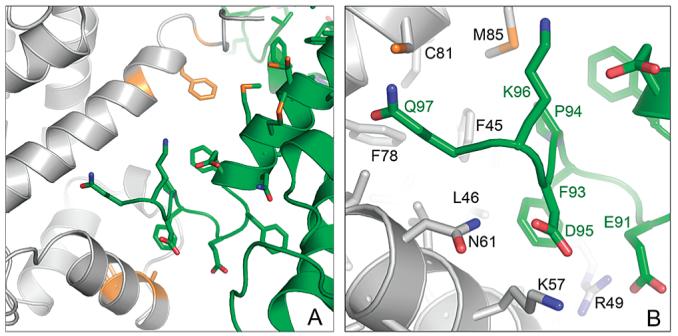
Interaction of the C-terminal tail of S100A4 (green) with the ligand binding site of the symmetry-related S100A4 molecule (gray). (A) Overall view of the ligand binding pocket. Residues showing chemical shift perturbations upon binding a peptide derived from the C-terminus of S100A4 (residues Glu88–Lys101) are colored orange. (B) Zoomed in view. Many of the interactions are nonpolar; however, Glu91 and Asp95 of the peptide may form ionic interactions with Arg49, Asn61, and Lys57 from the symmetry-related molecule.
Binding of the S100A4 C-Terminal Tail to Ca2+-S100A4
To determine whether the packing interactions observed by X-ray crystallography between the C-terminal tail and the peptide binding pocket also occur in solution, binding of a peptide derived from the C-terminus of S100A4 (residues Glu88-Lys101) was examined using NMR spectroscopy. In the absence of Ca2+, there were no chemical shift perturbations upon the addition of peptide; however, in the presence of Ca2+, perturbations in 1H–15N correlations were observed (>40 Hz) for residues Val11, His17, Asn30, Glu36, Ala54, Phe55, Leu79, Ala83, Cys86, Phe89, Gly92, and Arg99 (Figure 9), which is consistent with this peptide binding to the target binding cleft of S100A4. The assignment of these resonances in the presence of peptide was straight-forward because peptide binding was in the fast exchange regime on the chemical shift time scale, which allowed the movements of the correlations to be followed easily. The perturbation of these specific residues is consistent with the interactions observed between dimer units of S100A4 in the X-ray crystal structure; however, peptide binding was weak with a Kd of 1.05 ± 0.10 mM.
Figure 9.
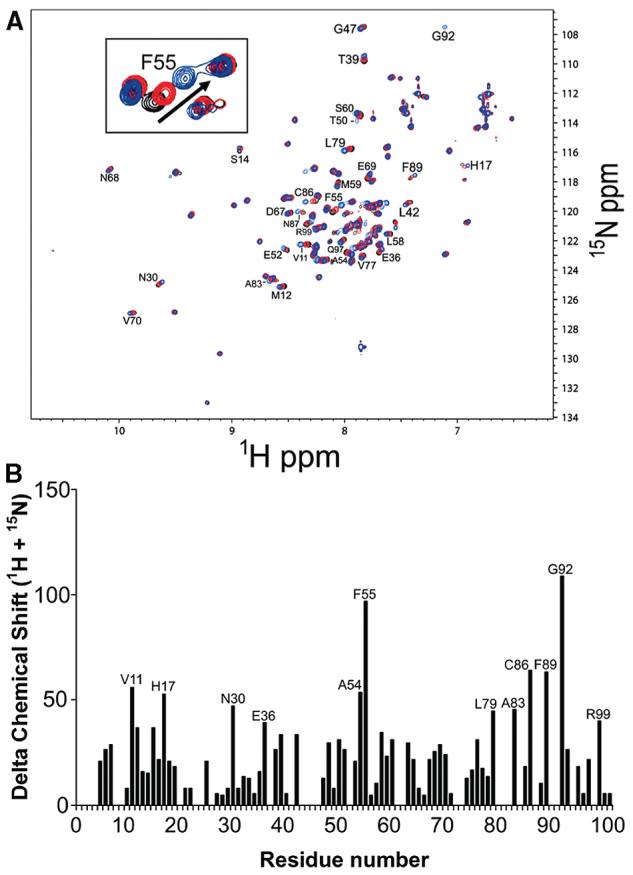
Chemical shift perturbations of 1H–15N correlations in a 2D HSQC spectrum of Ca2+-S100A4 upon the addition of a peptide derived from the C-terminus of S100A4. (A) HSQC spectra of Ca2+-S100A4 in the absence (black contours) and presence of 0.6 mM (red contours) and 3.6 mM (blue contours) C-terminal S100A4 peptide. The inset shows an expanded region of the HSQC spectrum illustrating the perturbations to the 1H–15N correlation for F55. (B) Chemical shift perturbations for residues in Ca2+-S100A4 upon addition of 3.6 mM C-terminal S100A4 peptide.
Analytical sedimentation studies were conducted to explore S100A4 oligomerization and whether the C-terminal tail mediates self-association. The weight-average molecular masses of Ca2+-bound S100A4, apo-S100A4, and Ca2+-bound Δ13C S100A4 are 37429 ± 2843, 26710 ± 2773, and 21969 ± 1989 Da, respectively (Figure 10). The masses of S100A4 and Δ13C S100A4 dimers calculated from their sequences are 23194 and 19983 Da, respectively. The correspondence of the calculated and observed molecular mass of Ca2+-bound Δ13C S100A4 shows that it is dimeric at these protein concentrations. This conclusion was confirmed by sedimentation velocity analysis conducted as a function of Δ13C S100A4 concentration. S20,w linearly decreases with an increase in Δ13C S100A4 concentration as expected for a stable oligomer (data not shown).
Figure 10.
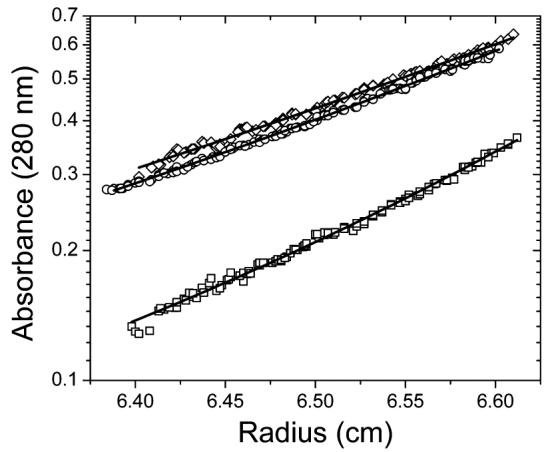
Sedimentation equilibrium measurements taken at 25 °C. The solid lines represent the best fit from a global nonlinear least-squares analysis of data obtained at 15000 and 22000 rpm: (□) 38 μM wild-type S100A4 and CaCl2 (subunit concentration), (○) 54 μM wild-type S100A4 and EDTA/EGTA (subunit concentration), and (◇) 61 μM Δ13C S100A4 and CaCl2 (subunit concentration).
In contrast, both apo and Ca2+-bound S100A4 dimers oligomerize to higher-order aggregates and Ca2+ facilitates this process. A dimer–tetramer reaction is the simplest association model that fits the data. Kd values of 19.84 (7.85, 41.27) and 469.4 (194.20, 1910.48) μM were resolved for Ca2+-bound and apo-S100A4, respectively. These results were confirmed by sedimentation velocity analysis. S20,w linearly increases with an increase in S100A4 concentration (more so for the Ca2+-bound protein) as expected for a self-association reaction (data not shown). These observations indicate that the C-terminal tail mediates oligomerization of the Ca2+-S100A4 dimer at high protein concentrations.
Binding of Myosin-IIA to Ca2+-S100A4
Next we examined S100A4 binding to peptides derived from the C-terminal coiled-coil domain of myosin-IIA that are monomeric and do not polymerize into filaments under any ionic strength. As found previously for myosin-IIA rods (MIIA1338–1960) (29), no interaction is observed between S100A4 and MIIA1908–1923, MIIA1893–1923, or MIIA1851–1960 in the absence of Ca2+, even at peptide and protein concentrations as high as 10−3 M for MIIA1908–1923 and MIIA1893–1923. However, when Ca2+ is present, all of the constructs derived from the C-terminus of myosin-IIA bind S100A4 with relatively high affinity at either a low or physiological salt levels (Figure 11A,B and Table 6), confirming the Ca2+ dependence of the S100A4–MIIA interaction. For MIIA1908–1923, which comprises the minimal S100A4 binding site, the affinity is slightly higher (Kd = 0.89 ± 0.12 μM) than for filamentous myosinIIA rods (MIIA1338–1960; Kd = 2.7 ± 0.6 μM) under low-salt conditions (20 mM KCl). Similarly under low-salt conditions, Ca2+-S100A4 binds MIIA1893–1923 and MIIA1851–1960 with 6-8-fold higher affinities than filamentous rods (MIIA1338–1960). Together, these data indicate that Ca2+-S100A4 binds to monomeric MIIA constructs more tightly than to polymeric MIIA rods. It should be noted that these comparisons were made under low-salt conditions because S100A4 depolymerizes MIIA rods under physiological conditions (150 mM KCl) (29).
Figure 11.

Thermodynamic data showing MIIA peptide binding to S100A4. (A) Isothermal titration calorimetry (ITC) of MIIA1893–1923 peptide (low salt; n = 1). (B) Competition fluorescence anisotropy of MIIA1893–1923 and MIIA1851–1960 at a physiological salt concentration.
Table 6.
Dissociation Constants for MIIA Binding to S100A4
| MIIA construct | Kd (μM) |
|---|---|
| S100A4 + MIIA1338-1960 (rod, low salt) | 2.7 ± 0.6a |
| S100A4 + MIIA1851-1960 (coiled coil + tailpiece, low salt) | 0.41 ± 0.01b |
| S100A4 + MIIA1851-1960 (coiled coil + tailpiece, high salt) | 0.50 ± 0.01b |
| S100A4 + MIIA1893-1923 (coiled coil, low salt) | 0.34 ± 0.02c |
| S100A4 + MIIA1893-1923 (coiled coil, high salt) | 1.1 ± 0.1d |
| S100A4 + MIIA1908-1923 (minimal S100A4 site, low salt) | 0.50 ± 0.20e |
| S100A4 + MIIA1908-1923 (minimal S100A4 site, low salt) | 0.89 ± 0.12f |
| S100A4 + MIIA1908-1923 (minimal S100A4 site, high salt) | 1.7 ± 0.2f |
This value is from published studies (29). The dissociation constant for the Ca2+-dependent interaction between S100A4 and MIIA rod filaments was determined in a cosedimentation assay under low-salt conditions [20 mM Tris (pH 7.5), 20 mM NaCl, 2 mM MgCl2, 0.3 mM CaCl2, 1 mM DTT, 0.02% NaN3]. Binding could not be examined under high-salt conditions (150 mM KCl) since S100A4 disassembles the MIIA rods under these conditions.
The dissociation constant for the Ca2+-dependent interaction between S100A4 and MIIA1851-1960 was determined in competition studies with fluorescently labeled MIIA1908-1923 using a fluorescence polarization assay under low- and high-salt conditions [20 mM Tris (pH 7.5), 20 or 150 mM KCl, 1 mM DTT, 0.02% NaN3, and 0.5 mM CaCl2]. MIIA1851-1960 comprises part of the coiled-coil domain and the C-terminal tailpiece of MIIA.
The dissociation constant for the Ca2+-dependent interaction between S100A4 and MIIA1893-1923 was determined using ITC under low-salt conditions [20 mM Tris (pH 7.5), 20 mM KCl, 250 μM TCEP, and 0.8 mM CaCl2]. MIIA1893-1923 comprises part of the coiled-coil domain of MIIA.
The dissociation constant for the Ca2+-dependent interaction between S100A4 and MIIA1893-1923 was determined in competition studies with fluorescently labeled MIIA1908-1923 using a fluorescence polarization assay under high-salt conditions [20 mM Tris (pH 7.5), 150 mM KCl, 1 mM DTT, 0.02% NaN3, and 0.5 mM CaCl2].
The dissociation constant for the Ca2+-dependent interaction between S100A4 and MIIA1908-1923 was determined using ITC under low-salt conditions [20 mM Tris (pH 7.5), 20 mM KCl, 250 μM TCEP, and 0.8 mM CaCl2]. MIIA1908-1923 comprises a portion of the coiled-coil domain of MIIA but is not predicted to form a coiled coil.
The dissociation constant for the Ca2+-dependent interaction between S100A4 and FITC-MIIA1908-1923 was determined as described previously using a fluorescence polarization assay (71) under low- or high-salt conditions [20 mM Tris (pH 7.5), 20 or 15 mM KCl, 1 mM DTT, 0.02% NaN3, and 0.5 mM CaCl2].
We also examined binding of the MIIA peptides under physiological conditions (150 mM KCl) (Table 6). Specifically, Ca2+-S100A4 binds the largest of these MIIA constructs, MIIA1851–1960, with slightly higher affinity (Kd = 0.50 ± 0.01 μM) than the smaller MIIA1893–1923 (Kd = 1.1 ± 0.1 μM) and MIIA1908–1923 (Kd = 1.7 ± 0.2 μM) peptides. The shorter peptides exhibit some salt dependence in their binding to S100A4, whereas salt concentration has no discernible effect on the binding of the larger peptide (MIIA1851–1960) (Table 6). Notably, these studies demonstrate that MIIA does not have to be in a filament or in a coiled-coil conformation to bind Ca2+-loaded S100A4.
Mapping the Myosin-IIA Binding Site on Ca2+-S100A4
A comparison of apo and Ca2+-bound S100A4 shows that there is a large rearrangement in the position of helix 3, which exposes a hydrophobic pocket on Ca2+-S100A4 that is not accessible in apo-S100A4 (23) (Figure 4A). A similar Ca2+-dependent conformational change is required for other S100 proteins to bind their respective targets (34-36, 82-84). Therefore, we used NMR spectroscopic methods to investigate the binding of MIIA1908–1923 to Ca2+-S100A4 to determine whether this pocket comprises the MIIA binding site.
During the titration of the MIIA1908–1923 peptide into Ca2+-S100A4, many of the resonances broadened and in some cases disappeared or reappeared, consistent with MIIA1908–1923 binding; however, all of the observable correlations could be assigned sequence specifically when the titration was complete (Figure 12). An analysis of chemical shifts, NOE correlations, and hydrogen exchange data (85, 86) demonstrates that very few changes in the secondary structure of Ca2+-bound S100A4 are observed upon binding of MIIA1908–1923 (data not shown). Thus, the chemical shift perturbation data could be used reliably to map the MIIA1908–1923 peptide binding site on Ca2+-S100A4. Unlike the transition from apo-S100A4 to holo-S100A4, in which nearly two-thirds of the resonances undergo large changes in chemical shift (Figure 13A), MIIA1908–1923 binding produces chemical shift perturbations smaller in magnitude. Following peptide addition, perturbations of amide 1H, 15N, 13Cα, and 13Cβ resonances (>75 Hz total per residue) occur for residues in helix 1 (Val11, Met12, Ser14, and Phe16), the pseudo-EF-hand (Ser20, Phe27, Lys28, and Asn30), the hinge (Glu41, Gly47, Lys48, Thr50, and Asp51), helix 3 (Ser60 and Leu62), the typical EF-hand (Asn68 and Val70), helix 4 (Phe78, Leu79, Met85, and Cys86), and the C-terminal tail (Gly92) of Ca2+-S100A4 when the MIIA1908–1923 peptide is added (Figure 13B). The changes in chemical shift for these specific residues are consistent with MIIA1908–1923 binding in a hydrophobic pocket of S100A4 that is exposed upon addition of Ca2+.
Figure 12.
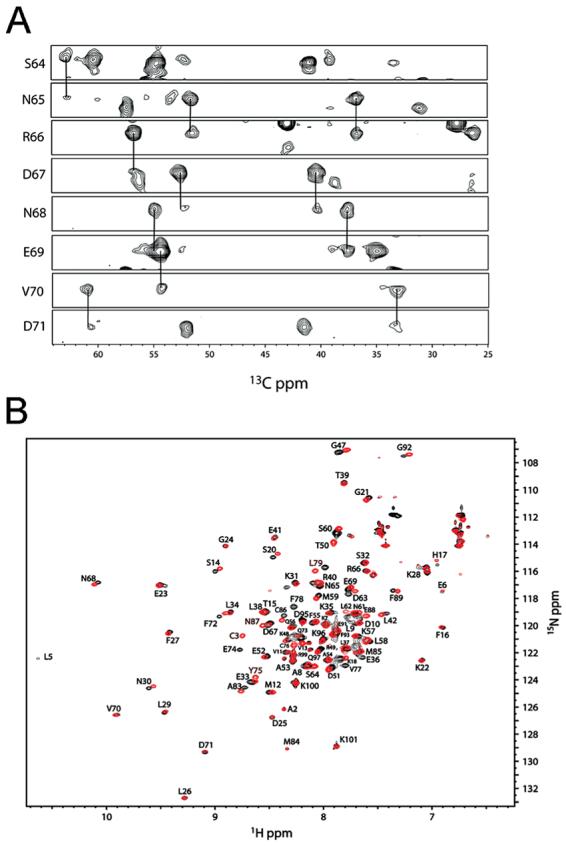
Nuclear magnetic resonance (NMR) data together with the resonance assignments for Ca2+-S100A4 in the presence and absence of the MIIA1908–1923 peptide. (A) Strips from 15N planes of a three-dimensional HNCACB data set for 13C- and 15N-labeled S100A4 bound to the MIIA1908–1923 peptide in the presence of Ca2+, which illustrates the quality of the data used for making the resonance assignments. (B) Overlay of 1H–15N HSQC data for Ca2+-S100A4 in the MIIA1908–1923 peptide-bound (red contours) and free (black contours) states.
Figure 13.
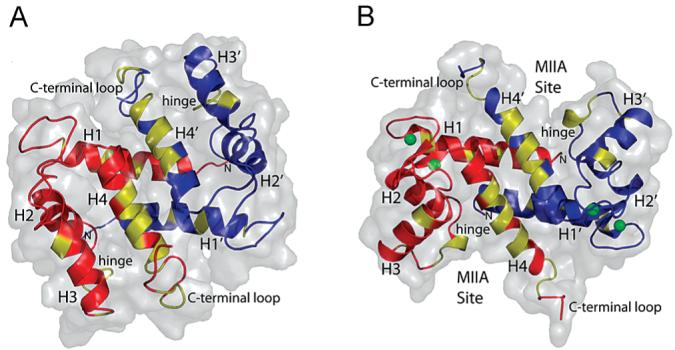
Ribbon and surface diagrams of S100A4 in the (A) apo and (B) Ca2+-bound states. Residues colored yellow show significant chemical shift perturbations and exchange broadening effects upon binding of the MIIA1908–1923 peptide.
DISCUSSION
Our biochemical studies demonstrate that in the presence of target (e.g., a myosin-IIA peptide), the Ca2+ binding affinity of S100A4 in both EF-hands increases by more than 1 order of magnitude (Kd values of 3.6 and 0.26 μM for the pseudo-EF-hand and typical EF-hand, respectively, in the presence of MIIA1851–1960). These results with the human S100A4–MIIA complex are similar to observations with other S100 proteins (82, 87-89) and demonstrate that like other Ca2+-binding proteins (e.g., calmodulin) (90), S100 protein family members exhibit a higher affinity for Ca2+ in the presence of their target proteins. Target-induced tuning of Ca2+ affinities has important implications when considering S100 protein activation in vivo. Intracellular Ca2+ levels are tightly controlled, with quiescent cells exhibiting Ca2+ concentrations of ∼100 nM; however, local Ca2+ levels can rapidly and transiently increase to low micromolar levels (91-94). Thus, the increased Ca2+ binding affinities exhibited by S100A4 in the presence of the myosin-IIA peptide could tune S100A4 activation and inactivation in response to specific temporal and spatial cellular events.
Similar to the case for other S100 family members, Ca2+ binding has a dramatic effect on S100A4 conformation. Superimposition of the apo-S100A4 NMR structure and the Ca2+-bound S100A4 X-ray structure presented here reveals a large-scale rearrangement of the hinge region and helix 3. In apo-S100A4, helices 3 and 4 adopt a nearly antiparallel orientation relative to each other (helical angle of 162 ± 4°), and this conformation is stabilized by multiple interactions between helix 3 and helices 2 and 4. In contrast, in the Ca2+-bound S100A4 structure, the EF-hands change their conformation due to metal binding, which causes helix 2 and helix 3 to rotate relative to the almost immobile core formed by helices 1 and 4. In the Ca2+- S100A4 structure, helix 3 is nearly orthogonal to helix 2 and helix 4 (helical angles of 102 ± 2° and 107 ± 2°, respectively). This reorganization results in the formation of a cleft between helices 3 and 4 that is appropriately configured to accept target peptides such as those from myosin-IIA. The largest conformational transition occurs in the hinge region that together with helices 3 and 4 contributes to the target binding pocket.
Structural comparisons indicate that Ca2+ activation brings about similar conformational changes in S100A4, S100A1, S100A6, S100A11, S100A12, S100A13, and S100B in terms of overall structure and interhelical angles (23, 34, 35, 75-78, 95-99). Helices 1 and 4, which are locked in the dimer interface, are the most structurally conserved in both the apo and Ca2+-bound forms. Helices 2 and 3 and especially the hinge region deviate most among both apo and Ca2+-bound structures. Thus, conformational variability within the target binding pocket is likely to be important for target protein specificity within the S100 family.
The C-terminal tail is the most flexible region in all S100 structures, as the observed conformations and orientations vary considerably in the structures listed in Table 3. On the basis of crystal lattice interactions, the current S100A4 structure suggests interdimer self-association. Interestingly, in the holmium-substituted S100A7 structure (100), the C-terminal tail self-associates with the binding pocket of the same S100 subunit via intramolecular interactions. The position of the peptide within the pocket is quite similar to that in S100A4; however, its contacts within the pocket and especially the structure of the hinge region are distinct.
To determine whether intermolecular interactions between S100A4 dimers can occur in solution, a 13mer peptide derived from the C-terminal tail of S100A4 (residues Pro98–Lys101) was titrated into dimeric Ca2+-S100A4. Although perturbations in both 1H and 15N backbone resonances in Ca2+-S100A4 were detected in the hinge region and helix 4 and are consistent with interdimer interactions observed in the X-ray structure, the affinity of this peptide is quite low for binding intact Ca2+-S100A4 (Kd = 1.05 ± 0.10 mM). However, sedimentation equilibrium studies indicate that at high S100A4 concentrations, full-length S100A4 can self-associate into tetramers in a Ca2+-dependent manner. Moreover, assembly is mediated by the C-terminal tail as deletion of these residues results in the formation of a stable dimer. Notably, in normal and tumor cells, S100A4 dimer concentrations range from 3 to 5 μM, with concentrations as high as 10 μM in some carcinoma cells (33) (unpublished observations). Given the magnitudes of the equilibrium constants governing formation of S100A4 tetramers, intracellular S100A4 is likely to be predominantly a dimer.
It is also notable that the structure of S100A4 crystallized in the presence of Ca2+ and PCP shows no indication of bound PCP; however, crystals could be obtained only in the presence of PCP. We propose that inhibitor binding in solution promotes an open conformation similar to those observed in other ternary S100 complexes (84, 101, 102) and that the inhibitor exchanges for the C-terminal tail of the nascent S100A4 molecule, thus facilitating crystallization.
As with other S100 proteins, the interaction between S100A4 and the C-terminus of myosin-IIA is dependent on a “Ca2+-switch” mechanism for binding. Our NMR studies demonstrate that the MIIA1908–1923 peptide binds in a Ca2+-induced hydrophobic pocket of S100A4 that is comprised of residues in the hinge region, helix 3, and helix 4. These findings are consistent with other S100–target peptide complexes, including S100B–p53, S100B–NDR, S100B–TRTK, S100A10–annexin II, and S100A11–annexin I complexes (82, 84, 88, 96, 101, 103); however, when compared among the S100 proteins, the residues comprising the pocket are not conserved. The low degree of sequence conservation between S100 homologues within the binding pocket suggests that this sequence divergence may provide a mechanism for target specific recognition and binding (104).
These studies demonstrate that S100A4 binds with high affinity to short MIIA peptides (e.g., MIIA1908–1923) and MIIA peptides that are predicted to form a coiled coil (e.g., MIIA1893–1923 and MIIA1851–1960). Notably, a highly conserved 29-residue sequence, termed the assembly competence domain or ACD, was identified as a critical region for myosin-II assembly (30, 31). The ACD and the sequences immediately flanking it have been termed the extended ACD (residues 1857–1919 in myosin-IIA) and are predicted to form a very stable coiled coil (30). Our previous studies demonstrate that the S100A4 binding site (residues 1908–1923) maps to the C-terminal end of the extended ACD on myosin-IIA (29). It is also important to note that nearly all S100–target complexes examined thus far show that each subunit in a S100 dimer binds to a single helical peptide (84, 101, 102). On the basis of these observations, we propose that S100A4 promotes myosin-IIA filament disassembly by binding a single polypeptide chain of the coiled coil. This would allow for Ca2+-dependent conformational rearrangements that may result in partial unwinding of the coiled coil.
ACKNOWLEDGMENT
We thank Dr. Michael Brenowitz for assistance with analytical ultracentrifugation experiments and the staff of the X6A beamline at the National Synchrotron Light Source for the help. We acknowledge support from the Albert Einstein College of Medicine Cancer Center (National Cancer Institute Grant P30CA13330).
Footnotes
This work was supported by National Institutes of Health Grants GM069945 (A.R.B.), GM58888 (D.J.W.), and CA107331 (D.J.W.) and American Cancer Society Grant CDD107745 (D.J.W.).
Abbreviations: MIIA, nonmuscle myosin-IIA; LAR, leukocyte common antigen related; ITC, isothermal titration calorimetry; DTT, dithiothreitol; TSP, 3-(trimethylsilyl)propionic acid-d4, sodium salt; HSQC, heteronuclear single-quantum coherence; NOESY, nuclear Overhauser effect spectroscopy; HOHAHA, homonuclear Hartmann–Hahn spectroscopy; HMQC, heteronuclear multiple-quantum coherence; DIPSI-2, decoupling in the presence of scalar interaction version 2; HPLC, high-performance liquid chromatography; TCEP, tris(2-carboxyethyl)phosphine; FITC, fluorescein isothiocyanate; BAPTA, 1,2-bis(o-aminophenoxy)ethane-N,N,N′,N′-tetraacetic acid; PCP, prochlorperazine; ACD, assembly competence domain.
REFERENCES
- 1.Donato R. S100: A multigenic family of calcium-modulated proteins of the EF-hand type with intracellular and extracellular functional roles. Int. J. Biochem. Cell Biol. 2001;33:637–668. doi: 10.1016/s1357-2725(01)00046-2. [DOI] [PubMed] [Google Scholar]
- 2.Marenholz I, Heizmann CW, Fritz G. S100 proteins in mouse and man: From evolution to function and pathology (including an update of the nomenclature) Biochem. Biophys. Res. Commun. 2004;322:1111–1122. doi: 10.1016/j.bbrc.2004.07.096. [DOI] [PubMed] [Google Scholar]
- 3.Zimmer DB, Cornwall EH, Landar A, Song W. The S100 protein family: History, function, and expression. Brain Res. Bull. 1995;37:417–429. doi: 10.1016/0361-9230(95)00040-2. [DOI] [PubMed] [Google Scholar]
- 4.Santamaria-Kisiel L, Rintala-Dempsey AC, Shaw GS. Calcium-dependent and -independent interactions of the S100 protein family. Biochem. J. 2006;396:201–214. doi: 10.1042/BJ20060195. [DOI] [PMC free article] [PubMed] [Google Scholar]
- 5.Grigorian MS, Tulchinsky EM, Zain S, Ebralidze AK, Kramerov DA, Kriajevska MV, Georgiev GP, Lukanidin EM. The mts1 gene and control of tumor metastasis. Gene. 1993;135:229–238. doi: 10.1016/0378-1119(93)90070-j. [DOI] [PubMed] [Google Scholar]
- 6.Takenaga K, Nakamura Y, Sakiyama S. Cellular localization of pEL98 protein, an S100-related calcium binding protein, in fibroblasts and its tissue distribution analyzed by monoclonal antibodies. Cell Struct. Funct. 1994;19:133–141. doi: 10.1247/csf.19.133. [DOI] [PubMed] [Google Scholar]
- 7.Helfman DM, Kim EJ, Lukanidin E, Grigorian M. The metastasis associated protein S100A4: Role in tumour progression and metastasis. Br. J. Cancer. 2005;92:1955–1958. doi: 10.1038/sj.bjc.6602613. [DOI] [PMC free article] [PubMed] [Google Scholar]
- 8.Garrett SC, Varney KM, Weber DJ, Bresnick AR. S100A4, a mediator of metastasis. J. Biol. Chem. 2006;281:677–680. doi: 10.1074/jbc.R500017200. [DOI] [PubMed] [Google Scholar]
- 9.Rudland PS, Platt-Higgins A, Renshaw C, West CR, Winstanley JH, Robertson L, Barraclough R. Prognostic significance of the metastasis-inducing protein S100A4 (p9Ka) in human breast cancer. Cancer Res. 2000;60:1595–1603. [PubMed] [Google Scholar]
- 10.Gongoll S, Peters G, Mengel M, Piso P, Klempnauer J, Kreipe H, von Wasielewski R. Prognostic significance of calcium-binding protein S100A4 in colorectal cancer. Gastroenterology. 2002;123:1478–1484. doi: 10.1053/gast.2002.36606. [DOI] [PubMed] [Google Scholar]
- 11.Davies BR, Donnell M, Durkan GC, Rudland PS, Barraclough R, Neal DE, Mellon JK. Expression of S100A4 protein is associated with metastasis and reduced survival in human bladder cancer. J. Pathol. 2002;196:O–299. doi: 10.1002/path.1051. [DOI] [PubMed] [Google Scholar]
- 12.Ninomiya I, Ohta T, Fushida S, Endo Y, Hashimoto T, Yagi M, Fujimura T, Nishimura G, Tani T, Shimizu K, Yonemura Y, Heizmann CW, Schafer BW, Sasaki T, Miwa K. Increased expression of S100A4 and its prognostic significance in esophageal squamous cell carcinoma. Int. J. Oncol. 2001;18:715–720. doi: 10.3892/ijo.18.4.715. [DOI] [PubMed] [Google Scholar]
- 13.Kimura K, Endo Y, Yonemura Y, Heizmann CW, Schafer BW, Watanabe Y, Sasaki T. Clinical significance of S100A4 and E-cadherin-related adhesion molecules in non-small cell lung cancer. Int. J. Oncol. 2000;16:1125–1131. doi: 10.3892/ijo.16.6.1125. [DOI] [PubMed] [Google Scholar]
- 14.Cho YG, Nam SW, Kim TY, Kim YS, Kim CJ, Park JY, Lee JH, Kim HS, Lee JW, Park CH, Song YH, Lee SH, Yoo NJ, Lee JY, Park WS. Overexpression of S100A4 is closely related to the aggressiveness of gastric cancer. APMIS. 2003;111:539–545. doi: 10.1034/j.1600-0463.2003.1110502.x. [DOI] [PubMed] [Google Scholar]
- 15.Hernan R, Fasheh R, Calabrese C, Frank AJ, Maclean KH, Allard D, Barraclough R, Gilbertson RJ. ERBB2 up-regulates S100A4 and several other prometastatic genes in medulloblastoma. Cancer Res. 2003;63:140–148. [PubMed] [Google Scholar]
- 16.Rosty C, Ueki T, Argani P, Jansen M, Yeo CJ, Cameron JL, Hruban RH, Goggins M. Overexpression of S100A4 in pancreatic ductal adenocarcinomas is associated with poor differentiation and DNA hypomethylation. Am. J. Pathol. 2002;160:45–50. doi: 10.1016/S0002-9440(10)64347-7. [DOI] [PMC free article] [PubMed] [Google Scholar]
- 17.Saleem M, Adhami VM, Ahmad N, Gupta S, Mukhtar H. Prognostic significance of metastasis-associated protein S100A4 (Mts1) in prostate cancer progression and chemoprevention regimens in an autochthonous mouse model. Clin. Cancer Res. 2005;11:147–153. [PubMed] [Google Scholar]
- 18.Zou M, Al-Baradie RS, Al-Hindi H, Farid NR, Shi Y. S100A4 (Mts1) gene overexpression is associated with invasion and metastasis of papillary thyroid carcinoma. Br. J. Cancer. 2005;93:1277–1284. doi: 10.1038/sj.bjc.6602856. [DOI] [PMC free article] [PubMed] [Google Scholar]
- 19.Stein U, Arlt F, Walther W, Smith J, Waldman T, Harris ED, Mertins SD, Heizmann CW, Allard D, Birchmeier W, Schlag PM, Shoemaker RH. The metastasis-associated gene S100A4 is a novel target of -catenin/T-cell factor signaling in colon cancer. Gastroenterology. 2006;131:1486–1500. doi: 10.1053/j.gastro.2006.08.041. [DOI] [PubMed] [Google Scholar]
- 20.Fearon ER, Vogelstein B. A genetic model for colorectal tumorigenesis. Cell. 1990;61:759–767. doi: 10.1016/0092-8674(90)90186-i. [DOI] [PubMed] [Google Scholar]
- 21.Bienz M, Clevers H. Linking colorectal cancer to Wnt signaling. Cell. 2000;103:311–320. doi: 10.1016/s0092-8674(00)00122-7. [DOI] [PubMed] [Google Scholar]
- 22.Polakis P. The many ways of Wnt in cancer. Curr. Opin. Genet. Dev. 2007;17:45–51. doi: 10.1016/j.gde.2006.12.007. [DOI] [PubMed] [Google Scholar]
- 23.Vallely KM, Rustandi RR, Ellis KC, Varlamova O, Bresnick AR, Weber DJ. Solution structure of human mts1 (S100A4) as determined by NMR spectroscopy. Biochemistry. 2002;41:12670–12680. doi: 10.1021/bi020365r. [DOI] [PubMed] [Google Scholar]
- 24.Kriajevska MV, Cardenas MN, Grigorian MS, Ambartsumian NS, Georgiev GP, Lukanidin EM. Non-muscle myosin heavy chain as a possible target for protein encoded by metastasis-related mts-1 gene. J. Biol. Chem. 1994;269:19679–19682. [PubMed] [Google Scholar]
- 25.Ford HL, Silver DL, Kachar B, Sellers JR, Zain SB. Effect of Mts1 on the structure and activity of nonmuscle myosin II. Biochemistry. 1997;36:16321–16327. doi: 10.1021/bi971182l. [DOI] [PubMed] [Google Scholar]
- 26.Takenaga K, Nakamura Y, Sakiyama S, Hasegawa Y, Sato K, Endo H. Binding of pEL98 protein, an S100-related calcium-binding protein, to nonmuscle tropomyosin. J. Cell Biol. 1994;124:757–768. doi: 10.1083/jcb.124.5.757. [DOI] [PMC free article] [PubMed] [Google Scholar]
- 27.Watanabe Y, Usada N, Minami H, Morita T, Tsugane S, Ishikawa R, Kohama K, Tomida Y, Hidaka H. Calvasculin, as a factor affecting the microfilament assemblies in rat fibroblasts transfected by src gene. FEBS Lett. 1993;324:51–55. doi: 10.1016/0014-5793(93)81530-d. [DOI] [PubMed] [Google Scholar]
- 28.Kriajevska M, Fischer-Larsen M, Moertz E, Vorm O, Tulchinsky E, Grigorian M, Ambartsumian N, Lukanidin E. Liprin 1, a member of the family of LAR transmembrane tyrosine phosphatase-interacting proteins, is a new target for the metastasis-associated protein S100A4 (Mts1) J. Biol. Chem. 2002;277:5229–5235. doi: 10.1074/jbc.M110976200. [DOI] [PubMed] [Google Scholar]
- 29.Li ZH, Spektor A, Varlamova O, Bresnick AR. Mts1 regulates the assembly of nonmuscle myosin-IIA. Biochemistry. 2003;42:14258–14266. doi: 10.1021/bi0354379. [DOI] [PubMed] [Google Scholar]
- 30.Sohn RL, Vikstrom KL, Strauss M, Cohen C, SzentGyorgyi AG, Leinwand LA. A 29 residue region of the sarcomeric myosin rod is necessary for filament formation. J. Mol. Biol. 1997;266:317–330. doi: 10.1006/jmbi.1996.0790. [DOI] [PubMed] [Google Scholar]
- 31.Cohen C, Parry DA. A conserved C-terminal assembly region in paramyosin and myosin rods. J. Struct. Biol. 1998;122:180–187. doi: 10.1006/jsbi.1998.3983. [DOI] [PubMed] [Google Scholar]
- 32.Dulyaninova NG, Malashkevich VN, Almo SC, Bresnick AR. Regulation of myosin-IIA assembly and Mts1 binding by heavy chain phosphorylation. Biochemistry. 2005;44:6867–6876. doi: 10.1021/bi0500776. [DOI] [PubMed] [Google Scholar]
- 33.Li ZH, Bresnick AR. The S100A4 metastasis factor regulates cellular motility via a direct interaction with myosin-IIA. Cancer Res. 2006;66:5173–5180. doi: 10.1158/0008-5472.CAN-05-3087. [DOI] [PubMed] [Google Scholar]
- 34.Drohat AC, Baldisseri DM, Rustandi RR, Weber DJ. Solution structure of calcium-bound rat S100B(ββ) as determined by nuclear magnetic resonance spectroscopy. Biochemistry. 1998;37:2729–2740. doi: 10.1021/bi972635p. [DOI] [PubMed] [Google Scholar]
- 35.Wright NT, Varney KM, Ellis KC, Markowitz J, Gitti RK, Zimmer DB, Weber DJ. The three-dimensional solution structure of Ca2+-bound S100A1 as determined by NMR spectroscopy. J. Mol. Biol. 2005;353:410–426. doi: 10.1016/j.jmb.2005.08.027. [DOI] [PubMed] [Google Scholar]
- 36.Sastry M, Ketchem RR, Crescenzi O, Weber C, Lubienski MJ, Hidaka H, Chazin WJ. The three-dimensional structure of Ca2+-bound calcyclin: Implications for Ca2+-signal transduction by S100 proteins. Structure. 1998;6:223–231. doi: 10.1016/s0969-2126(98)00023-9. [DOI] [PubMed] [Google Scholar]
- 37.Otwinowski W, Minor F. Processing of X-ray diffraction data collected in oscillation mode. Methods Enzymol. 1997;276:307–326. doi: 10.1016/S0076-6879(97)76066-X. [DOI] [PubMed] [Google Scholar]
- 38.Collaborative Computational Project Number 4 The CCP4 suite: Programs for protein crystallography. Acta Crystallogr. 1994;D50:760–763. doi: 10.1107/S0907444994003112. [DOI] [PubMed] [Google Scholar]
- 39.Schneider TR, Sheldrick GM. Substructure solution with SHELXD. Acta Crystallogr. 2002;D58:1772–1779. doi: 10.1107/s0907444902011678. [DOI] [PubMed] [Google Scholar]
- 40.Sheldrick GM. Macromolecular phasing with SHELXE. Z. Kristallogr. 2002;217:644–650. [Google Scholar]
- 41.Lamzin VS, Perrakis A, Wilson KS. International Tables for Crystallography: The ARP/WARP suite for automated construction and refinement of protein models. Kluwer Academic Publishers; Dordrecht, The Netherlands: 2001. Volume F: Crystallography of biological macromolecules. [Google Scholar]
- 42.Emsley P, Cowtan K. Coot: Model-building tools for molecular graphics. Acta Crystallogr. 2004;D60:2126–2132. doi: 10.1107/S0907444904019158. [DOI] [PubMed] [Google Scholar]
- 43.Hooft RW, Vriend G, Sander C, Abola EE. Errors in protein structures. Nature. 1996;381 doi: 10.1038/381272a0. [DOI] [PubMed] [Google Scholar]
- 44.Laskowski R, MacArthur M, Moss D, Thornton J. PROCHECK: A program to check the stereochemical quality of protein structures. J. Appl. Crystallogr. 1993;26:283–291. [Google Scholar]
- 45.Krissinel E, Henrick K. Secondary-structure matching (SSM), a new tool for fast protein structure alignment in three dimensions. Acta Crystallogr. 2004;D60:2256–2268. doi: 10.1107/S0907444904026460. [DOI] [PubMed] [Google Scholar]
- 46.Holm L, Sander C. Mapping the protein universe. Science. 1996;273:595–603. doi: 10.1126/science.273.5275.595. [DOI] [PubMed] [Google Scholar]
- 47.Holm L, Park J. DaliLite workbench for protein structure comparison. Bioinformatics. 2000;16:566–567. doi: 10.1093/bioinformatics/16.6.566. [DOI] [PubMed] [Google Scholar]
- 48.Yap KL, Ames JB, Swindells MB, Ikura M. Vector geometry mapping. A method to characterize the conformation of helix-loop-helix calcium-binding proteins. Methods Mol. Biol. 2002;173:317–324. doi: 10.1385/1-59259-184-1:317. [DOI] [PubMed] [Google Scholar]
- 49.Marion D, Ikura M, Tschudin R, Bax A. Rapid recording of 2d NMR-spectra without phase cycling: Application to the study of hydrogen-exchange in proteins. J. Magn. Reson. 1989;85:393–399. [Google Scholar]
- 50.Delaglio F, Grzesiek S, Vuister GW, Zhu G, Pfeifer J, Bax A. NMRPipe: A multidimensional spectral processing system based on UNIX pipes. J. Biomol. NMR. 1995;6:277–293. doi: 10.1007/BF00197809. [DOI] [PubMed] [Google Scholar]
- 51.Zhu GA, Bax A. 2-Dimensional linear prediction for signals truncated in both dimensions. J. Magn. Reson. 1992;98:192–199. [Google Scholar]
- 52.Zhu G, Bax A. Improved linear prediction for truncated signals of known phase. J. Magn. Reson. 1990;90:405–410. [Google Scholar]
- 53.Live DH, Davis D, Agosta W, Cowburn D. Long range hydrogen bond mediated effects in peptides: Nitrogen-15 NMR study of gramicidin S in water and organic solvents. J. Am. Chem. Soc. 1984;106:1939–1941. [Google Scholar]
- 54.Spera S, Bax A. Empirical correlation between protein backbone conformation and C-α and C-β C-13 nuclear-magnetic-resonance chemical-shifts. J. Am. Chem. Soc. 1991;113:5490–5492. [Google Scholar]
- 55.Edison AS, Abildgaard F, Westler WM, Mooberry ES, Markley JL. Practical introduction to theory and implementation of multinuclear, multidimensional nuclear magnetic resonance experiments. Methods Enzymol. 1994;239:3–79. doi: 10.1016/s0076-6879(94)39003-7. [DOI] [PubMed] [Google Scholar]
- 56.Mori S, Abeygunawardana C, Johnson MO, van Zijl PC. Improved sensitivity of HSQC spectra of exchanging protons at short interscan delays using a new fast HSQC (FHSQC) detection scheme that avoids water saturation. J. Magn. Reson., Ser. B. 1995;108:94–98. doi: 10.1006/jmrb.1995.1109. [DOI] [PubMed] [Google Scholar]
- 57.Kay L, Marion D, Bax A. J. Magn. Reson. 1989;84:72–84. [Google Scholar]
- 58.Bax A, Davis D. J. Magn. Reson. 1985;65:355–360. [Google Scholar]
- 59.Cavanagh J, Rance M. Suppression of cross-relaxation effects in Tocsy spectra via a modified dipsi-2 mixing sequence. J. Magn. Reson. 1992;96:670–678. [Google Scholar]
- 60.Ikura M, Bax A, Clore GM, Gronenborn AM. Detection of nuclear overhauser effects between degenerate amide proton resonances by heteronuclear 3-dimensional nuclear-magnetic-resonance spectroscopy. J. Am. Chem. Soc. 1990;112:9020–9022. [Google Scholar]
- 61.Grzesiek S, Bax A. An efficient experiment for sequential backbone assignment of medium-sized isotopically enriched proteins. J. Magn. Reson. 1992;99:201–207. [Google Scholar]
- 62.Muhandiram DR, Xu GY, Kay LE. An enhanced-sensitivity pure absorption gradient 4d N-15, C-13-edited noesy experiment. J. Biomol. NMR. 1993;3:463–470. [Google Scholar]
- 63.Wittekind M, Mueller L. Hncacb, a high-sensitivity 3d NMR experiment to correlate amide-proton and nitrogen resonances with the α-carbon and β-carbon resonances in proteins. J. Magn. Reson., Ser. B. 1993;101:201–205. [Google Scholar]
- 64.Grzesiek S, Bax A. Improved 3d triple-resonance NMR techniques applied to a 31-kDa protein. J. Magn. Reson. 1992;96:432–440. [Google Scholar]
- 65.Yamazaki T, Lee W, Revington M, Mattiello DL, Dahlquist FW, Arrowsmith CH, Kay LE. An Hnca pulse scheme for the backbone assignment of N-15,C-13,H-2-labeled proteins: Application to a 37-kDa Trp repressor DNA complex. J. Am. Chem. Soc. 1994;116:6464–6465. [Google Scholar]
- 66.Bax A, Pochapsky SS. Optimized recording of heteronuclear multidimensional NMR-spectra using pulsed field gradients. J. Magn. Reson. 1992;99:638–643. [Google Scholar]
- 67.Linse S. Calcium binding to proteins studied via competition with chromophoric chelators. Methods Mol. Biol. 2002;173:15–24. doi: 10.1385/1-59259-184-1:015. [DOI] [PubMed] [Google Scholar]
- 68.Andre I, Linse S. Measurement of Ca2+-binding constants of proteins and presentation of the CaLigator software. Anal. Biochem. 2002;305:195–205. doi: 10.1006/abio.2002.5661. [DOI] [PubMed] [Google Scholar]
- 69.Philo JS. Improved methods for fitting sedimentation coefficient distributions derived by time-derivative techniques. Anal. Biochem. 2006;354:238–246. doi: 10.1016/j.ab.2006.04.053. [DOI] [PubMed] [Google Scholar]
- 70.Dukhanina EA, Dukhanin AS, Lomonosov MY, Lukanidin EM, Georgiev GP. Spectral studies on the calcium-binding properties of Mts1 protein and its interaction with target protein. FEBS Lett. 1997;410:403–406. doi: 10.1016/s0014-5793(97)00576-0. [DOI] [PubMed] [Google Scholar]
- 71.Garrett SC, Hodgson L, Rybin A, Toutchkine A, Hahn KM, Lawrence DS, Bresnick AR. A biosensor of S100A4 metastasis factor activation: Inhibitor screening and cellular activation dynamics. Biochemistry. 2008;47:986–996. doi: 10.1021/bi7021624. [DOI] [PMC free article] [PubMed] [Google Scholar]
- 72.Gibbs FE, Wilkinson MC, Rudland PS, Barraclough R. Interactions in vitro of p9Ka, the rat S-100-related, metastasis-inducing, calcium-binding protein. J. Biol. Chem. 1994;269:18992–18999. [PubMed] [Google Scholar]
- 73.Pedrocchi M, Schafer BW, Durussel I, Cox JA, Heizmann CW. Purification and characterization of the recombinant human calcium-binding S100 proteins CAPL and CACY. Biochemistry. 1994;33:6732–6738. doi: 10.1021/bi00187a045. [DOI] [PubMed] [Google Scholar]
- 74.Dutta K, Cox CJ, Huang H, Basavappa R, Pascal SM. Calcium coordination studies of the metastatic Mts1 protein. Biochemistry. 2002;41:4239–4245. doi: 10.1021/bi012061v. [DOI] [PubMed] [Google Scholar]
- 75.Maler L, Potts BC, Chazin WJ. High resolution solution structure of apo calcyclin and structural variations in the S100 family of calcium-binding proteins. J. Biomol. NMR. 1999;13:233–247. doi: 10.1023/a:1008315517955. [DOI] [PubMed] [Google Scholar]
- 76.Otterbein LR, Kordowska J, Witte-Hoffmann C, Wang CL, Dominguez R. Crystal structures of S100A6 in the Ca2+-free and Ca2+-bound states: The calcium sensor mechanism of S100 proteins revealed at atomic resolution. Structure. 2002;10:557–567. doi: 10.1016/s0969-2126(02)00740-2. [DOI] [PubMed] [Google Scholar]
- 77.Rustandi RR, Baldisseri DM, Inman KG, Nizner P, Hamilton SM, Landar A, Landar A, Zimmer DB, Weber DJ. Three-dimensional solution structure of the calcium-signaling protein apo-S100A1 as determined by NMR. Biochemistry. 2002;41:788–796. doi: 10.1021/bi0118308. [DOI] [PubMed] [Google Scholar]
- 78.Drohat AC, Amburgey JC, Abildgaard F, Starich MR, Baldisseri D, Weber DJ. Solution structure of rat apo-S100B(ββ) as determined by NMR spectroscopy. Biochemistry. 1996;35:11577–11588. doi: 10.1021/bi9612226. [DOI] [PubMed] [Google Scholar]
- 79.Chaudhuri D, Horrocks WD, Jr., Amburgey JC, Weber DJ. Characterization of lanthanide ion binding to the EF-hand protein S100 β by luminescence spectroscopy. Biochemistry. 1997;36:9674–9680. doi: 10.1021/bi9704358. [DOI] [PubMed] [Google Scholar]
- 80.Inman KG, Baldisseri DM, Miller KE, Weber DJ. Backbone dynamics of the calcium-signaling protein apoS100B as determined by 15N NMR relaxation. Biochemistry. 2001;40:3439–3448. doi: 10.1021/bi0027478. [DOI] [PubMed] [Google Scholar]
- 81.Linse S, Brodin P, Johansson C, Thulin E, Grundstrom T, Forsen S. The role of protein surface charges in ion binding. Nature. 1988;335:651–652. doi: 10.1038/335651a0. [DOI] [PubMed] [Google Scholar]
- 82.Rustandi RR, Drohat AC, Baldisseri DM, Wilder PT, Weber DJ. The Ca2+-dependent interaction of S100B(ββ) with a peptide derived from p 53. Biochemistry. 1998;37:1951–1960. doi: 10.1021/bi972701n. [DOI] [PubMed] [Google Scholar]
- 83.Weber DJ, Rustandi R, Carrier F, Zimmer DB. Calcium: The molecular basis of calcium action in biology and medicine. Kluwer Academic Publishers; Dordrecht, The Netherlands: 2000. Interaction of dimeric S100B(ββ) with the tumor suppressor protein: A model for Ca-dependent S100-target protein interactions; pp. 469–487. [Google Scholar]
- 84.Inman KG, Yang R, Rustandi RR, Miller KE, Baldisseri DM, Weber DJ. Solution NMR structure of S100B bound to the high-affinity target peptide TRTK-12. J. Mol. Biol. 2002;324:1003–1014. doi: 10.1016/s0022-2836(02)01152-x. [DOI] [PubMed] [Google Scholar]
- 85.Wuthrich K. NMR of proteins and nucleic acids. John Wiley; New York: 1986. [Google Scholar]
- 86.Wishart DS, Sykes BD. The C-13 chemical-shift index: A simple method for the identification of protein secondary structure using C-13 chemical-shift data. J. Biomol. NMR. 1994;4:171–180. doi: 10.1007/BF00175245. [DOI] [PubMed] [Google Scholar]
- 87.Kordowska J, Stafford WF, Wang CL. Ca2+ and Zn2+ bind to different sites and induce different conformational changes in human calcyclin. Eur. J. Biochem. 1998;253:57–66. doi: 10.1046/j.1432-1327.1998.2530057.x. [DOI] [PubMed] [Google Scholar]
- 88.Rustandi RR, Baldisseri DM, Drohat AC, Weber DJ. Structural changes in the C-terminus of Ca2+-bound rat S100B(ββ) upon binding to a peptide derived from the C-terminal regulatory domain of p 53. Protein Sci. 1999;8:1743–1751. doi: 10.1110/ps.8.9.1743. [DOI] [PMC free article] [PubMed] [Google Scholar]
- 89.Markowitz J, Rustandi RR, Varney KM, Wilder PT, Udan R, Wu SL, Horrocks WD, Weber DJ. Calcium-binding properties of wild-type and EF-hand mutants of S100B in the presence and absence of a peptide derived from the C-terminal negative regulatory domain of p 53. Biochemistry. 2005;44:7305–7314. doi: 10.1021/bi050321t. [DOI] [PubMed] [Google Scholar]
- 90.Peersen OB, Madsen TS, Falke JJ. Intermolecular tuning of calmodulin by target peptides and proteins: Differential effects on Ca2+ binding and implications for kinase activation. Protein Sci. 1997;6:794–807. doi: 10.1002/pro.5560060406. [DOI] [PMC free article] [PubMed] [Google Scholar]
- 91.Lee J, Ishihara A, Oxford G, Johnson B, Jacobson K. Regulation of cell movement is mediated by stretch-activated calcium channels. Nature. 1999;400:382–386. doi: 10.1038/22578. [DOI] [PubMed] [Google Scholar]
- 92.Berridge MJ, Lipp P, Bootman MD. The versatility and universality of calcium signalling. Nat. Rev. Mol. Cell Biol. 2000;1:11–21. doi: 10.1038/35036035. [DOI] [PubMed] [Google Scholar]
- 93.Kindzelskii AL, Petty HR. Intracellular calcium waves accompany neutrophil polarization, formylmethionylleucylphenylalanine stimulation, and phagocytosis: A high speed microscopy study. J. Immunol. 2003;170:64–72. doi: 10.4049/jimmunol.170.1.64. [DOI] [PubMed] [Google Scholar]
- 94.Clapham DE. Calcium signaling. Cell. 2007;131:1047–1058. doi: 10.1016/j.cell.2007.11.028. [DOI] [PubMed] [Google Scholar]
- 95.Dempsey AC, Walsh MP, Shaw GS. Unmasking the annexin I interaction from the structure of Apo-S100A11. Structure. 2003;11:887–897. doi: 10.1016/s0969-2126(03)00126-6. [DOI] [PubMed] [Google Scholar]
- 96.Rety S, Osterloh D, Arie JP, Tabaries S, Seeman J, Russo-Marie F, Gerke V, Lewit-Bentley A. Structural basis of the Ca2+-dependent association between S100C (S100A11) and its target, the N-terminal part of annexin I. Structure. 2000;8:175–184. doi: 10.1016/s0969-2126(00)00093-9. [DOI] [PubMed] [Google Scholar]
- 97.Arnesano F, Banci L, Bertini I, Fantoni A, Tenori L, Viezzoli MS. Structural interplay between calcium(II) and copper(II) binding to S100A13 protein. Angew. Chem., Int. Ed. 2005;44:6341–6344. doi: 10.1002/anie.200500540. [DOI] [PubMed] [Google Scholar]
- 98.Li M, Zhang PF, Pan XW, Chang WR. Crystal structure study on human S100A13 at 2.0 Å resolution. Biochem. Biophys. Res. Commun. 2007;356:616–621. doi: 10.1016/j.bbrc.2007.03.014. [DOI] [PubMed] [Google Scholar]
- 99.Maler L, Sastry M, Chazin WJ. A structural basis for S100 protein specificity derived from comparative analysis of apo and Ca2+-calcyclin. J. Mol. Biol. 2002;317:279–290. doi: 10.1006/jmbi.2002.5421. [DOI] [PubMed] [Google Scholar]
- 100.Brodersen DE, Etzerodt M, Madsen P, Celis JE, Thogersen HC, Nyborg J, Kjeldgaard M. EF-hands at atomic resolution: The structure of human psoriasin (S100A7) solved by MAD phasing. Structure. 1998;6:477–489. doi: 10.1016/s0969-2126(98)00049-5. [DOI] [PubMed] [Google Scholar]
- 101.Rety S, Sopkova J, Renouard M, Osterloh D, Gerke V, Tabaries S, Russo-Marie F, Lewit-Bentley A. The crystal structure of a complex of p11 with the annexin II N-terminal peptide. Nat. Struct. Biol. 1999;6:89–95. doi: 10.1038/4965. [DOI] [PubMed] [Google Scholar]
- 102.Rustandi RR, Baldisseri DM, Weber DJ. Structure of the negative regulatory domain of p 53 bound to S100B(ββ) Nat. Struct. Biol. 2000;7:570–574. doi: 10.1038/76797. [DOI] [PubMed] [Google Scholar]
- 103.Bhattacharya S, Large E, Heizmann CW, Hemmings B, Chazin WJ. Structure of the Ca2+/S100B/NDR kinase peptide complex: Insights into S100 target specificity and activation of the kinase. Biochemistry. 2003;42:14416–14426. doi: 10.1021/bi035089a. [DOI] [PubMed] [Google Scholar]
- 104.Kligman D, Hilt DC. The S100 protein family. Trends Biochem. Sci. 1988;13:437–443. doi: 10.1016/0968-0004(88)90218-6. [DOI] [PubMed] [Google Scholar]
- 105.Ishikawa K, Nakagawa A, Tanaka I, Suzuki M, Nishihira J. The structure of human MRP8, a member of the S100 calcium-binding protein family, by MAD phasing at 1.9 Å resolution. Acta Crystallogr. 2000;D56:559–566. doi: 10.1107/s0907444900002833. [DOI] [PubMed] [Google Scholar]
- 106.Itou H, Yao M, Fujita I, Watanabe N, Suzuki M, Nishihira J, Tanaka I. The crystal structure of human MRP14 (S100A9), a Ca2+-dependent regulator protein in inflammatory process. J. Mol. Biol. 2002;316:265–276. doi: 10.1006/jmbi.2001.5340. [DOI] [PubMed] [Google Scholar]
- 107.Moroz OV, Antson AA, Murshudov GN, Maitland NJ, Dodson GG, Wilson KS, Skibshoj I, Lukanidin EM, Bronstein IB. The three-dimensional structure of human S100A12. Acta Crystallogr. 2001;D57:20–29. doi: 10.1107/s090744490001458x. [DOI] [PubMed] [Google Scholar]
- 108.Svensson LA, Thulin E, Forsen S. Proline cistrans isomers in calbindin D9k observed by X-ray crystallography. J. Mol. Biol. 1992;223:601–606. doi: 10.1016/0022-2836(92)90976-q. [DOI] [PubMed] [Google Scholar]