

Abstract
Important biological and pathological properties are often conserved across species. Although several mouse leukemia models have been well established, the genes deregulated in both human and murine leukemia cells have not been studied systematically. We performed a serial analysis of gene expression (SAGE) analysis on gene expression in both human and murine MLL-ELL or MLL-ENL leukemia cells, and identified 88 genes that appeared to be significantly deregulated in both types of leukemia cells, including 57 genes not reported previously as being deregulated in MLL-associated leukemias. These changes were validated by quantitative PCR. The most up-regulated genes include several HOX genes (e.g., HOX A5, HOXA9 and HOXA10) and MEIS1 that are the typical hallmark of MLL-rearrangement leukemia. The most down-regulated genes include LTF, LCN2, MMP9, S100A8, S100A9, PADI4, TGFBI and CYBB. Notably, the up-regulated genes are enriched in Gene Ontology terms such as “gene expression” and “transcription”, whereas the down-regulated genes are enriched in “signal transduction” and “apoptosis”. We showed that the CpG islands of the down-regulated genes are hypermethylated. We also showed that seven individual microRNAs from the mir-17-92 cluster, which are known to be overexpressed in human MLL-rearrangement leukemias, are also consistently overexpressed in mouse MLL-rearrangement leukemia cells. Nineteen possible targets of these microRNAs were identified and two of them (i.e., APP and RASSF2) were confirmed further by luciferase reporter and mutagenesis assays. The identification and validation of consistent changes of gene expression in human and murine MLL-rearrangement leukemias provides important insights into the genetic base for MLL-associated leukemogenesis.
Keywords: MLL-rearrangement leukemia, evolutionarily conservation, gene expression, gene ontology, DNA methylation
INTRODUCTION
Chromosome translocations are among the most common genetic abnormalities in human leukemia. The mixed lineage leukemia (MLL) gene was identified as a common target of chromosomal translocations associated with human acute leukemias (1, 2). MLL is located on human chromosome 11 band q23 and on mouse chromosome 9. More than 50 different loci are rearranged in11q23 leukemias involving MLL in either acute myeloid leukemia (AML) or acute lymphoblastic leukemia (ALL) (3). MLL rearrangements are associated with a poor prognosis (4). MLL-ELL and MLL-ENL that result from t(11;19)(q23;p13.1) and t(11;19)(q23;p13.3) respectively (1, 5) are two common examples of these rearrangements. These two fusions are frequently involved in human AML, while MLL-ENL is also involved in human ALL. The translocations result in an in-frame fusion of the N-terminus of the MLL gene and the C-terminus of each partner gene. Retroviral-mediated gene transfer of MLL-ENL and of MLL-ELL transforms primary myeloid progenitor cells and cause acute myeloid leukemia in mice (6, 7).
Gene expression profiles differ between distinct subtypes of leukemia and provide specific markers for clinical diagnosis. It is commonly observed that important biological/pathological properties are often conserved across species (8, 9). Model organisms have contributed substantially to our understanding of the etiology of human disease and the development of new treatment methodologies (10). However, although genetically engineered mouse leukemia models have been well established (6, 7, 11, 12), there are few systematic studies to identify and study the genes that exhibit similar abnormal expression patterns in both human and murine leukemia cells. To perform an interspecies gene expression comparative study in leukemia, we used the serial analysis of gene expression (SAGE) technique (13) to compare gene expression between MLL-ELL or MLL-ENL myeloid leukemia progenitor cells and normal myeloid progenitor cells in both humans and mice. Herein we report the identification and validation of differentially expressed genes commonly present in both human and murine MLL-ELL or MLL-ENL leukemias.
MATERIALS AND METHODS
Patient samples
The patient samples were obtained at the time of diagnosis and with informed consent at the University of Chicago, and were stored in liquid nitrogen until used.
SAGE assay and data analysis
Cell purification, total RNA isolation, cDNA synthesis, and SAGE were carried out according to our established procedures (13-15). SAGE tag sequences were extracted with SAGE 2000 software. Tag counts were converted to counts per 100,000 and the expression data were cross-linked to UniGene clusters by extracting the 3′-most NlaIII SAGE tag for each transcript in each UniGene clusters. Only tags that matched to a single gene cluster were taken into account. All SAGE tags mapped to the same gene were then combined and the sum of their counts in a given sample represented the expression level/signal of that gene in that sample (16, 17). Chi-Square test (i.e., χ2 test) was used to identify differentially expressed genes, as Man et al.'s analysis (18) showed that Chi-square test has the best power and robustness in SAGE data analysis.
Functional classification and annotation of the candidate genes
We used the Database for Annotation, Visualization and Integrated Discovery (DAVID) (version 2008; http://david.abcc.ncifcrf.gov) for the functional classification and annotation of the candidate genes. DAVID provides a comprehensive set of functional annotation tools for investigators to understand biological meaning behind large list of genes (19). A gene cluster means a set of genes belonging to the same functional category as defined by DAVID.
Quantitative real-time PCR (qPCR) assays of protein-coding or microRNA (miRNA) genes and data analysis
We performed qPCR to determine expression of protein-coding genes with SYBR Green dye using kits from Qiagene (Valencia, CA) and of miRNAs using TaqMan qPCR kits from Applied Biosystems (Foster City, CA). PGK1 or GAPDH was used as endogenous controls for protein-coding genes, whereas U6 RNA was used as an endogenous control for miRNAs. PCR reactions and data analyses were performed as described previously (20, 21).
Methylation-specific PCR (MSP)
Methylation status of the promoter region was determined by the MSP method (22). The primers were designed to anneal specifically to methylated and unmethylated CpG dinucleotides in promoter regions of genes using the Primer3 program. Genomic DNA was isolated using QIAamp DNA mini kit (Qiagen). 1μg DNA was used for bisulfite modification using the CpGenome DNA modification kit (Chemicon) according to the manufacturer's instructions. The bisulfite-converted DNA was amplified in a total volume of 20 μl using GeneAmp Gold buffer containing 4mM MgCl2, 0.5μM of each primer, 0.2mM dNTPs, 5μg BSA and 1.25 unit of AmpliTaq Gold DNA polymerase (Roche). “Hot start” PCR was performed for 30 cycles, which consists of denaturation at 95°C for 30 seconds, annealing at 60°C for 30 seconds, and extension at 72°C for 45 seconds, followed by a final 7 minute extension for all primer sets. The products were separated on 10% polyacrylamide gels.
Cell Culture and 5-Aza-2′-deoxycytidine (5-Aza-CdR; Decitabine) treatment
Human leukemia cell lines were grown at 37°C under 5% CO2 in RPMI 1640 medium (Invitrogen) supplemented with 10% fetal bovine serum (Invitrogen), 1% penicillin/streptomycin and 1% HEPES. The cells were plated at 2×10⁶ per flask in 4 ml of medium. After 24 hr, cells were exposed to 5-Aza-CdR (Fluka) at 1μM for 96 hr. In parallel, untreated cells were used as a control. After 48 hr of continuous exposure of 5-Aza-CdR, the medium was changed. Cells were harvested after an additional 48 hr of incubation. Then, total RNA and genomic DNA were isolated from the treated and untreated cell lines for further qPCR and MSP assay, respectively.
Luciferase reporter and mutagenesis assay
MiR-17 expression plasmid or its control plasmid (i.e., MSCVpuro) was co-transfected into HEK293T cells with a single report plasmid (pMIR-Report plasmid; Ambion, Austin, TX) containing either wild-type or mutated 3′ untranslated region (3′UTR) of an individual predicted target gene. Luciferase was measured 42 hours after transfection. The firefly luciferase activity was then normalized to β-galactosidase activity. Experiments were repeated three times independently.
RESULTS
Eighty-eight genes were identified by SAGE analysis to be significantly abnormally expressed in both human and murine MLL-ELL and/or MLL-ENL leukemia
We employed a modified SAGE technique (13) to compare gene expression profiles between MLL-ELL or MLL-ENL myeloid leukemia progenitor cells and normal myeloid progenitor cells (CD15+ or Gr-1+) in both humans and mice. We analyzed four patient samples (two with each fusion) and two retrovirally-induced mouse leukemias containing either MLL-ELL or MLL-ENL fusions, and a leukemic mouse cell line with an MLL-ELL fusion (Table 1). 484,303 SAGE tags were identified from the nine samples (total SAGE tag counts of each sample varies from 40,000 to 100,000, with 53,811 tags per sample on average), yielding 103,899 unique tags in human and 60,993 in mouse samples (see Table 1).
Table 1.
SAGE libraries of human and mouse samplesa
| SAGE Library ID | Fusion | Clone(s)/description | Total tags | Unique tags |
|---|---|---|---|---|
| Hs_N | None | Human normal controlb | 105,006 | 38,871 |
| Hs_ELL-1 | MLL-ELL | 46, XX, t(11;19)(q23;p13.1); 88% | 42,450 | 15,385 |
| Hs_ELL-2 | MLL-ELL | 46, XY, t(11;19)(q23;p13.1); 100% | 48,704 | 17,856 |
| Hs_ENL-1 | MLL-ENL | 46,XY, t(11;19)(q23;p13.3); 95% | 41,151 | 12,801 |
| Hs_ENL-2 | MLL-ENL | 46, XY, t(11;19)(q23;p13.3); 97% | 49,807 | 18,986 |
| Mm_N | None | Mouse normal controlc | 70,140 | 22,035 |
| Mm_ELL-1 | MLL-ELL | MLL-ELL retroviral moused | 44,741 | 13,032 |
| Mm_ELL-2 | MLL-ELL | MLL-ELL retroviral mouse cell linee | 41,819 | 10,526 |
| Mm_ENL-1 | MLL-ENL | MLL-ENL retroviral mousef | 40,485 | 15,400 |
CD15+ and Gr-1+ myeloid progenitor cells were isolated from bone marrow samples for human and mouse samples respectively. 484,303 total SAGE tags were obtained for the nine samples, with a total of 103,899 unique SAGE tags in the human and 60,993 in the mouse samples. Hs: Homo sapiens (human); Mm: Mus musculus (mouse).
Human normal CD15+ myeloid progenitor cells; for details, see Ref. (14).
Mouse normal Gr-1+ myeloid progenitor cells; for details, see Ref. (15).
Mouse bone marrow cells with retrovirus-induced MLL-ELL fusion; for details, see Ref. (7).
Mouse cell line was derived from a leukemia mouse transduced with an MLL-ELL fusion.
Mouse bone marrow cells with retrovirus-induced MLL-ENL fusion; for details, see Ref. (6).
We identified 88 candidate genes that appeared to be deregulated in both human and murine MLL-ELL and/or MLL-ENL leukemias. Of them, 6 and 26 genes are up- and down-regulated, respectively, in both types of leukemia; Three and 13 genes are up- and down-regulated, respectively, in MLL-ELL leukemias alone; Twenty-three and 17 genes are up- and down-regulated, respectively, in MLL-ENL leukemias alone (see Fig. 1a and Supplementary Table 1). All the significant genes have at least 3 fold difference in expression (tag counts per 100,000) between each leukemia sample and the normal control, and with a Chi-square test P-value < 0.05. As this criterion is stringent, it therefore limits the total number of the candidate genes identified.
Figure 1. Expression profiles of candidate genes.
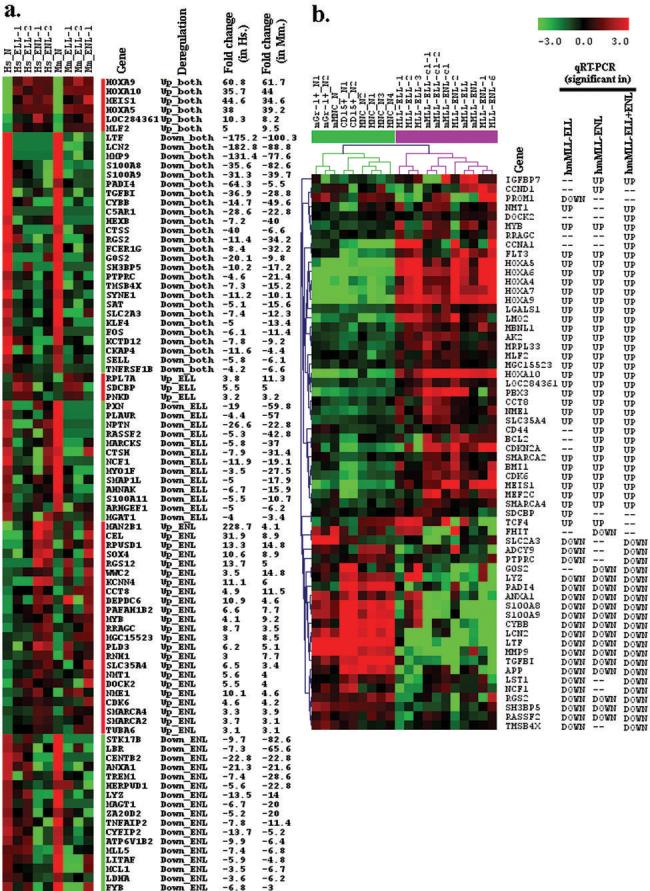
(a) Expression profiles of the 88 significant genes from 9 human and mouse samples as detected by SAGE. The genes have at least 3 fold difference in expression value (tag number per 100,000 of total SAGE tag in each library after normalization) between each leukemia sample and the normal control sample (human CD15+; mouse: Gr-1+), and with a Chi-square test P-value <0.05. See Supplementary Table 1 for details. (b) Expression profies of the 60 significant genes from 20 human and mouse samples as detected by qPCR. Because the number of mouse samples is too small, we combined human and mouse quantitative real-time PCR data together for significance analysis with SAM. Data are presented as ΔCT. Unsupervised, average linkage hierarchical clustering was performed with Pearson Correlation as distance. All the significant genes have a q value <0.05, with the overall FDR less than 5%. Expression data was mean centered. “_ELL”, MLL-ELL; “_ENL”, MLL-ENL; “_cl”, cell line; “_N”, normal control; “m” or “Mm.”, mouse; “h” or “Hs.”, human; “hm”, human and mouse. In the columns of qRT-PCR, “--”means “no significant change”.
Notably, the four most up-regulated genes (each has at least a 30-fold change in expression) in both types of human and mouse leukemia samples are three homeobox (HOX) genes (i.e., HOXA5, HOXA9 and HOXA10) and one HOX cofactor MEIS1 (see Fig. 1a) The eight most down-regulated genes (each has at least a 30-fold change in expression on average) in both types of human and mouse leukemia samples include LTF, LCN2, MMP9, S100A8, S100A9, PADI4, TGFBI and CYBB (see Supplementary Table 1). Note that, the fold change of some up- or down-regulated genes may be overestimated because of the limited number of SAGE tags examined (40,000 to 100,000 tags per sample).
Although 56 genes were identified to be significantly deregulated in only one type of leukemias, many of them exhibited a similar deregulation pattern in both types of leukemias (see Supplementary Table 1), albeit they were significant only in one according to our stringent criterion. If more samples were analyzed and/or a less stringent criterion was used, many of these genes would appear to be deregulated in both MLL-ELL and MLL-ENL leukemias.
31 of the 88 genes identified by SAGE have been reported previously to be deregulated in MLL-rearrangement leukemia
Much effort has been expended previously to identify candidate genes that might be involved in MLL-rearrangement leukemia using different methods such as microarray and qPCR. To obtain a comprehensive list of candidate genes involved in MLL-rearrangement leukemia, we searched 35 relevant publications (see Supplementary Table 2a), and collected a total of 1,647 genes that were reported to be significantly deregulated in MLL-rearrangement leukemia. The top two most frequently reported genes are MEIS1 and HOXA9, having been reported as up-regulated genes by 16 and 15 different publications, respectively. Among the 1,647 genes, 370 were reported by at least two different studies; Of them, only 10 genes (all were reported by only two publications) have contradictory information regarding whether they are up- or down-regulated in MLL-rearrangement leukemia, and the remaining 360 genes were reported consistently by variously different studies, with 213 up- and 147 down-regulated in MLL-rearrangement leukemia compared to other subtypes of acute leukemias and/or normal controls. We found that 31 out of the 88 genes (35%) identified from our SAGE analysis were reported by previous studies (see Supplementary Table 2b).
Validation of 81 genes by a large-scale qPCR assay
To validate the deregulation patterns of the genes identified from our SAGE analysis and those from the previous studies, we performed a large-scale qPCR validation for 81 genes in 20 samples. The 81 genes (see Supplementary Table 3) include 43 identified from our SAGE analysis and 38 reported only by others; Among the 43 genes identified by SAGE, 19 were also reported by others. The 20 samples include 12 human and 8 mouse samples. The human samples include three MLL-ELL and three MLL-ENL leukemia samples, in addition to six human normal control samples. The mouse samples include two retrovirally-induced mouse leukemia samples containing either MLL-ELL or MLL-ENL fusion, two leukemia cell lines with MLL-ELL fusions and one leukemia cell line with an MLL-ENL fusion, in addition to three murine normal control samples.
We found that 60 (74%) out of the 81 tested genes appeared to be significantly deregulated in leukemia samples (see Fig. 1b). Of these, 50 candidate genes were deregulated in human and mouse MLL-ELL leukemia (29 up- and 21 down-regulated) and 48 were deregulated in human and mouse MLL-ENL leukemia (32 up- and 16 down-regulated), whereas 55 genes appeared to be significantly deregulated (34 up- and 21 down-regulated) when combining the MLL-ELL and MLL-ENL leukemia samples together. As shown in Supplementary Table 3, 36 (84%) out of the 43 SAGE candidate genes were confirmed to be significantly deregulated in leukemia samples in a similar mode (i.e., up- or down-regulated) to SAGE data, whereas only 31 (54%) out of the 57 genes reported previously were confirmed here in a similar mode to previous report(s). Notably, MYB and SMARCA4 were detected by SAGE as being up-regulated but were reported by others as being down-regulated in MLL-rearrangement leukemia, the opposite is true for PTPRC, S100A8, ANXA1 and NCF1; our qPCR result of these 6 genes is consistent with our SAGE analysis rather than previous reports (see Supplementary Table 3). In addition, four genes reported only by others including PROM1, ADCY9, LST1 and TCF4 were detected by qPCR as being deregulated in MLL-rearrangement leukemia but in a different mode from previous reports.
Functional classification and annotation of the candidate genes identified by SAGE
To gain further insight into the biological importance of these 88 candidate genes, we analyzed the functional categories of known genes in terms of Gene Ontology using the DAVID tools (19). One gene (i.e., MAGT1; down-regulated in MLL-ENL leukemia) is not in the DAVID gene database and therefore only 87 genes were analyzed. We first performed Gene Functional Classification for the 87 genes, and found that there were four gene clusters (only the clusters having at least 3 members were considered). Gene cluster 1 contains S100A8, S100A9 and S100A11 (enrichment score 1.98); all of them were down-regulated in leukemia. Gene cluster 2 contains CTSS, CTSH and MAN2B1 (enrichment score 1.18); the first two were down-regulated whereas the last one was up-regulated in leukemia. Gene cluster 3 contains ARHGEF1, CENTB2, and SMAP1L (enrichment score 0.86); all of them were down-regulated in leukemia. Remarkably, gene cluster 4 contains 8 genes including HOXA5, HOXA9, HOXA10, MEIS1, MYB, SOX4, KLF4 and MLL5 (enrichment score 0.75); the first six were up-regulated whereas the last two were down-regulated in leukemias.
We also conducted a gene-enrichment and functional annotation analysis on the 87 genes with the Functional Annotation tools. As shown in Supplementary Table 4, among the 288 GO terms analyzed, our SAGE-detected candidate genes are specially enriched in 40 GO terms compared to the whole set of genes (30,000) in the human genome, with at least two-fold higher enrichment (P-value < 0.05) in each GO term such as “cell differentiation”, “cell development”, “defense response”, “apoptosis” and “signal transduction”. Remarkably, we found that our candidate genes enriched in some GO terms are either preferentially up-regulated (e.g., those in “gene expression”) or down-regulated (e.g., those in “apoptosis” or “signal transduction”) in our leukemia samples.
Therefore, we further compared the percentage of up-regulated genes with that of down-regulated genes enriched in each GO term. We found that in 125 GO terms, the percentage of enriched up-regulated gene in the whole 32 up-regulated genes is at least 2-fold higher or lower than that of enriched down-regulated genes in the whole 55 down-regulated genes (see Supplementary Table 5). As exemplified in Figure 2, up-regulated genes have a much higher percentage of enrichment in GO terms such as “gene expression”, “transcription” and “regulation of transcription” compared to down-regulated genes; opposite is true in GO terms such as “apoptosis”, “cell death”, “extracellular space”, “immune response”, “response to stress”, “signal transduction” and “cell communication” (see Supplementary Table 6 for the detailed gene lists). For example, HOXA5, HOXA9, HOXA10, MEIS1, MYB, SMARCA2, SMARCA4, RPUSD1, CDK6, RPL7A, RRAGC and SOX4 are up-regulated genes that are involved in “gene expression”, whereas MCL1, LITAF, STK17B, FCER1G, TNFRSF1B, PTPRC, MMP9, ANXA1 and CYFIP2 are down-regulated genes that are involved in “cell death” and “apoptosis” (see Supplementary Tables 5 and 6).
Figure 2. Example of 23 GO terms in which enriched up-regulated genes have an over 2-fold difference of enrichment percentage compared to enriched down-regulated genes.
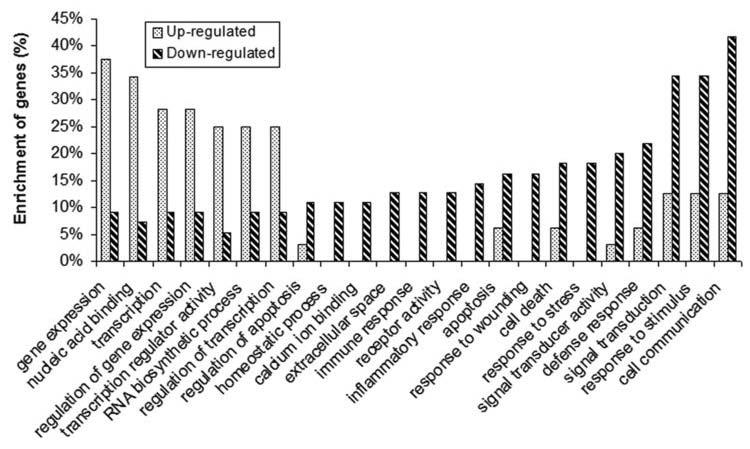
The percentages of the up- and down-regulated genes relative to their total number (i.e., 32 and 55, respectively) in each GO term are shown in the plot for a direct comparison.
Down-regulation of some candidate genes is likely associated with DNA methylation
As shown in Figure 1a, the number of down-regulated genes is much greater than that of up-regulated genes (56 vs. 32). The epigenetic silencing of tumor suppressor genes is a common event during carcinogenesis, and often involves aberrant DNA methylation. To investigate whether DNA methylation is involved in the down-regulation of candidate genes in the MLL-rearrangement leukemias, we performed methylation-specific PCR (MSP) assay (22) to detect the status of CpG islands of three significantly down-regulated genes including LTF, G0S2 and TGFBI. As shown in Figure 3a, the CpG islands of all three tested genes are hypermethylated in three human ALL cell lines bearing MLL-ENL fusion (i.e., KOPN1, KOCL33 and KOCL51). After the treatment of 5-Aza-CdR on these three cell lines, the CpG islands of the three genes were partially demethylated (see Fig. 3b), and the expression of the three genes was dramatically up-regulated/restored with a greater than 10 fold change (Fig. 3c). Indeed, a similar up-regulation of these three genes was also observed in 5 other MLL-rearrangement leukemia cells lines including both ALL (i.e., KOCL45, KOCL69 and SEM) and AML (KOCL48 and MV4-11) cell lines after the demethylating treatment (see Fig. 3c). Therefore, the down-regulation of these three candidate genes in MLL-rearrangement leukemia cells is likely associated with DNA hypermethylation.
Figure 3. DNA methylation analysis of three down-regulated candidate genes (i.e., LTF, TGFBI and G0S2) in MLL-rearrangement leukemias.
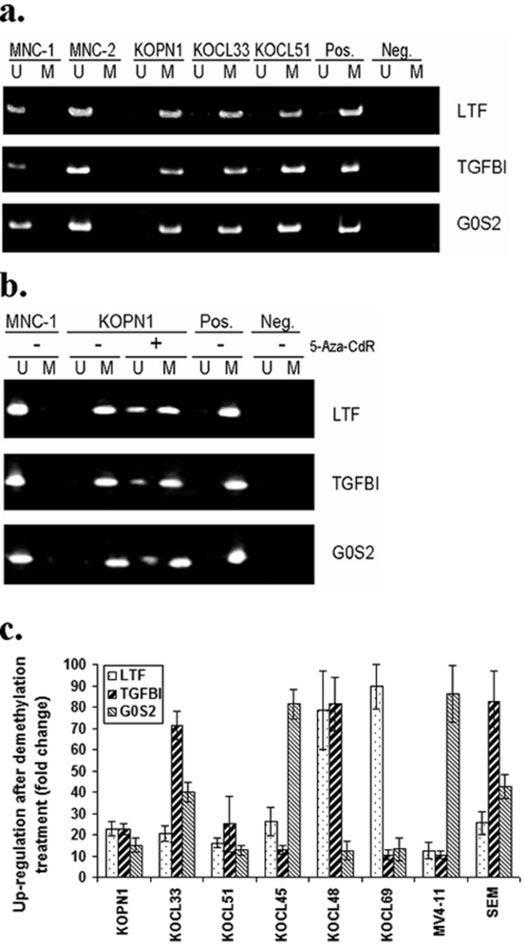
(a) MSP Assay of CpG islands on the promoter regions of LTF, TGFBI and G0S2. Lanes U, unmethylated products; Lanes M, methylated products. MNC-1 and MNC-2 are two normal controls (bone marrow mononuclear cells). Pos., positive control; Neg., negative control. (b) The CpG islands of LTF, TGFBI and G0S2 were partially demethylated after the treatment with 5-Aza-CdR. Only KOPN1 is the only example shown here (c) Effects of 5-Aza-CdR on the expression of LTF, TGFBI and G0S2 as detected by qPCR. KOPN1, KOCL33 and KOCL51 are ALL cell lines bearing MLL-ENL fusions; KOCL45, KOCL69 and SEM are ALL cell lines bearing MLL-AF4 fusions; KOCL48 and MV4-11 are AML cell lines bearing MLL-AF4 fusions.
Putative microRNA regulators of the 88 candidate genes detected by SAGE
One of the most exciting findings in life sciences in recent years is the discovery of an abundant class of small (∼22 nucleotides), non-coding RNAs, namely microRNAs (miRNAs, miRs). Recent studies showed that miRNAs play important regulatory roles in diverse biological processes and may function as oncogenes or tumor suppressors (23-25). Using the four currently available major prediction programs, including TargetScanS (26), Miranda (27), PicTar (28) and MAMI (http://mami.med.harvard.edu/), we found that all the 88 candidate genes have putative miRNA regulation sites in their 3′UTRs (see Supplementary Table 7).
A miRNA cluster is abnormally overexpressed in both human and murine leukemia samples with MLL-ELL or MLL-ENL fusion
We recently performed a large-scale, genome-wide miRNA expression profiling assay and observed that all the seven individual miRNAs from a unique polycistronic miRNA cluster, namely mir-17-92, residing in the C13orf25 gene locus at 13q31, including miR-17-5p, miR-17-3p, miR-18a, miR-19a, miR-20a, miR-19b and miR-92, were significantly up-regulated in MLL-rearrangement leukemias relative to normal controls or other leukemias (20). The mir-17-92 is a well-known oncogene (29). To validate whether this miRNA cluster is also abnormally overexpressed in murine leukemia cells with MLL-ELL or MLL-ENL fusion, we performed a qPCR to evaluate the expression levels of all seven individual miRNAs in 33 human and 7 mouse samples. The 33 human samples include 18 MLL-rearrangement and 9 non-MLL-rearrangement leukemia samples and 6 normal controls. The 7 mouse samples include 2 MLL-ELL and 2 MLL-ENL leukemia samples and 3 Gr-1+ normal control samples. As shown in Figure 4a, as in human samples, all seven individual miRNAs are overexpressed in mouse leukemia cells, although the level is not as high as in corresponding human leukemias.
Figure 4. Expression profiles and targets of the miRNAs in the mir-17-92 cluster.
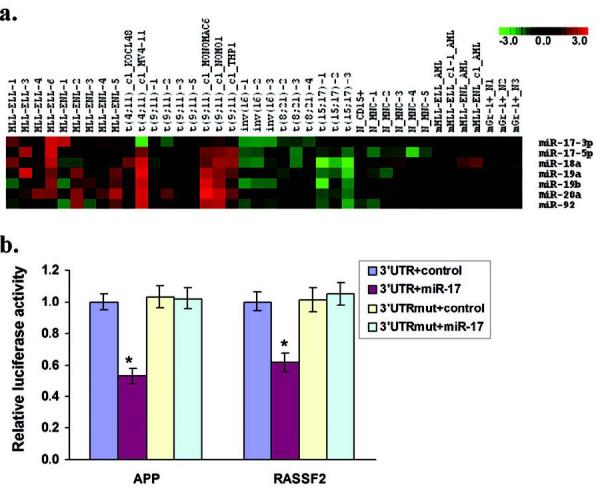
(a) Expression profiles of the seven miRNAs in 40 human and mouse samples as detected by TaqMan qPCR. All the significant genes have a q value < 0.05, with an overall FDR < 0.05. “_cl” label in the sample ID stands for “cell line”, while “_N” means “normal control” sample; “m”: mouse. (b) Regulation of APP and RASSF2 by miR-17 was confirmed by luciferase reporter and mutagenesis assay. HEK293T cells were co-transfected with an expression construct for miR-17 or an empty vector (control; i.e., MSCVpuro); the luciferase reporter construct containing the wild-type or mutated 3′UTR of APP or RASSF2, along with a β-galactosidase reporter control vector to monitor transfection efficiency. Luciferase was measured 42 hr after transfection. The firefly luciferase activity was normalized to β-galactosidase activity. The normalized luciferase activities represent the firefly: β-galactosidase ratios normalized to the control sample. Error bars present standard deviation obtained from 3 independent experiments. *, p < 0.01 (paired t-test).
Candidate targets of the miRNAs in the mir-17-92 cluster
It is believed that the central role of miRNAs is to regulate the expression of their target genes (23-25), and thus it is important to identify their targets. Because miRNAs usually function as negative regulators, it is expected that they will exhibit an inverse correlation with the expression of their targets. Recent findings indicate that animal miRNAs can not only repress protein synthesis, but also induce mRNA degradation of a large portion of targets (30, 31). To identify targets of the miRNAs in the mir-17-92 cluster, we searched for candidate genes that were significantly down-regulated in MLL-rearrangement leukemias as being reported by at least two different studies (including all the previous 35 studies and our SAGE analysis) and/or having been confirmed by our qPCR assay. We obtained a collection of 167 such candidate genes and found that 19 of them were predicted as putative targets of the miRNAs in the mir-17-92 cluster by at least two of the four prediction programs described above (See Supplementary Table 8). Of these, 3 (i.e., APP, RASSF2 and SH3BP5) have already been confirmed by our qPCR assay to be significantly down-regulated in both MLL-ELL and MLL-ENL samples (see Fig. 1b).
We further performed a luciferase reporter and mutagenesis assay to validate APP and RASSF2. A significantly negative effect (p < 0.01; paired t-test) on luciferase activity was observed in the presence of miR-17 on 3′UTR of APP or RASSF2, and such repression was lost when the predicted miRNA binding site in the 3′UTR of APP or RASSF2 (in the reporter plasmid) was mutated (Fig. 4b), indicating that both APP and RASSF2 are direct targets of miR-17.
DISCUSSION
The power of comparative genomic analysis relies on the assumption that important biological properties are often conserved across species (9). Cross-species sequence comparison has been widely used to infer gene function; but it is becoming apparent that sequence similarity is not always proportional to functional similarity (32, 33). To determine the function of a gene precisely, therefore, we need to investigate not only its sequence characteristics but also its expression characteristics (9). The expression pattern of a gene can thus serve as a sensitive indicator of its function. In the present work, we conducted a genome-wide gene expression profiling assay on both human and mouse leukemia cells bearing MLL fusions using a SAGE method. We obtained 484,303 total SAGE tags for the nine samples and a total of 103,899 unique SAGE tags in the human and 60,993 in the mouse samples. We identified 88 genes that appeared to be significantly deregulated (32 up- and 56 down-regulated) in both human and murine MLL-ELL and/or MLL-ENL leukemia (see Fig. 1a).
In a comparison with previous studies of human MLL-rearrangement leukemias that used different methods such as cDNA microarray, oligonucleotide microarray, and qPCR, we found that 31 of the 88 genes identified by SAGE have been reported previously but 57 are previously undescribed candidate genes that appear to be deregulated in MLL-rearrangement leukemias. We further performed a large-scale qPCR assay to validate the deregulation of 81 candidate genes including 43 genes identified from our SAGE analysis and 38 genes reported only by the previous studies in 20 samples including 12 human and 8 mouse samples. 84% (36 out of 43) of the candidate genes detected by SAGE were confirmed, as were 54% (31 out of 57) of the genes identified by previous studies. A lower confirmation/validation rate of the genes identified by previous studies relative to genes identified by our SAGE analysis is not surprising, because most of the previous studies compared MLL-rearrangement leukemias with other acute leukemias not with normal controls, and our qPCR focused on MLL-ELL and MLL-ENL samples that might not be included in a large number of previous studies. The fact that only 31 of the 88 genes detected by SAGE were reported previously and 84% of the tested SAGE candidate genes were confirmed by qPCR indicates that although MLL-rearrangement leukemias have been intensively studied previously, there are still many potentially important genes that have not been identified and thus our study using a different strategy/method could provide additional important information to extend our understanding of the complex genetic alterations in MLL fusion-induced leukemogenesis.
Remarkably, HOXA5, HOXA9, HOXA10 and the HOX cofactor MEIS1 are the four most up-regulated genes observed in both types (i.e., MLL-ELL and MLL-ENL) of human and murine leukemia samples (Fig. 1a), which were further confirmed by our large-scale qPCR assay (Fig. 1b). HOX genes and MEIS1 are the best studied downstream targets of MLL and MLL fusion proteins, and their aberrant overexpression has been consistently recognized as the hallmark of MLL-rearrangement leukemias (34-41). Interestingly, in a Gene Functional Classification analysis using the DAVID tools (19), we found that HOXA5, HOXA9, HOXA10 and MEIS1 were clustered with four other candidate genes including MYB, SOX4, KLF4 and MLL5; the first six were up-regulated whereas the last two were down-regulated in MLL-associated leukemias. Notably, all of these eight genes are regulators of gene expression and/or cell cycle; the first six genes (41-44) are positive regulators whereas KLF4 (45) and MLL5 (46) are negative regulators. Thus, their up- or down-regulation would promote gene expression and cell proliferation, which in turn would contribute to the development of leukemia.
LTF, LCN2, MMP9, S100A8, S100A9, PADI4, TGFBI and CYBB are the eight most down-regulated genes (each has at least 30 fold change in expression) in both types of human and murine leukemia samples (Fig. 1a) and were also confirmed by our qPCR assay (Fig. 1b). Interestingly, five (i.e., LTF, MMP9, S100A8, S100A9 and TGFBI) of these eight genes are enriched in a GO term, namely “extracellular space”, and the other two genes (i.e., TNFAIP2 and LYZ) enriched in this term are also down-regulated in MLL-associated leukemias. In addition, LTF, S100A8, S100A9 and CYBB are involved in both “response to stimulus” and “defense response”, along with TGFBI involved in the former (see Supplementary Tables 5 and 6).
As shown in Figure 2, up-regulated genes have a much higher percentage of enrichment in GO terms related to gene expression and transcription, whereas down-regulated genes are more enriched in GO terms related to apoptosis, signal transduction and response. Thus, the up-regulation of genes responsible for gene expression and transcription but the down-regulation of genes responsible for apoptosis, signal transduction and response, can promote cell proliferation and inhibit apoptosis, and thereby contribute to the development of leukemia.
It is well-known that MLL fusion proteins can promote expression of many target genes such as HOX genes and MEIS1 (3, 4). However, the mechanism underlying the down-regulation of a large number of genes in MLL-rearrangement leukemias is unclear. In the present study, we showed that down-regulation of many genes in the leukemias might be associated with DNA methylation (see Fig. 3). Nonetheless, the genetic or epigenetic changes that caused the DNA methylation remain to be explored. Interestingly, we found that BMI1 was consistently overexpressed in human and murine MLL-associated leukemia cells relative to the normal controls (see Fig. 1b). BMI1 is a member of polycomb group (PcG) proteins, which act as negative regulators of transcription (47). Thus, it is important to conduct systematic studies in the future to determine whether down-regulation of many genes in MLL-associated leukemias is related to the deregulation of BMI1 and/or other transcription repressor(s).
We found that all of the 88 candidate genes have putative miRNA regulators (see Supplementary Table 7). Interestingly, 19 putative targets of mir-17-92 appeared to be down-regulated in MLL-rearrangement leukemias as reported previously or detected by our SAGE assay; the down-regulation of APP, RASSF2 and SH3BP5 and the up-regulation of the mir-17-92 cluster have been confirmed by our qPCR. We have confirmed both APP and RASSF2 as direct targets of miR-17 through luciferase reporter and mutagenesis assay (see Fig. 4b). Interestingly, RASSF2 encodes a protein that contains a Ras association domain and is a novel tumor-suppressor gene, which has been observed to regulate Ras signaling and play a pivotal role in the early stages of colorectal tumorigenesis (48). Therefore, miRNAs may play an important role in the development of MLL-rearrangement leukemia. In addition, recent studies also showed that some miRNAs, e.g., the miR-290 cluster, may control de novo DNA methylation through regulating Rbl2-dependent Dnmt expression (49, 50). Thus, besides the direct regulation of the expression of target genes, some miRNAs may also contribute to the DNA methylation of many genes and thereby regulate expression of these genes indirectly. Therefore, a combined study of miRNA and mRNA expression profiles would provide a more complete understanding of the complexity of molecular networks in diseases such as MLL-rearrangement leukemia.
In all, our study showed that the deregulation patterns of many protein-coding (e.g., HOX genes and MEIS1) and non-coding (e.g., individual miRNAs within the mir-17-92 cluster) genes observed in human leukemia cells are also conserved in mouse leukemia cells, highlighting the importance of these genes in leukemogenesis. The identification and validation of consistent changes of gene expression in human and murine MLL-rearrangement leukemias contribute important information leading to the understanding of the complex functional pathways underlying MLL-associated leukemia, which in turn may lead to more effective therapy for this type of leukemia.
ACKNOWLEDGEMENTS
This work was supported in part by the National Institutes of Health (NIH) CA127277 (J.C.), Cancer Research Foundation Young Investigator Award (J.C.), the G. Harold and Leila Y. Mathers Charitable Foundation (J.C.), Leukemia & Lymphoma Society Translational Research Grant (J.D.R.), the Spastic Paralysis Foundation of the Illinois, Eastern Iowa Branch of Kiwanis International (J.D.R.), NIH (RO1CA104449 and P01CA105049) (M.J.T.), a Scholar Award from the Leukemia & Lymphoma Society (M.J.T.), a Specialized Center of Research (SCOR) from the Leukemia & Lymphoma Society (M.J.T.), the family of Robert A. Chapski (M.J.T.), and NIH HG002600 (S.M.W.). We thank Drs. Y. Sato and K. Sugita for kindly providing KOPN1, KOCL33, KOCL45, KOCL48, KOCL51 and KOCL69 cell lines.
REFERENCES
- 1.Tkachuk DC, Kohler S, Cleary ML. Involvement of a homolog of Drosophila trithorax by 11q23 chromosomal translocations in acute leukemias. Cell. 1992;71:691–700. doi: 10.1016/0092-8674(92)90602-9. [DOI] [PubMed] [Google Scholar]
- 2.Thirman MJ, Gill HJ, Burnett RC, et al. Rearrangement of the MLL gene in acute lymphoblastic and acute myeloid leukemias with 11q23 chromosomal translocations. N Engl J Med. 1993;329:909–14. doi: 10.1056/NEJM199309233291302. [DOI] [PubMed] [Google Scholar]
- 3.Popovic R, Zeleznik-Le NJ. MLL: how complex does it get? J Cell Biochem. 2005;95:234–42. doi: 10.1002/jcb.20430. [DOI] [PubMed] [Google Scholar]
- 4.Ayton PM, Cleary ML. Molecular mechanisms of leukemogenesis mediated by MLL fusion proteins. Oncogene. 2001;20:5695–707. doi: 10.1038/sj.onc.1204639. [DOI] [PubMed] [Google Scholar]
- 5.Thirman MJ, Levitan DA, Kobayashi H, Simon MC, Rowley JD. Cloning of ELL, a gene that fuses to MLL in a t(11;19)(q23;p13.1) in acute myeloid leukemia. Proc Natl Acad Sci U S A. 1994;91:12110–4. doi: 10.1073/pnas.91.25.12110. [DOI] [PMC free article] [PubMed] [Google Scholar]
- 6.Lavau C, Szilvassy SJ, Slany R, Cleary ML. Immortalization and leukemic transformation of a myelomonocytic precursor by retrovirally transduced HRX-ENL. Embo J. 1997;16:4226–37. doi: 10.1093/emboj/16.14.4226. [DOI] [PMC free article] [PubMed] [Google Scholar]
- 7.Lavau C, Luo RT, Du C, Thirman MJ. Retrovirus-mediated gene transfer of MLL-ELL transforms primary myeloid progenitors and causes acute myeloid leukemias in mice. Proc Natl Acad Sci U S A. 2000;97:10984–9. doi: 10.1073/pnas.190167297. [DOI] [PMC free article] [PubMed] [Google Scholar]
- 8.Hu Y, Sun H, Drake J, et al. From mice to humans: identification of commonly deregulated genes in mammary cancer via comparative SAGE studies. Cancer Res. 2004;64:7748–55. doi: 10.1158/0008-5472.CAN-04-1827. [DOI] [PMC free article] [PubMed] [Google Scholar]
- 9.Zhou XJ, Gibson G. Cross-species comparison of genome-wide expression patterns. Genome Biol. 2004;5:232. doi: 10.1186/gb-2004-5-7-232. [DOI] [PMC free article] [PubMed] [Google Scholar]
- 10.Huang H, Winter EE, Wang H, et al. Evolutionary conservation and selection of human disease gene orthologs in the rat and mouse genomes. Genome Biol. 2004;5:R47. doi: 10.1186/gb-2004-5-7-r47. [DOI] [PMC free article] [PubMed] [Google Scholar]
- 11.Corral J, Lavenir I, Impey H, et al. An Mll-AF9 fusion gene made by homologous recombination causes acute leukemia in chimeric mice: a method to create fusion oncogenes. Cell. 1996;85:853–61. doi: 10.1016/s0092-8674(00)81269-6. [DOI] [PubMed] [Google Scholar]
- 12.Lavau C, Du C, Thirman M, Zeleznik-Le N. Chromatin-related properties of CBP fused to MLL generate a myelodysplastic-like syndrome that evolves into myeloid leukemia. Embo J. 2000;19:4655–64. doi: 10.1093/emboj/19.17.4655. [DOI] [PMC free article] [PubMed] [Google Scholar]
- 13.Lee S, Chen J, Zhou G, Wang SM. Generation of high-quantity and quality tag/ditag cDNAs for SAGE analysis. Biotechniques. 2001;31:348–50. doi: 10.2144/01312st07. 52-4. [DOI] [PubMed] [Google Scholar]
- 14.Lee S, Zhou G, Clark T, Chen J, Rowley JD, Wang SM. The pattern of gene expression in human CD15+ myeloid progenitor cells. Proc Natl Acad Sci U S A. 2001;98:3340–5. doi: 10.1073/pnas.051013798. [DOI] [PMC free article] [PubMed] [Google Scholar]
- 15.Chen J, Rowley DA, Clark T, et al. The pattern of gene expression in mouse Gr-1(+) myeloid progenitor cells. Genomics. 2001;77:149–62. doi: 10.1006/geno.2001.6633. [DOI] [PubMed] [Google Scholar]
- 16.Sun M, Hurst LD, Carmichael GG, Chen J. Evidence for variation in abundance of antisense transcripts between multicellular animals but no relationship between antisense transcriptionand organismic complexity. Genome Res. 2006;16:922–33. doi: 10.1101/gr.5210006. [DOI] [PMC free article] [PubMed] [Google Scholar]
- 17.Chen J, Sun M, Hurst LD, Carmichael GG, Rowley JD. Genome-wide analysis of coordinate expression and evolution of human cis-encoded sense-antisense transcripts. Trends Genet. 2005;21:326–9. doi: 10.1016/j.tig.2005.04.006. [DOI] [PubMed] [Google Scholar]
- 18.Man MZ, Wang X, Wang Y. POWER_SAGE: comparing statistical tests for SAGE experiments. Bioinformatics. 2000;16:953–9. doi: 10.1093/bioinformatics/16.11.953. [DOI] [PubMed] [Google Scholar]
- 19.Huang DW, Sherman BT, Tan Q, et al. DAVID Bioinformatics Resources: expanded annotation database and novel algorithms to better extract biology from large gene lists. Nucleic Acids Res. 2007;35:W169–75. doi: 10.1093/nar/gkm415. [DOI] [PMC free article] [PubMed] [Google Scholar]
- 20.Li Z, Lu J, Sun M, et al. Distinct microRNA expression profiles in acute myeloid leukemia with common translocations. Proc Natl Acad Sci U S A. 2008;105:15535–40. doi: 10.1073/pnas.0808266105. [DOI] [PMC free article] [PubMed] [Google Scholar]
- 21.Mi S, Lu J, Sun M, et al. MicroRNA expression signatures accurately discriminate acute lymphoblastic leukemia from acute myeloid leukemia. Proc Natl Acad Sci U S A. 2007;104:19971–76. doi: 10.1073/pnas.0709313104. [DOI] [PMC free article] [PubMed] [Google Scholar]
- 22.Herman JG, Graff JR, Myohanen S, Nelkin BD, Baylin SB. Methylation-specific PCR: a novel PCR assay for methylation status of CpG islands. Proc Natl Acad Sci U S A. 1996;93:9821–6. doi: 10.1073/pnas.93.18.9821. [DOI] [PMC free article] [PubMed] [Google Scholar]
- 23.He L, Hannon GJ. MicroRNAs: small RNAs with a big role in gene regulation. Nat Rev Genet. 2004;5:522–31. doi: 10.1038/nrg1379. [DOI] [PubMed] [Google Scholar]
- 24.Esquela-Kerscher A, Slack FJ. Oncomirs - microRNAs with a role in cancer. Nat Rev Cancer. 2006;6:259–69. doi: 10.1038/nrc1840. [DOI] [PubMed] [Google Scholar]
- 25.Wu W, Sun M, Zou GM, Chen J. MicroRNA and cancer: Current status and prospective. Int J Cancer. 2007;120:953–60. doi: 10.1002/ijc.22454. [DOI] [PubMed] [Google Scholar]
- 26.Lewis BP, Burge CB, Bartel DP. Conserved seed pairing, often flanked by adenosines, indicates that thousands of human genes are microRNA targets. Cell. 2005;120:15–20. doi: 10.1016/j.cell.2004.12.035. [DOI] [PubMed] [Google Scholar]
- 27.Krek A, Grun D, Poy MN, et al. Combinatorial microRNA target predictions. Nat Genet. 2005;37:495–500. doi: 10.1038/ng1536. [DOI] [PubMed] [Google Scholar]
- 28.John B, Enright AJ, Aravin A, Tuschl T, Sander C, Marks DS. Human MicroRNA targets. PLoS Biol. 2004;2:e363. doi: 10.1371/journal.pbio.0020363. [DOI] [PMC free article] [PubMed] [Google Scholar]
- 29.He L, Thomson JM, Hemann MT, et al. A microRNA polycistron as a potential human oncogene. Nature. 2005;435:828–33. doi: 10.1038/nature03552. [DOI] [PMC free article] [PubMed] [Google Scholar]
- 30.Bagga S, Bracht J, Hunter S, et al. Regulation by let-7 and lin-4 miRNAs results in target mRNA degradation. Cell. 2005;122:553–63. doi: 10.1016/j.cell.2005.07.031. [DOI] [PubMed] [Google Scholar]
- 31.Nilsen TW. Mechanisms of microRNA-mediated gene regulation in animal cells. Trends Genet. 2007;23:243–9. doi: 10.1016/j.tig.2007.02.011. [DOI] [PubMed] [Google Scholar]
- 32.Gerlt JA, Babbitt PC. Can sequence determine function? Genome Biol. 2000;1 doi: 10.1186/gb-2000-1-5-reviews0005. REVIEWS0005. [DOI] [PMC free article] [PubMed] [Google Scholar]
- 33.Wilson CA, Kreychman J, Gerstein M. Assessing annotation transfer for genomics: quantifying the relations between protein sequence, structure and function through traditional and probabilistic scores. J Mol Biol. 2000;297:233–49. doi: 10.1006/jmbi.2000.3550. [DOI] [PubMed] [Google Scholar]
- 34.Rozovskaia T, Feinstein E, Mor O, et al. Upregulation of Meis1 and HoxA9 in acute lymphocytic leukemias with the t(4 : 11) abnormality. Oncogene. 2001;20:874–8. doi: 10.1038/sj.onc.1204174. [DOI] [PubMed] [Google Scholar]
- 35.Poppe B, Vandesompele J, Schoch C, et al. Expression analyses identify MLL as a prominent target of 11q23 amplification and support an etiologic role for MLL gain of function in myeloid malignancies. Blood. 2004;103:229–35. doi: 10.1182/blood-2003-06-2163. [DOI] [PubMed] [Google Scholar]
- 36.Ross ME, Mahfouz R, Onciu M, et al. Gene expression profiling of pediatric acute myelogenous leukemia. Blood. 2004;104:3679–87. doi: 10.1182/blood-2004-03-1154. [DOI] [PubMed] [Google Scholar]
- 37.Krivtsov AV, Twomey D, Feng Z, et al. Transformation from committed progenitor to leukaemia stem cell initiated by MLL-AF9. Nature. 2006;442:818–22. doi: 10.1038/nature04980. [DOI] [PubMed] [Google Scholar]
- 38.Kohlmann A, Schoch C, Dugas M, et al. New insights into MLL gene rearranged acute leukemias using gene expression profiling: shared pathways, lineage commitment, and partner genes. Leukemia. 2005;19:953–64. doi: 10.1038/sj.leu.2403746. [DOI] [PubMed] [Google Scholar]
- 39.Ferrando AA, Armstrong SA, Neuberg DS, et al. Gene expression signatures in MLL-rearranged T-lineage and B-precursor acute leukemias: dominance of HOX dysregulation. Blood. 2003;102:262–8. doi: 10.1182/blood-2002-10-3221. [DOI] [PubMed] [Google Scholar]
- 40.Chiaretti S, Li X, Gentleman R, et al. Gene expression profiles of B-lineage adult acute lymphocytic leukemia reveal genetic patterns that identify lineage derivation and distinct mechanisms of transformation. Clin Cancer Res. 2005;11:7209–19. doi: 10.1158/1078-0432.CCR-04-2165. [DOI] [PubMed] [Google Scholar]
- 41.Drabkin HA, Parsy C, Ferguson K, et al. Quantitative HOX expression in chromosomally defined subsets of acute myelogenous leukemia. Leukemia. 2002;16:186–95. doi: 10.1038/sj.leu.2402354. [DOI] [PubMed] [Google Scholar]
- 42.Kawagoe H, Humphries RK, Blair A, Sutherland HJ, Hogge DE. Expression of HOX genes, HOX cofactors, and MLL in phenotypically and functionally defined subpopulations of leukemic and normal human hematopoietic cells. Leukemia. 1999;13:687–98. doi: 10.1038/sj.leu.2401410. [DOI] [PubMed] [Google Scholar]
- 43.Liu P, Ramachandran S, Ali Seyed M, et al. Sex-determining region Y box 4 is a transforming oncogene in human prostate cancer cells. Cancer Res. 2006;66:4011–9. doi: 10.1158/0008-5472.CAN-05-3055. [DOI] [PubMed] [Google Scholar]
- 44.Lang G, White JR, Argent-Katwala MJ, Allinson CG, Weston K. Myb proteins regulate the expression of diverse target genes. Oncogene. 2005;24:1375–84. doi: 10.1038/sj.onc.1208301. [DOI] [PubMed] [Google Scholar]
- 45.Shields JM, Christy RJ, Yang VW. Identification and characterization of a gene encoding a gut-enriched Kruppel-like factor expressed during growth arrest. J Biol Chem. 1996;271:20009–17. doi: 10.1074/jbc.271.33.20009. [DOI] [PMC free article] [PubMed] [Google Scholar]
- 46.Deng LW, Chiu I, Strominger JL. MLL 5 protein forms intranuclear foci, and overexpression inhibits cell cycle progression. Proc Natl Acad Sci U S A. 2004;101:757–62. doi: 10.1073/pnas.2036345100. [DOI] [PMC free article] [PubMed] [Google Scholar]
- 47.Rice KL, Hormaeche I, Licht JD. Epigenetic regulation of normal and malignant hematopoiesis. Oncogene. 2007;26:6697–714. doi: 10.1038/sj.onc.1210755. [DOI] [PubMed] [Google Scholar]
- 48.Akino K, Toyota M, Suzuki H, et al. The Ras effector RASSF2 is a novel tumor-suppressor gene in human colorectal cancer. Gastroenterology. 2005;129:156–69. doi: 10.1053/j.gastro.2005.03.051. [DOI] [PubMed] [Google Scholar]
- 49.Sinkkonen L, Hugenschmidt T, Berninger P, et al. MicroRNAs control de novo DNA methylation through regulation of transcriptional repressors in mouse embryonic stem cells. Nat Struct Mol Biol. 2008;15:259–67. doi: 10.1038/nsmb.1391. [DOI] [PubMed] [Google Scholar]
- 50.Benetti R, Gonzalo S, Jaco I, et al. A mammalian microRNA cluster controls DNA methylation and telomere recombination via Rbl2-dependent regulation of DNA methyltransferases. Nat Struct Mol Biol. 2008;15:268–79. doi: 10.1038/nsmb.1399. [DOI] [PMC free article] [PubMed] [Google Scholar]