

Abstract
A fluorescent sensor of adenylate nucleotides was constructed by combining a circularly permuted variant of green fluorescent protein with a bacterial regulatory protein, GlnK1, from Methanococcus jannaschii. The affinity for Mg-ATP is below 100 nM, as seen for the other members of the bacterial PII regulator family – a surprisingly high affinity given normal intracellular [ATP] in the millimolar range. ADP binds to the same site, competing with Mg-ATP but producing a smaller change in fluorescence. With normal physiological concentrations of ATP and ADP, the binding site is saturated, but competition between the two substrates causes the sensor to behave as a nearly ideal reporter of the ATP/ADP concentration ratio. This principle for sensing the ratio of two analytes by competition at a high affinity site probably underlies the normal functioning of PII regulatory proteins. The engineered sensor, Perceval, can be used to monitor the ATP/ADP ratio during live cell imaging.
INTRODUCTION
ATP is the primary energy currency inside living cells. It also acts as a signaling molecule to coordinate responses to energy status, in part by modulating ion channels1 and activating signaling cascades2. The production and consumption of ATP have been suggested in some cases to be spatially restricted (or ‘compartmentalized’) in cells3, 4. In order to understand fully how such compartmentation of ATP may influence cellular physiology, a visible reporter for the level of cellular ATP is needed. Luciferase, an ATP-consuming enzyme that produces a luminescent product, has been used for this purpose: it is genetically expressed in cells, the substrate luciferin is applied, and the resultant ATP-dependent luminescence can be imaged with a photon-counting CCD camera6, 7, but general use of this approach is limited by very low signal levels. A fluorescent sensor of ATP would in principle allow better temporal and spatial detection of physiological changes.
Genetically encoded fluorescent biosensors have been created from green fluorescent protein (GFP) and its variants using a variety of strategies. Some of these use circularly permuted fluorescent proteins (cpFP’s), in which the original N and C termini are connected via a peptide linker, and new N and C termini are created in close proximity to the chromophore8. The calcium sensor pericam9 and hydrogen peroxide sensor HyPer10 were created by fusing the N and C termini of a cpFP to specific detector proteins for calcium or hydrogen peroxide, respectively. Conformational changes in the fusion proteins caused by the binding of the analyte to the detector protein domain lead to changes in sensor fluorescence.
We sought a suitable ATP-binding protein with which to use this cpFP approach. The bacterial protein GlnK1, a member of the PII family, is a trimeric intracellular protein that regulates ammonia transport associated with the synthesis of glutamine. In its apo (unliganded) form, it binds to a bacterial ammonia transporter and blocks ammonia import. Only when the GlnK1 protein has bound both Mg-ATP and 2-ketoglutarate, indicating a healthy metabolism and glutamine synthesis precursor availability, does it dissociate from the transporter and permit ammonia transport into the bacterium11–13. Binding of Mg-ATP to GlnK1 results in a dramatic conformational change13 in which the ‘T-loop’ (amino acid residues Gly37-Val53) changes from a very loose disordered structure to a compact ordered loop (Fig. 1a). Because of this localized structural change upon ATP binding, we considered the GlnK1 protein as a potential backbone for a fluorescent ATP sensor.
Figure 1. Properties of the GlnK1-cpmVenus (QV5) construct.

(a) Ribbon representation of one subunit of the GlnK1 protein without a ligand (grey/blue), or with Mg2+-ATP (grey/green/yellow, with the ligand in ball-and-stick form). The T-loop (colored) becomes compact and ordered in the presence of Mg2+-ATP. The blue structure is just one of the many alternative and disordered structures seen for the unliganded T-loop. The yellow region indicates the insertion points used for the circularly permuted fluorescent protein. Based on Protein Data Bank files 2j9e and 2j9d (ref. 13). (b) Excitation spectra of purified QV5 construct during control conditions (grey) and following addition of 50 μM Mg-ATP (black), emission at 530 nm. ATP addition leads to an increase in the 490 nm peak and a decrease in the 405 nm peak. (c) Fluorescence intensities when exciting at 490 nm (green) or 405 nm (blue), normalized by the initial value; emission at 530 nm. (d). The ratio of fluorescence intensities when exciting at 490 nm divided by 405 nm reveals a ~3-fold change upon ATP application (affinity = ~0.04 μM), but also a ~1.4-fold increase upon application of ADP (affinity = ~0.2 μM). Error bars indicate ± s.e.m. (n = 3).
We have used the cpFP approach to create an improved biosensor for cellular ATP based upon the ATP-binding bacterial protein GlnK1. We found that integration of a yellow cpFP (cpmVenus) into the T-loop of the GlnK1 protein yielded a fluorescent sensor of ATP. Upon further inspection, we found that this sensor, and likely the native GlnK1 protein, in fact reports the ratio of ATP/ADP levels. An optimized version of this probe expressed in mammalian cells responds to inhibition of cellular metabolism with real-time changes in fluorescence.
RESULTS
A cpFP inserted into GlnK1 reports ATP with high affinity
To engineer an ATP sensor, we inserted the yellow fluorescent, circularly permuted monomeric Venus (cpmVenus) into each of six sequential positions within the T-loop (residues Gly48 to Asp54) of GlnK1. We expressed these fusion proteins in bacteria and assayed the purified proteins for a fluorescent response to ATP application. Most constructs were fluorescent but did not change fluorescence upon application of ATP. However, when we inserted the cpmVenus between Tyr51 and Ile52, we noticed a substantial change in the excitation spectrum upon ATP application (Fig. 1b). The basal excitation spectrum of this ‘QV5’ construct (Q for glutamine/GlnK1; V for Venus; in the 5th position) is similar to that of YFP, with a prominent peak around 490 nm and an additional, smaller peak at 405 nm. As ATP is added, the 405 nm excitation peak is diminished, while the 490 nm peak is enhanced; thus ATP leads to a ratiometric change in the excitation spectrum of the QV5 construct. This property, also seen for ratiometric pericam9 and for HyPer10, is ideal for a cellular sensor as it permits normalization of the signal irrespective of variation in the concentration of the sensor protein. As seen for the other cpFP-based probes, the shape of the emission spectrum did not change with ligand binding. Relative to cellular levels of ATP, reported to be in the millimolar range14, the affinity of the QV5 construct has a surprisingly high affinity of approximately 0.04 μM for ATP (Fig. 1c).
In addition to binding ATP, the GlnK1 protein can also bind ADP, although ADP binding fails to produce secure T-loop closure13. ADP application does change the excitation spectrum of the QV5 fusion protein, although at saturating [ADP] there is only a ~1.4-fold change in the 495 to 405 ratio, compared with a ~3-fold increase with saturating [ATP] (Fig. 1d). The ADP affinity for the fluorescent response is ~0.2 μM; thus, the QV5 protein has ~5-fold higher affinity for ATP than ADP.
Competition allows the sensor to report the ATP/ADP ratio
The extremely high affinity for ATP as well as the imperfect selectivity over ADP would seem to disqualify this version of the sensor for cellular ATP sensing, but in fact the combination of these properties leads to interesting behavior when both nucleotides are present. ATP and ADP compete for binding to the site, but only ATP causes closure of the T-loop and a maximal change in fluorescence. Competition by ADP will effectively lower the affinity of the sensor for ATP. This competitive mechanism would predict that the steady-state fluorescent response of the QV5 fusion protein will depend on the ATP/ADP ratio (see Supplementary Results online), and it will be insensitive to the absolute concentrations of the two nucleotides so long as they exceed the submicromolar affinity constants. The sensitivity should be determined by the relative affinity of the receptor for ATP and ADP. The QV5 construct has ~5-fold higher affinity for ATP than for ADP, so that the sensor should be half-active when the ratio (R) of ATP to ADP is ~0.2. We call this ratio at which the sensor response is half maximal the ‘KR‘ of the sensor, in analogy to the Kd or K1/2 of a receptor.
We tested this predicted dependence on the ATP/ADP ratio by measuring the fluorescent response to ATP application in the constant presence of different concentrations of ADP. As predicted, the response depended not on the absolute concentration of ATP alone, but rather on the ratio of [ATP] to [ADP] (Fig. 2). When ATP was added in the presence of 5 μM ADP, the half-maximal fluorescent response occurred when [ATP] was ~1 μM (compared to ~0.04 μM when ADP is absent). This half-maximal response corresponds to an ATP/ADP ratio of ~0.2, which agrees with our expected KR based upon the ratio of ATP and ADP affinities. To test the robustness of the response, we repeated the assay with increasing concentrations of ADP (Fig. 2). In each case, the fluorescent response accurately reported the ATP/ADP ratio.
Figure 2. The QV5 construct reports the ATP/ADP ratio.

Application of ATP in the constant presence of three different concentrations of ADP demonstrates the increasing effective affinities of the sensor for ATP with increasing concentrations of ADP. The QV5 construct fluorescence response to ATP application in the presence of 5 μM, 50 μM, and 500 μM shows a half-maximal response at 1 μM, 10 μM, and 100 μM ATP respectively, corresponding to a half-maximal response when the ratio R equals ~0.2.
As for other fluorescent protein based sensors, the absolute fluorescence of the QV5 construct is sensitive to pH, but the dose-response for ATP is remarkably insensitive to pH values in the cellular range (Supplementary Fig. 1). In addition, at an excitation wavelength of 435 nm the fluorescence response is isosbestic for nucleotide levels, regardless of the pH.
The distinctive fluorescent response to ATP and ADP required Mg2+ (Supplementary Results and Supplementary Fig. 2) and showed minimal interference from other ligands. Other purine nucleotides, such as AMP, NAD+, or GTP, had little or no effect on the sensor when ADP and ATP were present (Supplementary Fig. 3). We also found that application of 2-ketoglutarate (2-KG), a co-activator of the GlnK1 protein, had little effect on the basal fluorescence of the sensor. However, 2-KG application did reduce the ATP-dependent fluorescence response in a dose-dependent manner, with a Kapparent of ~0.3 mM (Fig. 3c).
Figure 3. Perceval is an improved version of the QV5 construct.

(a) Kinetics of fluorescence response to a half-maximal application of an ATP/ADP (from ADP alone) normalized to initial and final values. Perceval [0.4 mM ATP application in the presence of 0.1 mM ADP] responds with kinetics (τ ≈ 10 s) approximately 5-fold faster than the QV5 construct [0.2 mM ATP application in the presence of 0.1 mM ADP] (τ ≈ 50 s). (b) Perceval responds with a KR of ~0.5 while the QV5 construct has a KR of ~0.2. (c) Fluorescence response (495 nm/405 nm) to a saturating ATP concentration normalized to the level in the absence of 2-ketoglutarate (2KG). Perceval (half-maximal inhibition at 3 mM) is substantially less sensitive to 2KG than the QV5 construct (0.3 mM). Error bars (± s.e.m., n = 3) for Perceval data are smaller than the symbols.
Optimization of the ATP/ADP sensor
Although the QV5 fusion protein provides a fluorescent readout of ATP/ADP ratio, it required improvement in several of its properties before use as a cellular sensor. Due to the very high affinity for both ATP and ADP, the kinetics of the response to a change in ratio were quite slow, with a time constant of around a minute (Fig. 3a). Also, the KR for the initial sensor, ~0.2, was likely still too low to measure interesting changes in the ATP/ADP ratio of cells, as the normal ratio in a ‘fully-charged’ cell14 is in the range of 3 to 10. Lastly, the modulation by sub-millimolar concentrations of the intermediate metabolite 2-KG might compromise the use of the sensor in cells.
To optimize the sensor for use in cells, we designed a semi-random mutagenesis screen on the GlnK1 portion of the sensor, targeting residues involved in the ATP binding and T-loop conformational rearrangement (Supplementary Methods). Using a high-throughput assay of the fluorescent response to ATP and ADP, we screened approximately 300 variants of the sensor. The best product of this screen was a sensor with improved ATP/ADP binding characteristics. This sensor contained the mutations A6S and R36T; the latter mutation affects a residue at the base of the T-loop and likely alters the T-loop conformational change. As a final step towards cellular expression, we took the product of the screen and created a tandem trimer consisting of the modified QV5 construct linked to two modified GlnK1 protomers. The second and third protomers of this trimer have no fluorescent protein insertion, and also have the T-loop deleted (Supplementary Fig. 4); this makes the trimer much more compact and also eliminates the opportunity for negative cooperativity reported in some native PII proteins. The tandem trimer showed excellent functional expression in mammalian cells. We dubbed this sensor Perceval, a permuted reporter of cellular energy value. Perceval retained much of the spectral properties, pH, and magnesium sensitivity of the original construct (Supplementary Figs. 5, 6), but with an improved KR of ~0.5, faster kinetics, and lower 2-KG sensitivity (Fig. 3).
Perceval reports changes in cellular energy
To test the ability of Perceval to report changes in cellular metabolism, we expressed it in cultured HEK293 cells. The fluorescence was nearly uniform throughout the cell, and the spectral properties were very similar to those observed in the cuvette: excitation at 490 nm gave a very strong signal, while 430 nm excitation produced considerably lower intensities.
We used the glycolytic inhibitor 2-deoxyglucose (2-DG) to induce a decrease in the intracellular ATP/ADP ratio of the HEK293 cells. 2-DG is phosphorylated by hexokinase, but it is not further metabolized and acts as a competitive inhibitor of the glycolytic enzyme phosphoglucoisomerase, thus reducing cellular ATP production. Within minutes of application of 5 mM 2-DG, we observed a sharp decrease in the fluorescence signal with 490 nm excitation. As expected from the cuvette experiments, 2-DG induced little change in the signal when exciting at 430 nm, the isosbestic point for the ATP/ADP ratio response. The pixel by pixel ratio of the image taken at 490 nm divided by the 430 nm image was fairly consistent throughout the cell and it decreased by ~20% upon 2-DG application (Fig. 4). During this experiment, there was no change in intracellular pH, as assessed by concurrent measurements using the red pH indicator dye SNARF-5F.
Figure 4. Metabolic inhibition leads to a change in the Perceval signal.

(a) A pixel-by-pixel ratio of the 490 nm excitation image by the 430 nm excitation image from two cultured HEK293 cells expressing Perceval during control conditions (left) and following 40 minutes of metabolic inhibition with 5 mM 2-deoxyglucose (2-DG). 2-DG application leads to a pronounced decrease in the ratio across the cell (Pseudocolored with scale of a minimum ratio of 5 (blue) and maximum of 9 (red)). (b) Plot of the 490 nm/430 nm ratio against time for the bottom cell (denoted with white arrow in a) shows a ~20% decrease in the ratio (green) following 2DG application. Concurrent measurement of intracellular pH of the same cell with the red pH indicator dye SNARF-5F shows no change in pH with metabolic inhibition.
Some cells did show variations in pH in response to metabolic inhibition. Because Perceval, like most other FP-derived sensors, is sensitive to changes in pH, we devised a strategy to isolate any fluorescence changes due to changes in the ATP/ADP ratio from any pH-induced changes in fluorescence. By concurrently measuring intracellular pH with the pH indicator dye SNARF-5F, we could correct for any changes in the Perceval fluorescence due to pH. The pH measurements were calibrated at the end of each experiment using various buffered solutions containing high [K+] and nigericin to equilibrate pH across the plasma membrane (Supplementary Fig. 7). The calibrated pH measurement at each time point could be used to correct the Perceval signal according to its pH dependence in the cuvette experiments. Figure 5 shows the Perceval signal from a full 2-DG experiment plotted either as a function of time (Fig. 5a), or as a function of the pH at each time point (Fig. 5c). As the experiment progresses, the pH changes and the plotted points move away from the ATP-saturated curve toward the ADP-saturated curve, indicating a decline in ATP/ADP. In contrast, during a control experiment in which a cell was exposed to a low pH bathing solution (but was not metabolically challenged), the intracellular pH and the raw Perceval signal changed substantially (Fig. 5b), but the Perceval signal remained superimposed on the ATP-saturated curve (Fig. 5c). The pH-corrected and normalized Perceval signal (Fig. 5d, e) indicated a clear change in the ATP/ADP ratio upon metabolic inhibition, but little change during a pure pH challenge. The pH correction appeared to be quite robust during a number of experiments with different pH challenges (Supplementary Fig. 8).
Figure 5. Concurrent Perceval and pH monitoring, with pH correction of the Perceval signal.

(a) Results from a cell with a 2-deoxyglucose challenge: dark green, Perceval fluorescence ratio (of excitation 490 nm over excitation 430 nm) and red, the pH signal from SNARF-5F, calibrated after the experiment (see Supplementary Methods). (b) Results from a cell with no metabolic challenge, where the pH of the bathing solution was changed to 6.9 and then to 6.6. (c) Plot of the normalized Perceval ratio versus pH (from a and b; see Supplementary Methods). The two standard curves are from cuvette assays of the ATP-loaded and ADP-loaded sensor at various pH. The initial signal was scaled to the cuvette data by assuming a starting ATP/ADP ratio of ~4. For each experiment (a in dark green and b in bright green), the arrow indicates the progression of time. Notice that the pure pH manipulation (from b) tracks along the pH dependence of the ATP-loaded sensor. (d, e) pH-corrected Perceval signals from the experiments shown in a and b. The correction is done for each data point by plotting the fractional occupancy at the actual pH, as indicated by the grey ruler in c.
We next tested the reversibility of the metabolic effect on the Perceval signal by transiently removing glucose from the extracellular solution. This metabolic manipulation led to a slight intracellular alkalinization and to a gradual decrease in the pH-corrected ATP/ADP signal (Fig. 6). Upon glucose readministration, the ATP/ADP signal quickly recovered to control levels.
Figure 6. Transient glucose removal leads to a reversible change in the ATP/ADP signal.
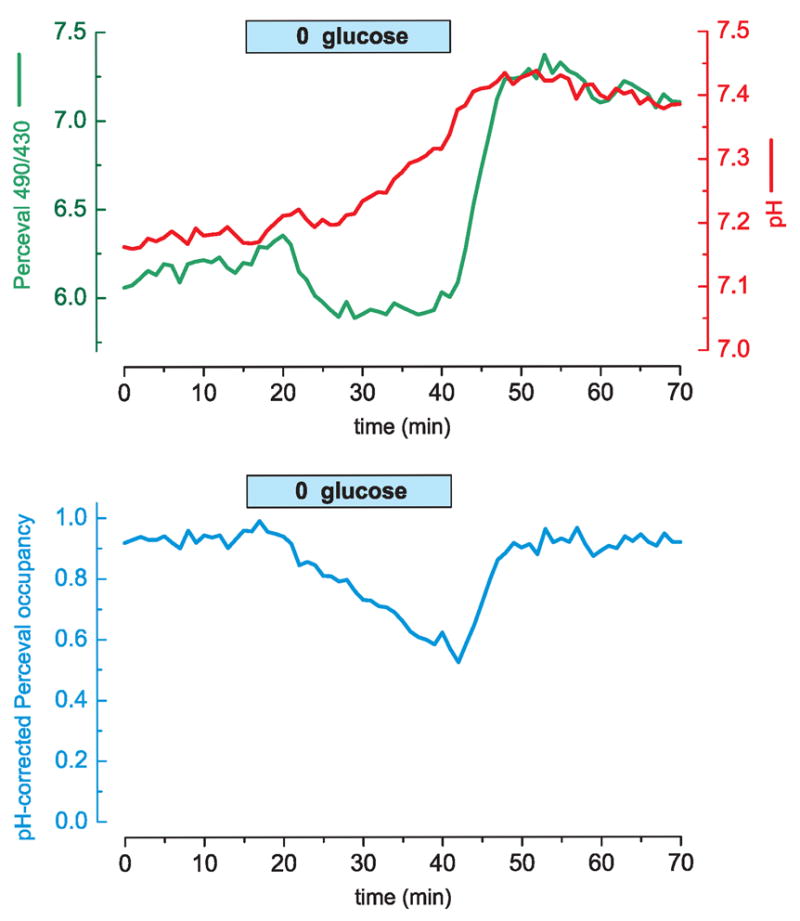
(a) A cultured HEK293 cell expressing Perceval and loaded with the pH sensitive dye SNARF-5F displays an alkalinization when glucose is removed from the extracellular solution (10 mM glucose was replaced by equimolar sucrose). The Perceval signal shows a slight decrease upon glucose wash-out and a prominent rebound upon glucose wash-in. (b) The pH-corrected Perceval signal reveals a gradual decrease in cellular energy that is reversed rapidly upon glucose reapplication. Perceval occupancy of 0 corresponds to ADP ≫ ATP; occupancy of 1 corresponds to ATP ≫ ADP.
DISCUSSION
Though Perceval was originally conceived as a sensor for ATP concentration alone, we found that in the presence of mixed nucleotides, its fluorescence response was directly related not to the absolute level of ATP, but to the ratio of ATP to ADP levels. This is consistent with two recent studies15, 16 that reported strong interactions between ADP and ATP on PII proteins (the class of proteins that includes GlnK1). These groups hypothesized that the competition between ATP and ADP leads these proteins to sense the ‘energy charge’ of the bacteria. The concept of adenylate energy charge, originally proposed by Atkinson17, is based on the hypothesis that, although the absolute individual levels of ATP, ADP, and AMP might vary widely, the ratios of [ATP]/[ADP] and [ATP]/[AMP] are more reliable indicators of metabolism from cell to cell. Detection of the cellular ATP/ADP ratio is particularly valuable because this ratio determines (along with free [Pi]) the actual free energy of ATP hydrolysis available for cellular reactions. Through the adenylate kinase (AdK) reaction, the ATP/ADP ratio (R) is also closely related to the free concentration of AMP, which is a critical regulator of downstream signaling mechanisms. The kinase AMPK is thought to detect the [AMP]/[ATP] ratio18, which is approximately equal to KAdK/R2.
Measurements made using tissue homogenates have demonstrated the potential for large changes in cellular ATP/ADP ratio. In mouse pancreatic beta cells, the tissue ATP/ADP ratio rises from ~2–3 to ~8–9 upon glucose stimulation19. Control tissue rat brain ATP/ADP has been reported14, 20 to range between 3 and 8, and brain ATP/ADP ratio has been demonstrated to fall from ~8 to ~0.4 following two minutes of ischemia21. Most estimates of ATP/ADP ratio are based on measurements of total nucleotide content, but the ratio of free ATP/ADP (which is detected by Perceval) is suspected to be even higher22–24 (estimates range from 2- to 20-fold), due to sequestration by cellular proteins that is greater for ADP than for ATP. The effect of such ADP-binding may be substantial for cells in a high energy state, but energy depletion (below a total ATP/ADP of ~7 to 30) should rapidly saturate the ADP-binding sites (whose cellular concentration is estimated to be ~0.14 mM23) and produce much lower free ATP/ADP ratios, closer to the estimates for total ATP/ADP.
Although the KR of Perceval, ~0.5, is lower than most of these global measurements, the ATP/ADP ratio of single cells within tissues, and even within a single cell, is likely to vary widely due to localized energy production and consumption. The prompt depletion of energy levels seen here in HEK293 cells (with similar results in COS-7 cells; Supplementary Fig. 9) indicates that Perceval can sense energy deficits, as expected in ischemia, anoxia, or high energy consumption states. The present version of Perceval is better tuned for detection of energy deficits, but further mutagenesis and selection should produce Perceval variants capable of sensing a wider range of ATP/ADP.
In comparison with the existing method for measuring cellular ATP by expression of the firefly luciferase enzyme, Perceval offers many advantages. First, the light-emitting luciferase reaction depends not just on ATP, but also on the exogenous delivery of luciferin and the presence of molecular O2. Second, the fluorescent signal from Perceval is much stronger, so measurements can be made with brief, sub-second exposures using a traditional epifluorescence microscope and a standard CCD camera, rather than the several minute exposure using photon-counting CCDs required for luciferase detection. It should be possible to use Perceval to detect subcellular ATP localization, either by using subcellular targeting strategies as used for luciferase7, or by optical localization using confocal, two-photon, or total internal reflection fluorescence (TIRF) microscopy. Lastly, Perceval reports the energy level of the cell by competitive binding of ATP and ADP, whereas luciferase employs an ATP hydrolysis reaction that may perturb the cellular energy balance.
Approaches using nucleic acid aptamers25,26 have recently produced sensors that distinguish ATP and ADP. This approach is promising, though the current versions have very slow kinetics and require chemical synthesis to conjugate a fluorescent dye. Also, an alternative FRET-based approach to constructing a fluorescent sensor for ATP was recently described27. Millimolar ATP altered the FRET ratio of a tandem CFP-YFP construct, but surprisingly, no specific ATP-binding domain was necessary for this effect. As the authors pointed out, this sounds a cautionary note for ATP interference with all FRET-based sensors. The physical basis of the effect is unclear, but it might be exploited for producing a non-ratiometric measurement of ATP concentration.
One limitation of Perceval, along with all cpFP-based probes, is that its signal is sensitive to the intracellular pH. Unfortunately, many metabolic perturbations also modify intracellular pH, so this sensitivity cannot easily be ignored. Glycolytic inhibition via 2-DG has been shown to acidify the cell by ~0.2 pH units in cultured A-431 cells28 and isolated epithelial cells29. We have also measured acidification or alkalinization depending upon the degree of metabolic inhibition of HEK 293 cells. In order to correct for pH effects on the Perceval signal, we have measured changes in intracellular pH using the pH indicator dye SNARF-5F. Because the SNARF-5F fluoresces in the red area of the spectrum, this dye can potentially also be used to correct for any pH influence on the cpFP-based probes pericam or HyPer. Conjugation of these fluorescent sensors to a pH-sensitive red protein, so that both probes are genetically encoded and targetable, may be an even better approach to pH correction.
The fluorescent probe for ATP/ADP ratio presented here represents a novel tool for measuring cellular energetics. It should open the door to a more complete understanding of cellular and subcellular variation in metabolism that may occur during normal cellular growth and signaling, during electrical signaling in excitable cells, and in many pathological situations such as cancer cell growth, ischemia, and epileptic seizures.
METHODS
GlnK1 synthetic gene construction
A synthetic gene encoding the wild-type GlnK1 of M. jannaschii was designed with mammalian codon bias and with selected restriction sites to facilitate construction of the chimeric sensors. A KpnI site at codons 45–47 and a BglII site at codons 53–55, flanking the T-loop, were designed for insertion of the circularly permuted fluorescent protein. An N-terminal (his)7 tag was added to facilitate purification.
Circularly permuted fluorescent protein
A circularly permuted and monomeric version of the GFP derivative Venus30 was prepared. The DNA coding for Venus was generously provided by A. Miyawaki (Riken). Standard PCR methods were used for mutagenesis and chimera construction. The final construct had its N terminus at Venus Tyr145 (numbering corresponds to standard GFP numbering); mutations H148D, Y203F, and A206K; and a protein linker GGSGG between the original C terminus and N terminus.
Chimera construction
The circularly permuted monomeric Venus was inserted at the desired positions in the T-loop using flanking PCR primers. The 5′ end of each primer consisted of 4 bases followed by the flanking restriction site (KpnI or BglII) and then the desired sequence for the fusion protein; the 3′ end primed on the N- or C-terminal end of the circularly permuted monomeric Venus coding sequence. Following PCR with such a primer pair using the circularly permuted monomeric Venus coding sequence as template, the full length product was gel-purified, cut with KpnI and BglII, gel-purified again, and ligated into the KpnI and BglII sites of the GlnK1 synthetic gene.
Tandem trimer construction
The tandem trimer was constructed (using standard PCR methods) by linking a complete sensor monomer to two GlnK1 monomers whose T-loops were deleted (see Supplementary Fig. 4). The first linker inserted 13 residues (ASGGGSGGGGASG) between Gly108 of the A-protomer and Met1 of the B-protomer. The second linker inserted 13 residues (ASGGGGGSGGASG) between Gly108 of the B-protomer and Met1 of the C-promoter. The T-loop deletion in the B and C-protomers eliminated GlnK1 residues 37–53 and replaced them with the five amino acid linker GAGGG. The complete DNA and protein sequence of Perceval is given in Supplementary Fig. 10.
Additional Methods
The methods for random library construction, protein expression and purification, fluorometry, cellular imaging, and pH control and calibration are available in Supplementary Methods online.
Supplementary Material
Supplementary Figure 1. pH and chloride sensitivity of the QV5 construct
Supplementary Figure 2. Magnesium sensitivity of the QV5 construct
Supplementary Figure 3. Sensitivity of the QV5 construct to other purine nucleotides
Supplementary Figure 4. Construction of a tandem trimer version of the sensor
Supplementary Figure 5. Spectral properties of Perceval
Supplementary Figure 6. Response properties of Perceval
Supplementary Figure 7. pH calibration using nigericin
Supplementary Figure 8. pH correction of 2-DG and pH-control experiments
Supplementary Figure 9. Comparable response of sensor in HEK293 and COS7 cells
Supplementary Figure 10. Perceval DNA and protein sequences
Supplementary Results
Detailed explanation of the ratio-sensing behavior of the sensor; pH and chloride sensitivity of the ATP sensor; correcting for changes in intracellular pH; and sensitivity of the GlnK1 – cpmVenus construct to Mg2+ ions.
Acknowledgments
We thank T. Abramson for expert technical assistance with the molecular biology. We are grateful to A. Miyawaki (Riken BSI, Saitama, Japan) for sending the original Venus plasmid, to O. Yildiz and W. Kühlbrandt (Max Planck Institute of Biophysics, Frankfurt am Main, Germany) for sending the original GlnK1 plasmid, and to M. Merrick (John Innes Centre, Norwich, UK) for sending bacterial strains. Thanks also to members of the Yellen lab for their comments and discussion. This work was supported by research grants from the NIH/NINDS (NS029693 and NS055031) to G.Y.
Footnotes
AOP
A ratiometric fluorescent sensor that reports the ATP/ADP concentration ratio in living cells was created by fusing the bacterial regulatory protein GlnK1 to a circularly permuted fluorescent protein. The sensor detected inhibition of cellular metabolism caused by transient removal of glucose from the cellular medium or administration of a glycolytic inhibitor.
ISSUE
A ratiometric fluorescent sensor that reports the ATP/ADP concentration ratio in living cells was created by fusing the bacterial regulatory protein GlnK1 to a circularly permuted fluorescent protein. The sensor detected inhibition of cellular metabolism caused by transient removal of glucose from the cellular medium or administration of a glycolytic inhibitor.
References
- 1.Ashcroft FM, Gribble FM. ATP-sensitive K+ channels and insulin secretion: their role in health and disease. Diabetologia. 1999;42:903–919. doi: 10.1007/s001250051247. [DOI] [PubMed] [Google Scholar]
- 2.Dennis PB, Jaeschke A, Saitoh M, Fowler B, Kozma SC, Thomas G. Mammalian TOR: a homeostatic ATP sensor. Science. 2001;294:1102–1105. doi: 10.1126/science.1063518. [DOI] [PubMed] [Google Scholar]
- 3.Weiss JN, Lamp ST. Cardiac ATP-sensitive K+ channels. Evidence for preferential regulation by glycolysis. J Gen Physiol. 1989;94:911–935. doi: 10.1085/jgp.94.5.911. [DOI] [PMC free article] [PubMed] [Google Scholar]
- 4.Hoffman JF. ATP compartmentation in human erythrocytes. Curr Opin Hematol. 1997;4:112–115. doi: 10.1097/00062752-199704020-00006. [DOI] [PubMed] [Google Scholar]
- 5.Wilson T, Hastings JW. Bioluminescence. Annu Rev Cell Dev Biol. 1998;14:197–230. doi: 10.1146/annurev.cellbio.14.1.197. [DOI] [PubMed] [Google Scholar]
- 6.Kennedy HJ, Pouli AE, Ainscow EK, Jouaville LS, Rizzuto R, Rutter GA. Glucose generates sub-plasma membrane ATP microdomains in single islet beta-cells. Potential role for strategically located mitochondria. J Biol Chem. 1999;274:13281–13291. doi: 10.1074/jbc.274.19.13281. [DOI] [PubMed] [Google Scholar]
- 7.Bell CJ, Manfredi G, Griffiths EJ, Rutter GA. Luciferase expression for ATP imaging: application to cardiac myocytes. Methods Cell Biol. 2007;80:341–352. doi: 10.1016/S0091-679X(06)80017-8. [DOI] [PubMed] [Google Scholar]
- 8.Baird GS, Zacharias DA, Tsien RY. Circular permutation and receptor insertion within green fluorescent proteins. Proc Natl Acad Sci U S A. 1999;96:11241–11246. doi: 10.1073/pnas.96.20.11241. [DOI] [PMC free article] [PubMed] [Google Scholar]
- 9.Nagai T, Sawano A, Park ES, Miyawaki A. Circularly permuted green fluorescent proteins engineered to sense Ca2+ Proc Natl Acad Sci U S A. 2001;98:3197–3202. doi: 10.1073/pnas.051636098. [DOI] [PMC free article] [PubMed] [Google Scholar]
- 10.Belousov VV, Fradkov AF, Lukyanov KA, Staroverov DB, Shakhbazov KS, Terskikh AV, Lukyanov S. Genetically encoded fluorescent indicator for intracellular hydrogen peroxide. Nat Methods. 2006;3:281–286. doi: 10.1038/nmeth866. [DOI] [PubMed] [Google Scholar]
- 11.Ninfa AJ, Jiang P. PII signal transduction proteins: sensors of alpha-ketoglutarate that regulate nitrogen metabolism. Curr Opin Microbiol. 2005;8:168–173. doi: 10.1016/j.mib.2005.02.011. [DOI] [PubMed] [Google Scholar]
- 12.Durand A, Merrick M. In vitro analysis of the Escherichia coli AmtB-GlnK complex reveals a stoichiometric interaction and sensitivity to ATP and 2-oxoglutarate. J Biol Chem. 2006;281:29558–29567. doi: 10.1074/jbc.M602477200. [DOI] [PubMed] [Google Scholar]
- 13.Yildiz O, Kalthoff C, Raunser S, Kühlbrandt W. Structure of GlnK1 with bound effectors indicates regulatory mechanism for ammonia uptake. EMBO J. 2007;26:589–599. doi: 10.1038/sj.emboj.7601492. [DOI] [PMC free article] [PubMed] [Google Scholar]
- 14.Ereciñska M, Silver IA. Ions and energy in mammalian brain. Prog Neurobiol. 1994;43:37–71. doi: 10.1016/0301-0082(94)90015-9. [DOI] [PubMed] [Google Scholar]
- 15.Wolfe DM, Zhang Y, Roberts GP. Specificity and regulation of interaction between the PII and AmtB1 proteins in Rhodospirillum rubrum. J Bacteriol. 2007;189:6861–6869. doi: 10.1128/JB.00759-07. [DOI] [PMC free article] [PubMed] [Google Scholar]
- 16.Jiang P, Ninfa AJ. Escherichia coli PII signal transduction protein controlling nitrogen assimilation acts as a sensor of adenylate energy charge in vitro. Biochemistry. 2007;46:12979–12996. doi: 10.1021/bi701062t. [DOI] [PubMed] [Google Scholar]
- 17.Atkinson DE. The energy charge of the adenylate pool as a regulatory parameter. Interaction with feedback modifiers. Biochemistry. 1968;7:4030–4034. doi: 10.1021/bi00851a033. [DOI] [PubMed] [Google Scholar]
- 18.Hardie DG, Salt IP, Hawley SA, Davies SP. AMP-activated protein kinase: an ultrasensitive system for monitoring cellular energy charge. Biochem J. 1999;338( Pt 3):717–722. [PMC free article] [PubMed] [Google Scholar]
- 19.Nilsson T, Schultz V, Berggren PO, Corkey BE, Tornheim K. Temporal patterns of changes in ATP/ADP ratio, glucose 6-phosphate and cytoplasmic free Ca2+ in glucose-stimulated pancreatic beta-cells. Biochem J. 1996;314( Pt 1):91–94. doi: 10.1042/bj3140091. [DOI] [PMC free article] [PubMed] [Google Scholar]
- 20.DeVivo DC, Leckie MP, Ferrendelli JS, McDougal DB. Chronic ketosis and cerebral metabolism. Ann Neurol. 1978;3:331–337. doi: 10.1002/ana.410030410. [DOI] [PubMed] [Google Scholar]
- 21.Folbergrová J, Minamisawa H, Ekholm A, Siesjö BK. Phosphorylase alpha and labile metabolites during anoxia: correlation to membrane fluxes of K+ and Ca2+ J Neurochem. 1990;55:1690–1696. doi: 10.1111/j.1471-4159.1990.tb04957.x. [DOI] [PubMed] [Google Scholar]
- 22.Veech RL, Lawson JW, Cornell NW, Krebs HA. Cytosolic phosphorylation potential. J Biol Chem. 1979;254:6538–6547. [PubMed] [Google Scholar]
- 23.Mörikofer-Zwez S, Walter P. Binding of ADP to rat liver cytosolic proteins and its influence on the ratio of free ATP/free ADP. Biochem J. 1989;259:117–124. doi: 10.1042/bj2590117. [DOI] [PMC free article] [PubMed] [Google Scholar]
- 24.Koretsky AP, Brosnan MJ, Chen LH, Chen JD, Dyke TV. NMR detection of creatine kinase expressed in liver of transgenic mice: determination of free ADP levels. Proc Natl Acad Sci U S A. 1990;87:3112–3116. doi: 10.1073/pnas.87.8.3112. [DOI] [PMC free article] [PubMed] [Google Scholar]
- 25.Chiuman W, Li Y. Simple fluorescent sensors engineered with catalytic DNA ‘MgZ’ based on a non-classic allosteric design. PLoS ONE. 2007;2:e1224. doi: 10.1371/journal.pone.0001224. [DOI] [PMC free article] [PubMed] [Google Scholar]
- 26.Huizenga DE, Szostak JW. A DNA aptamer that binds adenosine and ATP. Biochemistry. 1995;34:656–665. doi: 10.1021/bi00002a033. [DOI] [PubMed] [Google Scholar]
- 27.Willemse M, Janssen E, de Lange F, Wieringa B, Fransen J. ATP and FRET–a cautionary note. Nat Biotechnol. 2007;25:170–172. doi: 10.1038/nbt0207-170. [DOI] [PubMed] [Google Scholar]
- 28.Kiang JG, McKinney LC, Gallin EK. Heat induces intracellular acidification in human A-431 cells: role of Na(+)-H+ exchange and metabolism. Am J Physiol. 1990;259:C727–C737. doi: 10.1152/ajpcell.1990.259.5.C727. [DOI] [PubMed] [Google Scholar]
- 29.Brown SE, Heming TA, Benedict CR, Bidani A. ATP-sensitive Na(+)-H+ antiport in type II alveolar epithelial cells. Am J Physiol. 1991;261:C954–C963. doi: 10.1152/ajpcell.1991.261.6.C954. [DOI] [PubMed] [Google Scholar]
- 30.Nagai T, Ibata K, Park ES, Kubota M, Mikoshiba K, Miyawaki A. A variant of yellow fluorescent protein with fast and efficient maturation for cell-biological applications. Nat Biotechnol. 2002;20:87–90. doi: 10.1038/nbt0102-87. [DOI] [PubMed] [Google Scholar]
Associated Data
This section collects any data citations, data availability statements, or supplementary materials included in this article.
Supplementary Materials
Supplementary Figure 1. pH and chloride sensitivity of the QV5 construct
Supplementary Figure 2. Magnesium sensitivity of the QV5 construct
Supplementary Figure 3. Sensitivity of the QV5 construct to other purine nucleotides
Supplementary Figure 4. Construction of a tandem trimer version of the sensor
Supplementary Figure 5. Spectral properties of Perceval
Supplementary Figure 6. Response properties of Perceval
Supplementary Figure 7. pH calibration using nigericin
Supplementary Figure 8. pH correction of 2-DG and pH-control experiments
Supplementary Figure 9. Comparable response of sensor in HEK293 and COS7 cells
Supplementary Figure 10. Perceval DNA and protein sequences
Supplementary Results
Detailed explanation of the ratio-sensing behavior of the sensor; pH and chloride sensitivity of the ATP sensor; correcting for changes in intracellular pH; and sensitivity of the GlnK1 – cpmVenus construct to Mg2+ ions.