Abstract
The optical density of the human crystalline lens progressively increases with age, the greatest increase in the visible spectrum being at short wavelengths. This produces a gradual shift in the spectral distribution of the light reaching the retina, yet color appearance remains relatively stable across the life span, implying that the visual system adapts to compensate for changes in spectral sensitivity. We explored properties of this adaptive renormalization by measuring changes in color appearance following cataract surgery. When the lens is removed, cataract patients often report a large perceptual shift in color appearance that can last for months. This change in color appearance was quantified for four cataract patients (63–84 years) by determining the chromaticity of stimuli that appeared achromatic before surgery, and at various intervals after surgery for up to 1 year. Stimuli were presented on a calibrated CRT as 9.5-deg spots, with 3-s duration and 3-s interstimulus intervals (ISIs). Chromaticity was adjusted by the subjects in CIE L*a*b* color space with luminance fixed at 32 cd/m2, on a dark background. We also estimated the optical density of the cataractous lens by comparing absolute scotopic thresholds from 410 nm to 600 nm before and after surgery. The results demonstrated that immediately following surgery there is a large increase in the short-wave light reaching the retina, mainly below 500 nm. The achromatic settings generally showed an initial large shift in the “yellow” direction after surgery that gradually (but never fully) returned to the original achromatic point before surgery. The shifts in the achromatic point occur over a number of months and appear to occur independently of the fellow eye.
Keywords: Cataract, Achromatic settings, Adaptation, Color constancy, Color appearance
Introduction
The spectrum of light reaching the human retina gradually changes over the life span due to the natural aging of the crystalline lens. The accumulation of chromophores produces an increasing yellowing of the lens that results in greater absorption of light at the shorter visible wavelengths (Weale, 1988; Brown, 1999). Despite the gradual change in the filtering effect of the lens, color appearance remains relatively stable (Schefrin &Werner, 1993; Werner & Schefrin, 1993; Kraft & Werner, 1999). This stability reflects a form of color constancy, but it is not clear whether the long-term nature of these changes involves the same processes that have been studied in classical color-constancy experiments. Nuclear sclerotic cataracts are an extreme example of the yellowing of the lens with age. Following removal of these cataractous lenses, there is a substantial increase in shorter visible-wavelength light reaching the retina and patients often report large shifts in color. For example, Granville (1990) reported in a case study that following surgery the morning sky was a more saturated violet–blue and whites acquired a violet tinge.
The visual system normally adapts quickly to changes in illumination. Rinner and Gegenfurtner (2000) measured the time course of adaptation to a background light by asking observers to make achromatic adjustments to a central patch that was presented for a range of time intervals. They estimated that about 60% of the total adaptation effect they recorded occurred within 25 ms and was complete in around 2 min. Most color-constancy research has focused on this short-term adaptation (e.g. Arend & Reeves, 1986; Brainard &Wandell, 1992; Bauml, 1999; Kraft & Brainard, 1999). However, there is some evidence that the visual system continues to adapt slowly over longer periods under other conditions. For example, Eisner and Enoch (1982) asked subjects to wear a red filter over one eye for 1 week. After removal of the filter, unique yellow settings took several hours to return to baseline levels. More recently, Neitz et al. (2002) conducted a similar study where subjects wore either red- or green-filtered lenses over both eyes for a set number of hours per day (4, 8, or 12) for a number of days (periods varied between subjects). Unique hue settings slowly changed by about ± 4 nm over the time course of adaptation and took several days to renormalize.
The visual system undergoes very long-term adaptation to changes in the light reaching the retina due to the aging of the crystalline lens. We studied the nature of this adaptation by measuring the shift in color appearance after cataract surgery and the time course for the visual system to stabilize. We asked four cataract patients to make achromatic settings before surgery, and at various times after surgery for a period of up to 1 year. We also determined the change in lens absorption by measuring scotopic absolute thresholds at a range of wavelengths before and after surgery. There was a large shift in achromatic settings immediately after surgery into the “yellow” region. Using lens-absorption measurements, we were able to compare settings based on light reaching the retina before and after surgery. The initial postsurgery settings showed some initial adaptation that gradually moved toward a typical white point with most of the adaptation completed within about 3 months.
Materials and methods
Overview
The change in light reaching the retina after surgery was measured by comparing absolute scotopic thresholds before and after surgery. Color-appearance shifts were quantified based upon achromatic settings made on a calibrated CRT. Four observers participated in the achromatic point measurements; three of these observers were also available for lens-absorption measurements.
General methods
Only observers with nuclear sclerotic cataracts were used. These cataracts result from the same processes responsible for the normal aging of the lens and develop slowly over many years (Young, 1991). Prior to surgery, each cataract was given a density rating by an ophthalmologist based on visual inspection. The scale ranges from 1 for a mild cataract to 4+ for a severe cataract in accordance with standard clinical practice (Pirie, 1968). Most cataracts in California are removed before they reach a rating of 4. (Note that the rating given to a cataract is somewhat subjective and can differ between ophthalmologists. However, because we made direct measurements of lens absorption, this variability is not an important issue here.) Visual acuity takes a number of weeks to stabilize after cataract surgery. Therefore on each visit the visual acuity of the test eye was measured by a qualified clinician and corrected by wearing the optimal trial lenses during the experiment. Following cataract surgery, the test eye was examined for the presence of abnormal ocular media and retinal disease using slit-lamp examination and by taking fundus photographs of the macula and optic disc. These photographs were examined by a retinal specialist. Intraocular pressure was ≤22 mm Hg for all observers. All observers were normal trichromats based upon testing with the Neitz anomaloscope, the HRR pseudoisochromatic plates, and the Farnsworth F-2 plate. In addition, color discrimination was measured on most visits using the Cambridge Colour Vision Test as described below (Regan et al., 1993; Mollon & Reffin, 2000).
Four observers participated in this experiment (2 males and 2 females, age range 63–84 years). All had nuclear sclerotic cataracts rated as either “3+,” or “2–3+.” The patient details are set out in Table 1. Two of our observers had early signs of age-related macular degeneration (intermediate to large soft drusen). They were included in the study because their color vision tests were all normal and their results were similar to other observers. Presurgery Snellen acuities ranged between 20/25 to 20/50. All observers had a replacement intraocular lens (IOL) implanted during surgery. Observer A did not participate in the lens-absorption measurement experiment. Written informed consent was obtained following the Tenets of Helsinki, and with approval of the Office of Human Research Protection of the University of California, Davis, School of Medicine.
Table 1.
Subjects
| Observers | M/F | Age at surgery |
Test eye cataract ratings |
Fellow eye surgery |
Retinal exam |
|---|---|---|---|---|---|
| A | F | 71 | 2–3+ NS | 8 months before | Normal |
| B | F | 84 | 2–3+ NS | 1 month before | Intermediate/large soft drusen |
| C | M | 63 | 3+ NS | 2 months after | Intermediate soft drusen |
| D | M | 80 | 2–3+ NS | 10 years before | Normal |
Lens-density measurements
A Maxwellian-view optical system was used to measure scotopic spectral sensitivity from which lens-density changes following cataract surgery could be derived. The source was a 300 W xenon arc lamp regulated by a DC power supply that was shaped spectrally by a holographic grating monochromator (Instruments SA/Jobin Yvon, Edison, NJ) having a half-band pass <8 nm. Conventional optics involving doublet-achromat lenses and front-surfaced mirrors were used so that calibrated neutral density filters and wedges could be placed in collimated and focused portions of the beams, respectively. Wedge positions were controlled by the subject and monitored with potentiometers and a linear readout system. A light chopper was placed at a focal point to produce square-wave flicker with 100% modulation depth. The final Maxwellian-view image was 2.5-mm diameter at the plane of the observer’s pupil.
An adjustable chair and bite-bar assembly, allowing movements along three orthogonal directions, were used to position the subjects. The centration of the Maxwellian image in the plane of the pupil was evaluated using a pupil viewer.
Radiometric measurements of the spectral lights and calibrations of the neutral-density wedges and filters at each tested wavelength were made using a silicon photodiode and linear readout system (United Detector Technology, Hawthorne, CA; 81 Optometer) that was calibrated relative to the standards of the National Institute of Standards and Technology.
Following 30-min dark adaptation, a 21-deg circular monochromatic field was presented with 3-Hz square-wave modulation. Subjects were asked to adjust the luminance of the flickering light until they could just detect flicker. Three settings were made at each wavelength. The presentation order of the wavelengths was randomized. Thresholds were measured for seven wavelengths (410, 430, 450, 470, 505, 550, and 600 nms) on two occasions: once before surgery and once after surgery.
Achromatic loci measurements
The stimuli were presented on a 17-inch CRT monitor (Sony Trinitron Multiscan G220, Sony Corporation of America, New York, NY) driven by a Macintosh G4 733 MHz computer with an 8-bit graphics card (ATI RagePro 128, ATI Technologies, Inc., Ontario, Canada). The experimental software was written in MATLAB (http://www.mathworks.com/) using the Psychophysics Toolbox extensions (Brainard, 1997; Pelli, 1997). The monitor was calibrated using a Minolta colorimeter (CS 100 Chroma Meter) and procedures set out in Brainard et al. (2002). The CIE 1964 10-deg color-matching functions were used to convert between the measured monitor RGB outputs and experimental color-space coordinates (CIE xyY).
The stimulus was a circular field subtending 9.5 deg when viewed at a distance of 60 cm. The stimulus was presented as a 3-s flash on a dark background with 3-s interstimulus intervals, repeated until the subject reached an appropriate setting. The starting chromaticity has been shown to have an effect on final settings (Brainard, 1998) and therefore the starting points were picked randomly within a color range of ± 80 units in CIE L*a*b* space. The stimulus was viewed monocularly (the fellow eye was patched). For one subject (observer A), the fellow eye was also tested at various times with the test eye patched.
The experiment took place in a windowless room with all lights off. Observers dark adapted for 5 min before starting the experiment. They adjusted the chromaticity of the circular stimulus until it appeared achromatic (removing all traces of blue, yellow, red, and green). During an adjustment, the luminance of the test patch was held fixed at 32 cd/m2. Observers controlled the chromaticity of the test patch by pushing buttons on a game controller arranged so that the stimulus could be changed along nominal blue–yellow and red–green axes. The button presses changed the CIELAB a* and b* chromaticity coordinates of the test in equal steps. Observers were also able to toggle between two adjustment step sizes by pressing a separate button. Equal-energy white was used as the white point for the conversion to L*a*b* coordinates. Eight achromatic settings were made in each session. Each observer participated in at least one practice session before the experiment commenced.
Color-appearance tests were made on at least one occasion before surgery, and at a range of test dates following surgery up to 1 year for observer A and up to 6 months for the other three observers.
Chromatic-discrimination measurements
The Cambridge Colour Test was used to quantify changes in chromatic discrimination before and after cataract removal (Regan et al., 1993; Mollon & Reffin, 2000). The stimulus was a Landolt-C pattern composed of spots (2–16 cd/m2) presented on a background consisting of spots following the design of pseudoisochromatic plates. The subject’s task was to detect the location of the gap in the Landolt C using a four-alternative forced choice. Discrimination thresholds were measured in 16 color directions from a fixed white point (x, y = 0.310, 0.316) and fitted with an ellipse.
Stimuli were presented on a calibrated CRT display (Sony GDM-200 PS) controlled by a video board with 15-bit resolution (Cambridge Research Systems, VSG 2/4, Rochester, Kent, UK) using a Dell Pentium computer. Thresholds were measured using a 4AFC interleaved staircase procedure. Prior to surgery, observers typically showed some loss in sensitivity along a dimension close to the tritan axis. The loss was due to absorption by the cataractous lens rather than any pathology, as evidenced by normal ellipses following surgery.
Results
Lens densities
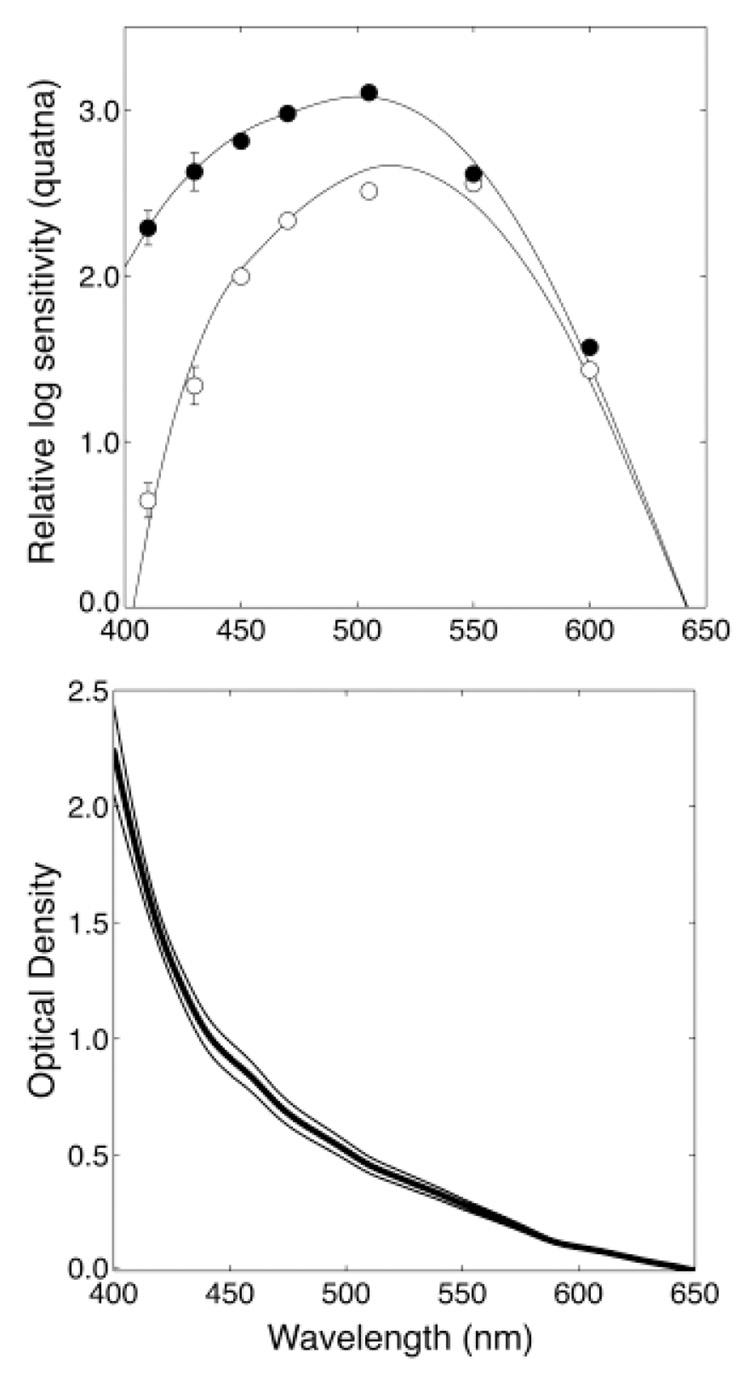
A typical set of absolute scotopic-sensitivity measurements before and after surgery is shown in the top panel of Fig. 1. The V′λ scotopic-sensitivity curve is based on the sensitivity of young observers and is intended to represent people with a maximum age of 30 years (Wyszecki & Stiles, 1982, p. 258). To fit our presurgery data, we used the Pokorny et al. (1987) lens-aging model to estimate the additional loss of sensitivity due to age-related increases in lens absorption. The model consists of two absorption spectra; L1 and L2. The L2 spectrum accounts for the lens absorption that is stable after age 20 years and is constant with negligible absorption for wavelengths ≥ 450 nm. The L1 spectrum accounts for the additional absorption due to aging after age 20 years and is adjusted using a scale factor defined by age. The rate of aging of the lens varies between observers and we were able to obtain the best fit to our presurgery data by allowing age to be a free parameter. The fits were performed using the Optimization Toolbox in Matlab (Grace, 1990).
Fig. 1.
The top panel shows scotopic threshold measurements for a typical cataract patient before surgery (open circles) and after surgery (closed circles). The curves show model fits (see text for details). Error bars are ±1 S.E.M. The bottom panel shows the mean optical density difference (thick black line) between the presurgery and postsurgery absorption curve fits for four patients with cataracts rated as 2–3+. The thin lines show ±1 standard deviation.
The postsurgery data were fit well by subtracting the L2 component from the standard V′λ sensitivity curve suggesting that the IOLs in our subjects had a spectrally flat absorption spectrum over the visible wavelength range. It was found that a slightly better fit could be obtained if the L2 component could be scaled by a free parameter (possibly to take into account absorption by other ocular media). The mean optical density difference before and after surgery for four observers is shown in the bottom panel of Fig. 1. For observer A (who did not participate in this experiment), we used this mean absorption spectrum. For the other observers, their individually measured absorption curves were used.
Achromatic loci
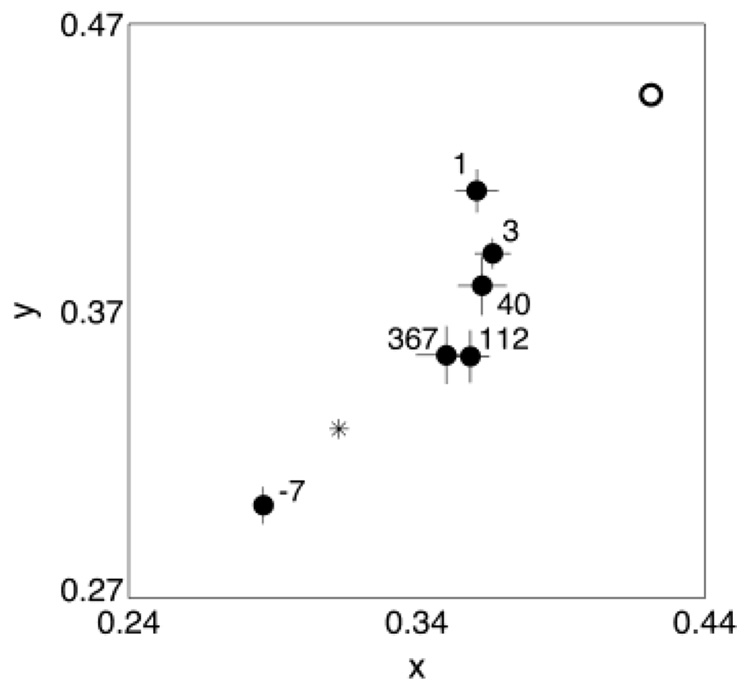
Fig. 2 shows the mean achromatic settings for observer A over a 1-year period. Each setting is labeled with the day the setting was made relative to the surgery date. The presurgery setting was in the “bluish” region and there was a large shift into the “yellow” region of color space after surgery that slowly returned in the direction of a typical white point (e.g. CIE Illuminant D65) over time. The open circle in Fig. 2 shows the presurgery setting after the filtering difference data have been taken into account. This is the estimated chromaticity of the setting measured at the retina and can be regarded as the starting point for chromatic adaptation. One day after surgery the achromatic setting had already started to shift toward a typical white point. The subsequent settings continued to migrate slowly toward this white point over a period of about 3 months when they stabilized.
Fig. 2.
Achromatic settings made for observer A using the test eye over a period of about 1 year. Each setting is labeled according to the day the setting was made relative to the surgery date. The open circle shows the equivalent presurgery setting calculated using the lens-absorption difference results. The asterisk shows the chromaticity of a typical white point (CIE Illuminant D65). Error bars are ± 1 S.E.M. Some settings have been omitted for clarity.
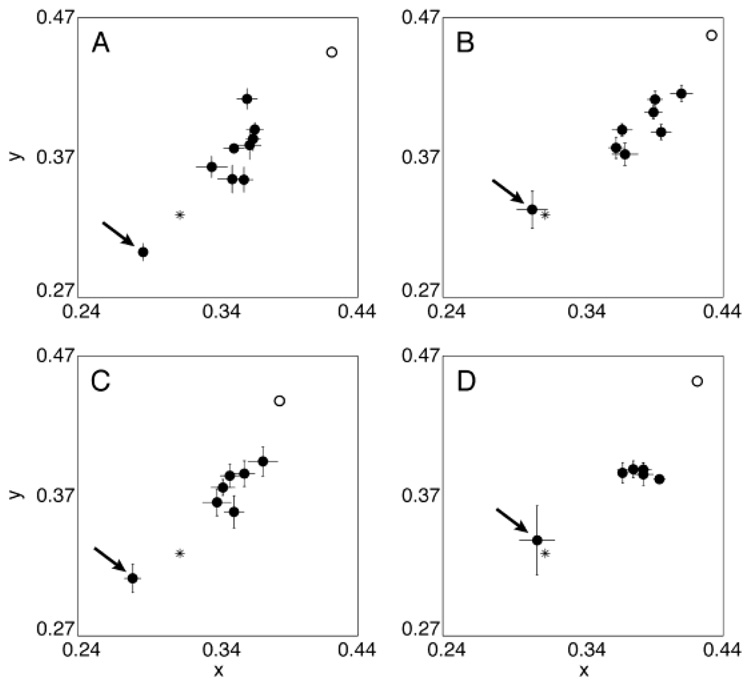
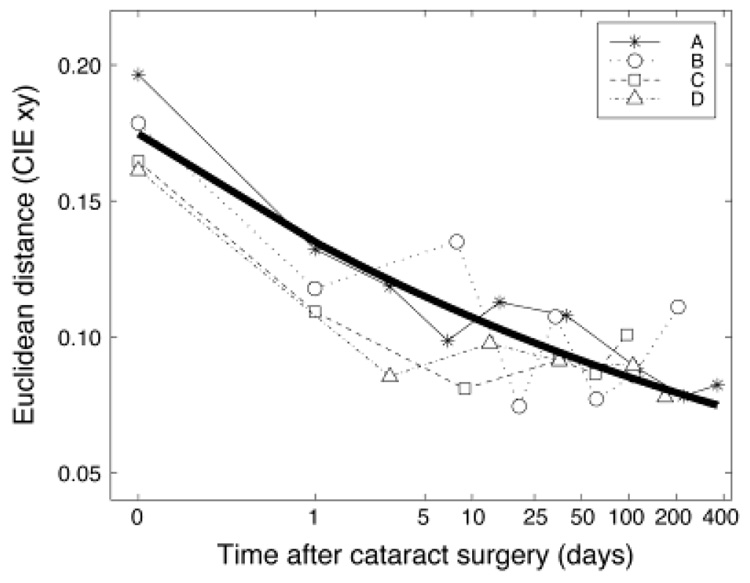
A similar trend was found for observers B and C (tested over a 6-month period). The movement for settings made by observer D was smaller. All four observer’s settings are shown in Fig. 3. Fig. 4 shows the shift in settings over time relative to surgery. The y-axis shows the Euclidean distance in CIE xy chromaticity space from the presurgical white point. The x-axis shows the days from surgery (in log units) with day 0 based on the adjusted presurgery setting using the lens-absorption results. Each observer’s data were well fit by a scaled decaying exponential function of time. The mean function (exponent: −0.10, scale: 0.13) is shown by a bold curve in Fig. 4.
Fig. 3.
Achromatic settings made for all four observers using the test eye over a period of 1 year for observer A and 6 months for the other three observers. The presurgery setting is indicated by an arrow. The open circle shows the equivalent presurgery setting calculated using the lens-absorption difference results. The first setting postsurgery tends to be reasonably close to the equivalent presurgery settings but already shows some adaptation. Subsequent settings slowly migrate toward a typical white point (e.g. CIE Illuminant D65 shown by an asterisk). Error bars are ± 1 S.E.M.
Fig. 4.
The shift in achromatic settings over time for the four observers. The x-axis shows the days from surgery on a log scale. Day 0 is the adjusted presurgery using the lens-absorption measurements. The y-axis shows the Euclidean distance in CIE xy space from D65. The bold curve shows the mean of the best-fitting decaying exponential functions for each observer.
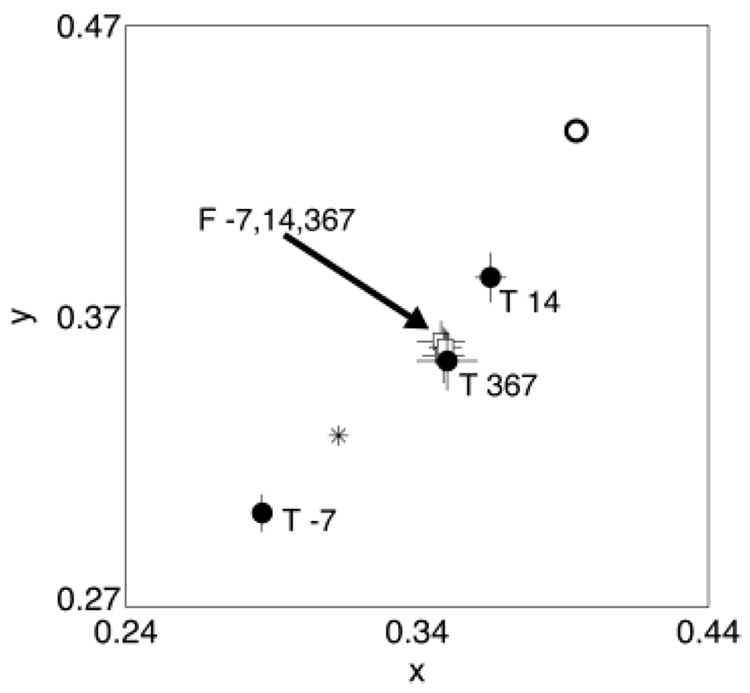
For observer A, we also obtained achromatic settings for the fellow eye over the same period as the test eye. Surgery on the fellow eye was performed 8 months prior to the test eye. The achromatic settings made using the fellow eye were relatively stable and showed no obvious relation with the test-eye settings. For illustration purposes, Fig. 5 compares settings made using each eye measured on three different occasions relative to surgery (1 week before surgery, 2 weeks after, and 1 year after). The test-eye settings moved substantially, whereas the fellow-eye settings were stable. Note that the final setting made using the test eye ended up at the same location as the fellow-eye settings.
Fig. 5.
Achromatic settings made for observer A using the test (T) eye (closed circles) and the fellow (F) eye (open squares) on three different days relative to surgery. The open circle shows the equivalent presurgery setting calculated using the lens-absorption difference results. The asterisk shows the chromaticity of a typical white point (CIE Illuminant D65). Error bars are ± 1 S.E.M.
Color discrimination
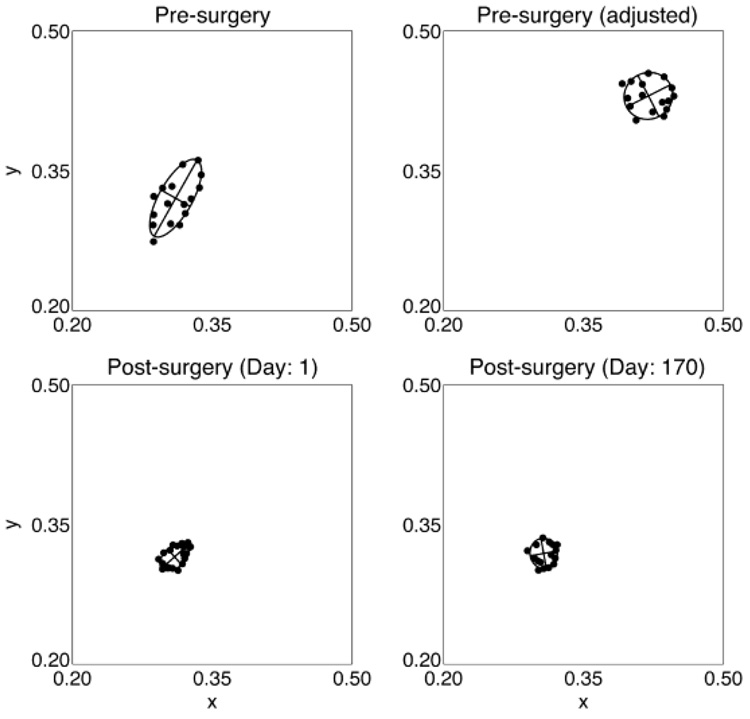
Subjects often showed some loss of color discrimination along a “yellowish/bluish” axis prior to surgery indicated by relatively large discrimination ellipses when tested using the Cambridge Colour Test (see presurgery ellipse in Fig. 6 for an example). The orientation of the major axis was in a tritan direction and was consistent with our cataract filtering measurements that show a large loss in light at the shorter wavelengths. This is supported by the top-right panel of Fig. 6 showing the ellipse based on settings that were adjusted based on the difference in absorption between the cataractous lens and the IOL. Note that the adjusted ellipse is still relatively large compared with the 1-day postsurgery ellipse. Discrimination generally returned to normal levels directly following surgery and remained stable for the period of testing (see bottom panels of Fig. 6). This contrasted with color-appearance measurements that took about 3 months to stabilize (see Fig. 1).
Fig. 6.
Color-discrimination ellipses (using the Cambridge Colour Test) for observer C before surgery and at 1 day and 6 months after surgery. The lens-absorption difference results were applied to the presurgery settings to produce the “adjusted” ellipse in the top-right panel.
Discussion
The color appearance of objects remains relatively constant despite changes in the filtering effect of the crystalline lens with age (Schefrin & Werner, 1993; Werner & Schefrin, 1993; Kraft & Werner, 1999; Okajima et al., 2002). The visual system is not perfectly color constant (e.g. Arend & Reeves, 1986; Kraft & Brainard, 1999) and therefore it is unlikely that all of the change in light at the retina will be discounted, especially when short-wavelength light reaching the retina is negligible. Kraft and Werner (1999) showed that the expected shift in the appearance of desaturated stimuli is compensated well over a range of normal age-related changes in lens density, but was incomplete at the highest lens densities. This explains why precataract surgery achromatic settings tend to be slightly “bluish” to cancel out the residual “yellow” appearance of the world. After surgery, patients usually report a large change in color appearance and our patients made achromatic settings in the “yellow” region to compensate for the additional short-wavelength light reaching the retina. When measured at the cornea, the shift in achromatic settings immediately following surgery is large. However, when the estimated presurgery setting at the retina is calculated (using the lens-absorption data), the presurgery and day 1 postsurgery settings are reasonably close. The first postsurgery setting already shows signs of adaptation to the new spectrum of light, since the settings have moved from the adjusted presurgery setting toward a typical white point. Subsequent settings continued this migration but stabilized after about 3 months. Again, the visual system is not perfectly color constant and the settings did not fully return to a typical “white” point.
Not only is the chromaticity of the light changed by a cataractous lens, the intensity of the light is also reduced. In our experiment we used a stimulus with an intensity of 32 cd/m2. However, the typical cataractous lens that we measured reduced this intensity by about 40% at the retina. It is unlikely, however, that the change in intensity affected achromatic settings. Walraven and Werner (1991) demonstrated that intensity changes over a 4-log-unit range had little effect on achromatic settings.
We used achromatic settings to quantify changes in the visual system because, unlike unique hue settings, achromatic settings probe color space simultaneously in all directions. Achromatic settings can be regarded as the balance point between the hue axes and also correspond to the stimulus for which the gains of the cone signals are normalized (Walraven & Werner, 1991). Changes in relative cone sensitivity and/or in their postreceptoral sites of combinations would be expected to shift the achromatic locus.
Neitz et al. (2002) found interocular transfer of adaptation for one subject when one eye was exposed to a change in illumination over long periods, and the other eye was used to make unique yellow settings. They concluded that the adaptation mechanism they examined was cortical. Wolf and Kluxen (1983) examined color vision in a patient with a unilateral cataract. Color matches made separately for each eye were different. Ayama et al. (2001) found that color appearance in the 2 eyes had not fused 1 year after a patient had one cataract removed. These cataract patient results do not necessarily indicate monocular adaptation: a central binocular mechanism may adapt to a combination of the inputs from both eyes. To distinguish whether a mechanism is monocular or binocular requires a comparison of color-appearance settings for both test and fellow eyes over the period of readaptation. If the fellow-eye settings show no change over a period of change for the test-eye settings, then we can conclude that the mechanism is monocular. The results from one of our observers (observer A) suggest that the sensitivity changes underlying the achromatic settings are monocular.
The dissociation in the time course of changes in color discrimination and color appearance constrains the locus of the site(s) of chromatic renormalization. Color discrimination generally returned to normal levels within 1 day following surgery and improvement could not be completely accounted for by the difference in absorption levels between the cataract and IOL (see Fig. 6). Shinomori et al. (2001) found that postreceptoral mechanisms, presumed to be in the retina and lateral geniculate nucleus (LGN), can account for many aspects of color discrimination and their changes with age. Although discrimination returned to normal almost immediately after surgery, color appearance took weeks to stabilize. This suggests that the site of adaptation is higher in the visual system than the site of discrimination (unless the two processes are parallel). Related results were obtained from a comparison of the loci of unique blue and green of subjects with diabetes and age-matched controls (Schefrin et al., 1991). Despite large selective sensitivity losses of an S-cone mechanism (mean of 0.86 log unit and predicted shifts of unique blue of 47 nm), the unique hue loci for all tested diabetic subjects fell within the range of unique hue loci for the controls, suggesting a postreceptoral renormalization associated with disease as in normal aging. The long-term nature of the renormalization we studied here implies involvement of cortical processes. Separate adaptation for each eye does not rule out a cortical site. For example, the McCollough effect is both cortically based and monocular (McCollough, 1965).
In summary, after removal of nuclear sclerotic cataracts, the spectrum of light reaching the retina changes dramatically with a large increase in shorter wavelength visible light. Although this initially results in a large shift in color appearance in a “bluish” direction, the visual system gradually adapts so that achromatic settings shift toward pre-surgery settings over a period of about 3 months. Re-adaptation appears to occur monocularly, but it is likely to be a cortical process.
Acknowledgments
This research was supported by the National Institutes of Health (AG04058 and EY10834) and a Jules and Doris Stein Research to Prevent Blindness Professorship. We are grateful to Susan Garcia for her help in testing subjects.
References
- Arend LE, Reeves A. Simultaneous color constancy. Journal of the Optical Society of America A. 1986;3:1743–1751. doi: 10.1364/josaa.3.001743. [DOI] [PubMed] [Google Scholar]
- Ayama M, Suda N, Narisada K. Proceedings of the International Workshop on Gerontechnology. Tsukuba, Japan: National Institute of Bioscience and Human Technology; 2001. Color appearance of elderly observer with and without intraocular lens; pp. 81–82. [Google Scholar]
- Bauml KH. Simultaneous color constancy: How surface color perception varies with the illuminant. Vision Research. 1999;39:1531–1550. doi: 10.1016/s0042-6989(98)00192-8. [DOI] [PubMed] [Google Scholar]
- Brainard DH. The psychophysics toolbox. Spatial Vision. 1997;10:433–436. [PubMed] [Google Scholar]
- Brainard DH. Color constancy in the nearly natural image. 2. Achromatic loci. Journal of the Optical Society of America A. 1998;15:307–325. doi: 10.1364/josaa.15.000307. [DOI] [PubMed] [Google Scholar]
- Brainard DH, Wandell BA. Asymmetric color-matching: How color appearance depends on the illuminant. Journal of the Optical Society of America A. 1992;9:1433–1448. doi: 10.1364/josaa.9.001433. [DOI] [PubMed] [Google Scholar]
- Brainard DH, Peli DG, Robson T. Display characterization. In: Hornak J, editor. The Encyclopedia of Imaging Science and Technology. New York: John Wiley and Sons; 2002. pp. 172–188. [Google Scholar]
- Brown NP. Classification and pathology of cataract. In: Easty DL, Sparrow JM, editors. Oxford Textbook of Ophthalmology. Vol. 2. New York: Oxford University Press; 1999. pp. 474–482. [Google Scholar]
- Eisner A, Enoch JM. Some effects of 1 week’s monocular exposure to long-wavelength stimuli. Perception and Psychophysics. 1982;31:169–174. doi: 10.3758/bf03206217. [DOI] [PubMed] [Google Scholar]
- Grace A. Optimization Toolbox for Use with MatLab—User’s Guide. Natick, Massachusetts: The Mathworks, Inc.; 1990. [Google Scholar]
- Granville WC. Colors do look different after a lens implant. Color Research and Application. 1990;15:59–62. [Google Scholar]
- Kraft JM, Brainard DH. Mechanisms of color constancy under nearly natural viewing. Proceedings of the National Academy of Sciences of the U.S.A. 1999;96:307–312. doi: 10.1073/pnas.96.1.307. [DOI] [PMC free article] [PubMed] [Google Scholar]
- Kraft JM, Werner JS. Aging and the saturation of colors. 2. Scaling of color appearance. Journal of the Optical Society of America A. 1999;16:231–235. doi: 10.1364/josaa.16.000231. [DOI] [PubMed] [Google Scholar]
- McCollough C. Color adaptation of edge-detectors in the human visual system. Science. 1965;149:1115–1116. doi: 10.1126/science.149.3688.1115. [DOI] [PubMed] [Google Scholar]
- Mollon JD, Reffin JP. Handbook of the Cambridge Colour Test. London, UK: 2000. www.crsltd.com. [Google Scholar]
- Neitz J, Carroll J, Yamauchi Y, Neitz M, Williams DR. Color perception is mediated by a plastic neural mechanism that is adjustable in adults. Neuron. 2002;35:783–792. doi: 10.1016/s0896-6273(02)00818-8. [DOI] [PubMed] [Google Scholar]
- Okajima K, Tsuchiya N, Yamashita K. Age-related changes in colour appearance depend on unique-hue components; Proceedings of the SPIE 4421; 2002. pp. 259–262. [Google Scholar]
- Pelli DG. The VideoToolbox software for visual psychophysics: Transforming numbers into movies. Spatial Vision. 1997;10:437–442. [PubMed] [Google Scholar]
- Pirie A. Color and solubility of the proteins of human cataracts. Investigative Ophthalmology. 1968;7:634–642. [PubMed] [Google Scholar]
- Pokorny J, Smith VC, Lutze M. Aging of the human lens. Applied Optics. 1987;26:1437–1440. doi: 10.1364/AO.26.001437. [DOI] [PubMed] [Google Scholar]
- Regan BC, Reffin JP, Mollon JD. Luminance noise and the rapid determination of discrimination ellipses in colour deficiency. Vision Research. 1993;34:1279–1299. doi: 10.1016/0042-6989(94)90203-8. [DOI] [PubMed] [Google Scholar]
- Rinner O, Gegenfurtner KR. Time course of chromatic adaptation for color appearance and discrimination. Vision Research. 2000;40:1813–1826. doi: 10.1016/s0042-6989(00)00050-x. [DOI] [PubMed] [Google Scholar]
- Schefrin BE, Werner JS. Age-related changes in the color appearance of broadband surfaces. Color Research and Application. 1993;18:380–389. [Google Scholar]
- Schefrin BE, Adams AJ, Werner JS. Anomalies beyond sites of chromatic opponency contribute to sensitivity losses of an S-cone pathway in diabetes. Clinical Vision Sciences. 1991;6:219–228. [Google Scholar]
- Shinomori K, Schefrin BE, Werner JS. Age-related changes in wavelength discrimination. Journal of the Optical Society of America A. 2001;18:310–318. doi: 10.1364/josaa.18.000310. [DOI] [PMC free article] [PubMed] [Google Scholar]
- Walraven J, Werner JS. The invariance of unique white: A possible implication for normalizing cone action spectra. Vision Research. 1991;31:2185–2193. doi: 10.1016/0042-6989(91)90171-z. [DOI] [PubMed] [Google Scholar]
- Weale RA. Age and the transmittance of the human crystalline lens. Journal of Physiology (London) 1988;395:577–587. doi: 10.1113/jphysiol.1988.sp016935. [DOI] [PMC free article] [PubMed] [Google Scholar]
- Werner JS, Schefrin BE. Loci of achromatic points throughout the life span. Journal of the Optical Society of America A. 1993;10:1509–1516. doi: 10.1364/josaa.10.001509. [DOI] [PubMed] [Google Scholar]
- Wolf E, Kluxen G. Colour vision in a case of unilateral nuclear cataract. In: Verriest G, editor. Colour Vision Deficiencies VII. The Hague: Dr. W. Junk Publishers; 1983. [Google Scholar]
- Wyszecki G, Stiles WS. Color Science—Concepts and Methods, Quantitative Data and Formulae. 2nd edition. New York: John Wiley – Sons; 1982. [Google Scholar]
- Young RW. Age-Related Cataract. New York: Oxford University Press; 1991. [Google Scholar]


