

Abstract
During their life cycle African trypanosomes must quickly adapt to the different environments of the tsetse fly midgut and the mammalian bloodstream by modulating expression of many of their genes. One group of these differentially expressed genes encodes different forms of a major surface protease. Using a luciferase reporter gene transiently or permanently transfected into trypanosomes, we show here that the 3′-UTRs of these protease genes are responsible for their differential expression. Deletion analysis of the 389-bp 3′-UTR of one of the protease genes, MSP-B, demonstrated that it contains a U-rich regulatory region of about 23 bp (UCGUCUGUUAUUUCUUAGUCCAG), which suppresses expression of the reporter protein in bloodstream trypanosomes by as much as 25-fold, but has little effect on the reporter expression in procyclic (tsetse fly) trypanosomes. Replacing the entire 3′-UTR with just this 23-bp element mimicked most of the suppression effect of the complete 3′-UTR. Northern blots showed that the 23-bp element influences the steady state RNA level, but not enough to account for the 25-fold suppression effect. Polysome analyses showed that in procyclic trypanosomes more of the total protease mRNA is associated with intermediate-sized and large polysomes than in bloodstream trypanosomes. Thus, the 23-bp element of this protease gene affects both the level of RNA and its translation.
1. Introduction
African trypanosomes are well known for their ability to evade the host immune system through the process of antigenic variation. The variant surface glycoprotein (VSG), a homodimer that constitutes 5-10% of the total protein in bloodstream form (BSF) trypanosomes, periodically switches, which enables the trypanosomes to evade the host immune response (reviewed in [1]). With the discovery of Leishmania spp. major surface protease (MSP) homologues in the African trypanosome, Trypanosoma brucei, [2] and the demonstration that one MSP class, MSP-B, plays a role in release of the VSG during differentiation from BSF cells to procyclic (PRO) trypanosomes [3], the regulation of MSP gene (MSP) expression became the focus of this research.
T. brucei has three classes of MSP genes, called MSP-A, -B and -C, grouped on the basis of their different 3′ untranslated regions (UTRs) and their differential expression during the T. brucei life cycle [4]. The haploid genome contains four tandem copies of MSP-B, at least six copies of MSP-A located in two genomic locations and a single copy of MSP-C. All three classes have been shown by northern blot analysis to be transcribed in BSF cells, whereas only MSP-B RNA is present at a readily detectable level in PRO cells. MSP-B protein expression occurs early in differentiation from BSF to PRO cells, continues through the conversion to PRO cells, and is constitutively expressed in PRO cells [3].
African trypanosomes and other Trypanosomatids have a distinctive mode of polycistronic transcription that does not occur in their mammalian and insect hosts. The genomes of these parasites are arranged in large tandem arrays of protein-coding genes that are transcribed into long polycistronic precursor RNAs. Individual monocistronic mRNAs are then generated from these precursor RNAs by 5′ spliced leader trans splicing and 3′ polyadenylation [5].
Other developmentally regulated genes transcribed by RNA polymerase II have been studied in trypanosomes, and, to date, little or no developmental regulation has been found to occur during the processing events of polyadenylation or trans splicing [6,7]. The mRNA abundance instead has been shown in several cases to be determined by sequences in the 3′-UTRs that modulate RNA degradation and/or translation [4,6,8,9]. Some trypanosome genes, such as the procyclin genes expressed predominately in PRO cells, are regulated by at least two features: (i) their RNA is more unstable in BSF than in PRO, and (ii) translation suppression of procyclin RNA is higher in BSF than in PRO [10,11]. Two regulatory elements in the procyclin 3′-UTRs have been identified: one plays a role in the enhancement of translation in PRO cells and the other is responsible for developmental regulation. Another representative example of 3′ UTR involvement in developmentally regulated T. brucei mRNAs is the cytosolic phosphoglycerate kinase (PGK) gene cluster where the PGKB and PGKC genes of the cluster are differentially regulated [8,12]. Thus, similar to these and other African trypanosome genes, we hypothesized that the 3′-UTRs contribute to the differential expression of the three MSP classes and specific regions within the 3′-UTRs are responsible for that regulation. Following a demonstration that this hypothesis is correct, we then examined the regulatory features of a 23-bp element discovered in the 3′-UTR of the MSP-B class that controls MSP-B expression.
2. Materials and methods
2.1 Trypanosomes
The BSF ‘single marker’ (SM) trypanosome cell line (T7RNAPol TetR NEO) and the PRO 29-13 cell line (T7RNAPol NEO TetR HYG) were gifts from G.A.M. Cross (Rockefeller University, New York). SM cells were maintained in HMI-9 media [13] supplemented with 10% heat-inactivated fetal calf serum (HIFCS) and 5 μg G418/ml. PRO 29-13 cells were maintained in SDM-79 medium [14] supplemented with 10% HIFCS, 15 μg G418/ml, and 50 μg hygromycin/ml. Another PRO cell line, YTAT 1.1 (a gift from E. Ullu, Yale University), was propagated without drug selection in SDM-79 media supplemented with 10% HIFCS and no drug selection. PRO transfections with plasmids requiring the use of a T7 RNA polymerase were performed with the PRO 29-13 cell line. All other PRO cell transfections utilized the PRO YTAT 1.1 cell line.
2.2 Plasmid Construction and Transfection
Most plasmids used were derived from plasmid pHD 496 (kindly provided by Dr. Christine Clayton), which has a pGEM vector as its backbone, and in which the CAT (chloramphenicol acetyltransferase) reporter gene was replaced with the firefly luciferase gene [15] to generate plasmid pMP1 (Figure 1). Modifications of this plasmid were used in transient and stable transfections of both BSF and PRO cells. Replacement of the firefly luciferase gene with the Renilla luciferase gene [16] provided an internal transfection efficiency control for transient transfections. All intercoding (IC) regions and modified 3′-UTRs were placed in pMP1 at its unique BamHI restriction site. The transfection efficiency of BSF cells was usually about two times less efficient than PRO cells.
Fig. 1.

(A) Depiction of the intercoding (IC) regions downstream of the MSP-A, -B, and -C genes. Numbers indicate the lengths of the 3′-UTRs and the total sizes of the IC regions inserted into plasmid pMP1. Also shown is a simplified map of plasmid pMP1 used to test the effects of different ICs on luciferase expression. Plasmid pMP1 was made by replacing the CAT (chloramphenicol acetyltransferase) gene in pHD 496 (kindly provided by Dr. Christine Clayton) with the luciferase gene (LUC). The hygromycin-resistance gene is depicted by HYGR. The flag represents the promoter sequence for the T. brucei rRNA genes. The indicated MSP IC regions were inserted at the BamHI site immediately downstream of LUC, which is followed by an actin IC region (ACT IC). For stable transfection experiments, plasmids were first linearized with NotI, which allows for insertion of the plasmid into an rRNA spacer region (rRNAs) of the T. brucei genome in a reverse orientation. (B) Effect of MSP IC regions on expression of luciferase in BSF and PRO cells. T. brucei cells were transiently transfected with the pMP1 plasmid bearing the indicated IC region, and luciferase activity was measured 24 hrs later. Representative assays of luciferase activity when ACT IC was located directly behind the luciferase gene (in parent plasmid pMP1) were normalized to 100% for both PRO and BSF cells and the relative luciferase activities (Y-axis) for the other IC regions are displayed. The IC regions following a procyclin (pro) or VSG gene serve as positive and negative controls for genes expressed primarily in the PRO and BSF stages respectively. Luciferase expression values associated with the three MSP IC regions are consistent with the relative MSP RNA levels reported previously [21].
Full-length VSG, procyclin, and MSP IC regions were generated by PCR from genomic T. brucei DNA. The PCR primers were designed to amplify from the stop site of the coding region to the start codon of the next downstream coding sequence or the telomeric repeat sequence in the case of the VSG gene. The primers also contained a BamHI restriction site for ligation into the pMP1 plasmid.
For transfections, logarithmic phase PRO cells (5 × 10⁶ ml-1) were collected by centrifugation, washed with EM (a 3:1 mixture of cytomix (120 mM KCl, 0.15 mM CaCl2, 10 mM K2HPO4, 25 mM HEPES, 2 mM EDTA, 5 mM MgCl2, pH 7.6) and phosphate-buffered-sucrose (277 mM sucrose, 1 mM MgCl2, 7 mM KHPO−4, pH 7.4)), and suspended in EM at a concentration of 1 × 10⁸ ml-1. 0.45 ml of cells were mixed with 0.1 ml of plasmid DNA (typically 10 μg of test plasmid and 5 μg of co-transfected control “Renilla” plasmid) in a 0.4-cm electroporation cuvette and subjected to two pulses from a Bio-Rad Gene Pulser electroporator set at 1500 V and 25 microfarads. After electroporation, cells (0.2-0.3 ml) were transferred to 10 ml of fresh SDM-79 + 10% FCS and allowed to recover overnight. For stable transfections the test plasmid was linearized at the NotI site prior to electroporation. Stable transformants in YTAT 1.1 were selected in 50 μg hygromycin ml-1 and clonal lines were obtained by limiting dilution of drug resistant cells.
For BSF transfections, logarithmic phase SM cells (∼1.0 × 10⁶ ml-1) were collected by centrifugation, washed with EM, and resuspended in EM at a concentration of 1 × 10⁸ ml-1. 0.45 ml of cells were mixed with 0.1 ml of plasmid DNA (10 μg of test plasmid and 5 μg of co-transfected control “Renilla” plasmid) in a 0.4-cm electroporation cuvette and subjected to two pulses from a Bio-Rad Gene Pulser electroporator set at 1500 V and 25 microfarads. Cells were transferred to 12 ml of HMI-9 + 10% FCS. For stable transfections, the plasmid was linearized with NotI prior to electroporation and cells were distributed among wells in a 24-well tissue culture plate. After recovering overnight, an equal volume of HMI-9 + 10% FCS plus 5 μg G418 ml-1 and 5 μg hygromycin ml-1 was added to the wells. Drug-resistant cells typically grew out within 7 days. Clonal lines were obtained by limiting dilution of drug resistant cells. SOE PCR- Deletion constructs were derived from the plasmids described above containing the full MSP-B IC region using spliced overlap extension (SOE) PCR [17,18]. SOE PCR facilitates specific deletion of nucleotides from plasmids in which removal by restriction enzyme digestion is difficult. PCR reactions were performed using the Expand High Fidelity PCR System (Roche Applied Science, Mannheim, Germany). One or two nucleotides changes were purposefully placed in the overlap region of the Soe1-Soe6 deletion products to allow insertion of a replacement oligonucleotide described below. These mutations generated a unique plasmid restriction site.
The oligonucleotide used to replace deleted 3′-UTR sequences was synthesized by Integrated DNA Technologies (IDT, Coralville, IA). To design a sequence similar in percent GC content to that of the deleted 3′-UTR fragments, the desired GC content was submitted to a random sequence generator at the University of California at Santa Barbara website (http://www.lifesci.ucsb.edu/∼maduro/random.htm). Each end of the oligonucleotide required the addition of three restriction sites to allow for insertion into the middle of the different SOE PCR generated deletions.
2.3 Luciferase Assay
Luciferase activities in transiently and stably transfected trypanosomes were measured in duplicate in a Moonlight 2010 luminometer (Analytical Luminescence Laboratory, San Diego, CA). For transient transfections, the Dual-Luciferase® Reporter Assay System (Promega, Madison, WI) was used as per the manufacturer's instructions. For these assays the test plasmids bearing the firefly luciferase gene possessed the various 3′-UTR constructs and the co-transfected control plasmid contained the Renilla luciferase gene followed by the actin 3′-UTR. The total light emission was recorded for 10 seconds during the course of the reaction for each tube. For stably transfected trypanosomes, the Luciferase Assay System (Promega, Madison, WI) was used. Cells were counted on a hemocytometer and 1 × 10⁶ cells were spun down for each sample. As before, total light emission was recorded for 10 seconds in a luminometer.
Statistical calculations were performed using SigmaStat® statistical software (version 3.11, Systat Software, Inc.). Briefly, luciferase florescence units were first normalized to Renilla luciferase levels of the same transfectant, then recorded as a fold increase over background of non-transfected cells. For stably transfected T. brucei, luciferase florescence was normalized to the values obtained for the transfectant containing the parent plasmid in each experiment. A one way analysis of variance (ANOVA) was used to analyze all the experiments of a given group of transfectants while allowing for variation between experiments. Significance was established as a p-value of p<0.05.
2.4 Polysome Isolation
Polysome analysis was conducted as described previously [19] with some modifications. Cycloheximide (100 μg ml-1) or puromycin (20 μg ml-1) was added to 1-3 × 10⁹ logarithmic-phase T. brucei cells followed by incubation for 10-15 minutes. After centrifugation, the parasites were washed in cold polysome buffer (300 mM KCl, 10 mM MgCl2, 10 mM Tris (pH 7.5), 1 mM DTT, 10 μg leupeptin ml-1) containing either cycloheximide (100 ug ml-1) or puromycin (20 μg ml-1) or EDTA (20 mM). The cells were then resuspended in 600 μl cold polysome buffer with cycloheximide and 1 μl RNaseOUT™ (Invitrogen). Cells were lysed by adding 0.2% (v/v) NP-40. The lysate was cleared by centrifugation before carefully layering the lysate onto a 15%-50% linear sucrose gradient (10 ml in polysome buffer with cycloheximide and RNase Out). Sucrose gradients were made with a Gradient Maker (Hoefer Scientific Instruments, San Francisco, CA). Polysomes were sedimented by centrifugation in a Beckman SW41 Ti rotor at 36,000 rpm for 2 hr at 4°C. Fractions (1 ml) were collected with a manual fraction recovery system and monitored at A254 on an Econo™ UV monitor (Bio-Rad, Hercules, CA). Each fraction was precipitated with 1 ml of isopropanol, and the precipitate was collected by centrifugation. RNA was isolated from the pellet using a QIAGEN RNeasy® Mini Kit as per provided instructions and processed for northern blots.
2.5 Other Methods
A previously prepared cDNA library of RNA from GUTat 10.1 bloodstream trypanosomes [20] was probed in three successive screens with each of the coding sequences of the three MSP gene classes [21]. Northern blots were conducted on total RNA isolated from T. brucei cells using a QIAGEN Rneasy® Mini Kit (QIAGEN Inc.) as per provided instructions. About 5 μg RNA was separated by electrophoresis on a 1.2% agarose gel (2% formaldehyde) and transferred overnight in 10 X sodium saline citrate (SSC (3 M NaCl/ 0.3 M NaCitrate)) to a positively-charged nylon membrane (Hybond-N+™, Amersham Pharmacia Biotech, Piscataway, NJ) by capillary action. The RNA was immobilized by crosslinking via ultraviolet treatment (Stratalinker®, Stratagene, La Jolla, CA). Specific DNA probes were generated by restriction digests or PCR amplification using specific primers. Probes were α-32P-radiolabeled using a random primed DNA labeling kit (Boehringer Mannheim Biochemicals, Indianapolis, IN), isolated using a NICK™ column as per instructions (Amersham Pharmacia Biotech), and added to a 50% formamide, 6 X SSC, 10 X Denhardt's solution, 0.2% SDS hybridization solution with 150 μg single-stranded salmon sperm DNA/ml at 50°C overnight. The filter was then washed three times for 20 min each at 55°C in increasing stringency of 1 X to 0.5 X to 0.1 X SSC, 0.1% SDS. Filters were then exposed to X-ray film at either room temperature or -70°C for varying lengths of time depending on the strength of the signal.
3. Results
3.1 Identification of the MSP 3′-UTRs
The original characterization of MSP-like genes in the T. brucei genome included sequence determination of a cDNA clone encoding MSP-A, but no cDNA clones for MSP-B or -C [2]. To determine the 3′UTR sequences of each of these three gene classes and the roles they may play in the differential expression of the MSPs, a cDNA library of BSF trypanosomes [20] was probed with the PCR-amplified coding sequences of MSP-A, -B and -C. These coding sequences are sufficiently different that they do not cross-hybridize, even though their deduced protein sequences display about 30% identity. The ratio of cDNA clones encoding MSP-A, -B and -C in the BSF cDNA library was found to be similar to that reported previously [21], i.e., 10:4:1. The DNA sequences of three clones each encoding MSP-A and -C and two clones encoding MSP-B were determined. These cDNA sequences provided the 5′ and 3′-UTR sequences for each of the three gene classes, and their 5′-spliced leader and polyadenylation addition sites. The expression of MSP-A and MSP-C in the BSF cells but not in the PRO cells [4] suggests their mechanism of regulation may be similar. However, sequence comparisons revealed no primary sequence similarities in the 5′ and 3′-UTRs of these two MSP classes, and no similarities with MSP-B (not shown). Likewise, comparisons with the 5′ and 3′-sequences flanking MSP coding sequences in the genomes of Leishmania and T. cruzi, a Latin American trypanosome, showed no significant similarities.
After the 3′-UTRs of all three MSP classes had been determined, PCR amplifications from genomic DNA using a primer within the 3′-most end of each MSP coding sequence and the 5′-most region of the downstream gene coding sequence were employed to generate the intercoding (IC) regions. These IC regions include the 3′-UTR of the upstream gene, the intergenic region and the 5′-UTR of the downstream gene. In the case of tandemly arrayed MSP-A and MSP-B genes, the amplified IC regions were derived from adjacent tandem MSPs. MSP-C is a single copy gene so the downstream primer was placed at the start codon of the putative downstream gene. The sizes of the three MSP 3′-UTRs and total IC regions are indicated in Figure 1A. These PCR-amplified IC regions were inserted behind the firefly luciferase gene in the reporter plasmid, pMP1, and the various plasmids transiently transfected into trypanosomes for subsequent luciferase assays to examine the potential regulatory functions of the IC regions.
3.2 The MSP 3′-UTRs Direct Differential Expression of a Luciferase Reporter Gene
As indicated in Figure 1A, downstream of the ribosomal RNA spacer region (rRNAS) in pMP1 (to enable targeted integration) is the T. brucei rRNA promoter, which is not developmentally regulated [22], followed by a procyclin gene's 5′-UTR and upstream trans splicing signal (5′ PRO), and the firefly luciferase coding sequence (LUC). The IC regions were inserted at the indicated unique BamHI site. Beyond the BamHI site is the IC region between adjacent actin genes in the T. brucei genome (ACT IC) followed by a hygromycin resistance (HYGR) gene used as a selectable marker, and the actin 3′ UTR (3′ ACT). In addition to insertion of the IC regions of each of the three MSP classes, the IC regions following the VSG 10.1 and GPEET procyclin genes were also cloned into the BamHI site. The VSG 10.1 IC region extends from the termination codon of VSG 10.1 in its telomere-linked expression site to the first telomere repeat, a length of 307 bp. Thus, six plasmids were available, i.e., the parent pMP1 plasmid with the ACT IC and the five other plasmids bearing the other ICs.
The results of transient transfections of these six plasmids into BSF and PRO cells are shown in Figure 1B. The Dual-Luciferase reporter assay system (Promega) was used in which the firefly luciferase gene of the parent pMP1 plasmid was replaced with the Renilla luciferase gene and the resulting ‘Renilla’ plasmid co-transfected with each test plasmid to serve as an internal transfection efficiency control. Since actin genes are highly expressed in trypanosomes, the parent pMP1 plasmid containing the ACT IC region downstream of the firefly luciferase gene was used as a control and the luciferase activity associated with this plasmid was called 100% relative luciferase activity. To compare the luciferase values in the presence of the other IC regions, each value is reported as a percentage of the actin IC region-controlled luciferase expression within the corresponding BSF or PRO assay. As expected, when the procyclin IC region was present (pro), much more luciferase expression occurred in PRO cells than in BSF cells, and when the VSG 10.1 IC region was present (VSG), the reverse happened, i.e., much more luciferase expression occurred in BSF cells than in PRO cells. When the IC region of each of the three MSP classes was placed behind the luciferase gene, the relative luciferase expression was consistent with our previous northern blot analysis [21]. All three MSP IC regions were associated with some luciferase expression in BSF cells, whereas only the MSP-B IC region stimulated significant expression in the PRO cells.
3.3 Northern Blot Analysis of MSP-B Expression
Since MSP-B is known to participate in VSG removal during differentiation from BSF to PRO cells, and the functions of MSP-A and -C are unknown, we focused on MSP-B regulation. A northern blot analysis was conducted to more accurately determine the levels of endogenous MSP-B mRNA in PRO and BSF cells (Figure 2A) since the relative MSP-B RNA levels in these two cell types had not been quantitated previously. Alpha-tubulin RNA was used as the loading control. Densitometry measurements indicated that MSP-B mRNA is about 8-fold more abundant in PRO cells than in BSF cells. This 8:1 ratio is consistent with the relative amounts of luciferase activity observed in PRO and BSF cells containing the transiently transfected plasmid bearing the MSP-B IC region (Figure 1B).
Fig. 2.
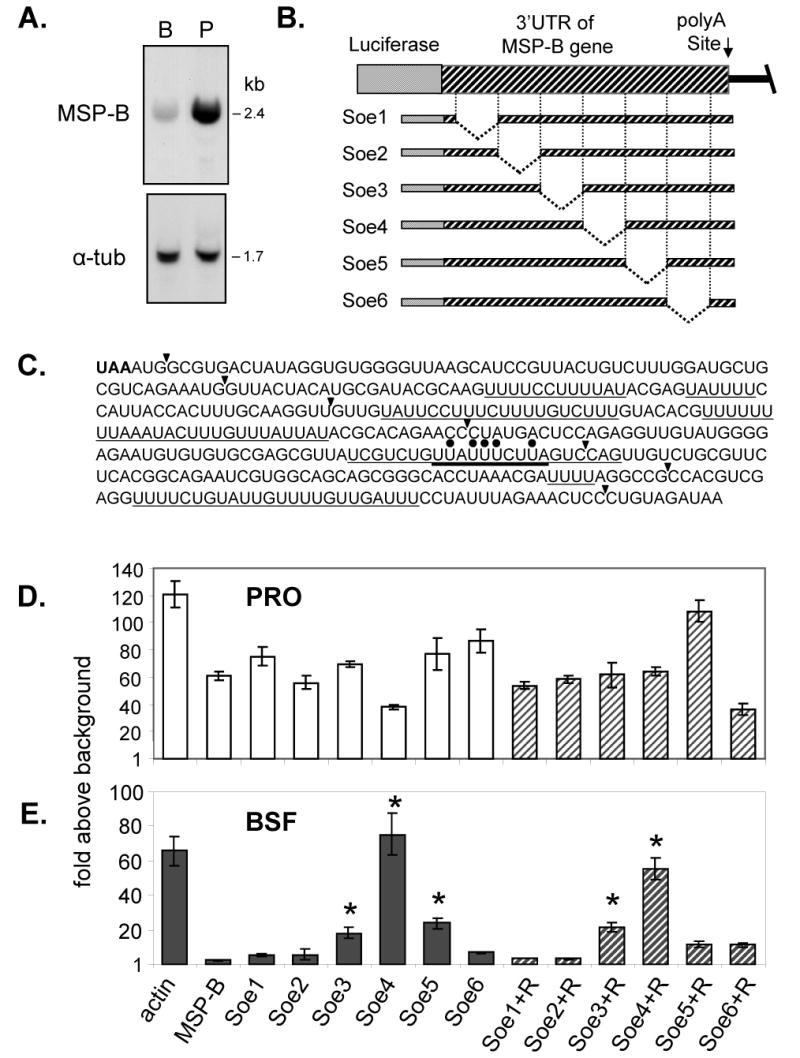
(A) Northern blot of BSF (B) and PRO (P) RNA probed with the MSP-B sequence showing the presence of MSP-B mRNA in both life cycle stages. Densitometer measurements indicated MSP-B RNA is about 8-fold more abundant in PRO cells than BSF cells. The level of α-tubulin RNA is shown to confirm equal loading of total RNA. (B) Diagram indicating six segments of ∼65 bp (Soe 1-6) eliminated from the MSP-B 3′-UTR in the MSP-B IC region using the SOE PCR technique. The poly(A) addition site was maintained for proper processing. (C) Sequence of the 389-nucleotide MSP-B 3′-UTR, 37% of which is uridine residues. The MSP-B termination codon is in bold letters. The Soe 1-6 boundaries are indicated by arrowheads. Uridine-rich regions are underlined. The 23-base region described below is also underlined and its AURE-like segment has a thicker underline. Black dots are above the nucleotides within the AURE-like segment that were mutated. (D and E) Results of luciferase assays of PRO (panel D) or BSF (panel E) cells transiently transfected with the SOE constructs shown in Panel B. Bars indicate the fold increase of luciferase activity over the background of an extract of untransfected PRO or BSF cells (Y-axis). On the X-axis Soe1-6 indicate the deletion constructs shown in panel B, actin refers to the actin IC region, and MSP-B refers to the full-length MSP-B IC region. Soe1+R, Soe2+R, etc., indicated by hashed bars, refer to constructs in which a linker of random sequence (+R) was inserted into the deleted regions of Soe1-6. The luciferase activities for the indicated transient transfections of PRO cells with the MSP-B IC constructs (panel C) do not display differences larger than 2-3 fold (n=11 assays). In contrast, the BSF luciferase assays (panel D) show a statistically significant difference (P<0.05) for MSP-B Soe3, Soe4, Soe5, Soe3+R, and Soe4+R (indicated by an asterisk) when compared to the full length MSP-B IC region (n=8 assays).
3.4 Delineation of the Sequence Required for Regulation of MSP-B
To examine whether the MSP-B genes are regulated by specific sequences within their 3′-UTR, the technique of splicing by overlap extension PCR (SOE PCR) [17,18] was used to delete sections of the MSP-B 3′-UTR. Briefly, in this technique two initial PCR reactions provide amplification products that are used as templates for a final PCR to generate the desired deletion. Deletions generated within the MSP-B 3′-UTR are indicated schematically in Figure 2B, and the MSP-B 3′-UTR sequence is shown in Figure 2C. Six specific regions within this 389-bp 3′-UTR, averaging ∼65 bp in length, were eliminated. After generating the MSP-B 3′-UTR deletions, the new IC regions were placed in the pMP1 plasmid at the unique BamHI site. These deletion constructs, referred to as Soe1-Soe6 (Figure 2B), were transiently transfected into both PRO and BSF trypanosomes (Figure 2D and E). The reported levels of luciferase activity are expressed as the fold increase over the measured luciferase activity in cells that were transfected only with the control Renilla luciferase plasmid. The luciferase activity from the parent plasmid pMP1 (actin IC) is shown on the left to provide a reference in all cases. Note that for this plasmid the ‘fold above background’ of the luciferase activity is about twice as large in PRO cells than in BSF cells, reflecting our unpublished observations that transfection is about two times more efficient in PRO cells than BSF. PRO cells transfected with plasmids containing the full-length MSP-B IC region (MSP-B) or each of the Soe1-Soe6 constructs produced luciferase levels showing that different regions of the MSP-B 3′-UTR do not individually have a substantive role in regulating expression levels in PRO cells, i.e., only a two- to three-fold difference was seen among the different constructs (Figure 2D). This result is consistent with the previous finding that MSP-B protein is present in PRO cells. Transfection of the plasmids into BSF cells, on the other hand, produced luciferase levels indicating that the Soe3, Soe4 and Soe5 deletions have a significant effect, with the Soe4 region being the most prominent candidate for the suppression of expression in BSF cells (Figure 2E). Significant values relative to the full length MSP-B IC (MSP-B) (p<0.05) are indicated by an asterisk on each bar graph. BSF cells transiently transfected with the Soe4 plasmid had about 25-times more luciferase activity than BSF cells transfected with the plasmid containing the full-length MSP-B IC.
It is possible that the deletions in the MSP-B 3′-UTR introduce changes in the spatial relationship of the remaining sequence that may affect luciferase expression. To investigate this possibility, a random linker region of ∼65 bp was generated to insert at the site of the deletions. When generating the original Soe1-Soe6 pMP1 plasmids, each deletion was designed to contain a unique restriction site to accept the linker where the deletion had occurred. Considerations were taken when designing the linker to maintain the average G/C content of the MSP-B 3′-UTR. Then using a random sequence generator at the University of California at Santa Barbara website (http://www.lifesci.ucsb.edu/∼maduro/random.htm), a central 47-bp sequence was generated. Restriction enzyme sites were placed at each end so that with any of three digestions a fragment of ∼65 nt would be generated. The sequence is: 5′ATGCATGTATACTCGAGTCGTATTTGCTGGTCGTGTTTACTTTCACAGTCTTGACCTGGAGA TCAATGCATGTATACTCGAG.
The indicated restriction sites are: NsiI in italics, BstZ17 I underlined, and XhoI in bold. The MSP-B 3′ UTRs in which the deleted segments have been replaced with the linker fragment are referred to as Soe1+R to Soe6+R. Again, transient transfections were conducted with both BSF and PRO cells. In both cases, the results essentially mirrored the results seen with the original deletion constructs (Figure 2D and E). PRO cell transfections with these plasmid constructs showed no luciferase differences greater than about 2-3 fold, whereas BSF cell transfections showed much greater differences in which both Soe3+R and Soe4+R increased luciferase expression significantly (indicated by the asterisk) compared to that of the full length MSP-B 3′-UTR.
3.5 Stable Transfections vs. Transient Transfections
The above experiments were conducted with transiently transfected plasmids. Trypanosomes with stably integrated DNA plasmids provide an opportunity to look directly at RNA levels modulated by various luciferase constructs bearing modified MSP-B 3′-UTRs. The pMP1 plasmid can be linearized at a unique NotI site within the rRNA spacer region (Figure 1A) and the linearized plasmid stably integrates in reverse orientation at an rRNA spacer region in the genome by homologous recombination.
Using stably transfected T. brucei BSF cell lines containing various integrated luciferase constructs, the steady state levels of the luciferase mRNAs were assessed by northern blot (Figure 3A). Quantitative values of these luciferase mRNA levels (the ∼2.4-kb band; see below for discussion of the other bands) were normalized to α-tubulin mRNA (Figure 3B) and reported as the fold increase relative to the non-transfected BSF (WT) cell line (Figure 3C). Luciferase activities in the same cells were also measured and are reported as a percentage relative to luciferase from the actin IC construct (Figure 3D).
Fig. 3.

Analyses of BSF cells stably transfected with plasmids containing the indicated IC regions. (A) Northern blot probed with LUC (luciferase) coding sequence. WT cells are the parent BSF cell line that does not have an integrated test plasmid. “actin”, “pro”, and “VSG” indicate WT-derived cell lines containing integrated plasmids bearing the IC regions of an actin, procyclin, and VSG gene respectively. Luciferase mRNAs were expected to range from 2.0-kb to 2.4-kb, depending on the length of the 3′-UTR. The two other bands of ∼4-kb and 1.4-kb are discussed in the text. (B) The blot shown in panel A was stripped and re-probed with α-tubulin coding region to provide a loading control. (C) Quantification of the ∼2.4-kb luciferase RNA by densitometry of the northern blot in panel A. Values were normalized against the α-tubulin RNA levels to correct for loading. (D) Luciferase activities from the corresponding stable cell lines are expressed relative to luciferase activity in the cell line bearing pMP1, the parent plasmid containing the ACT IC region, which is normalized to 100% (n = 5). Lanes 1-9 in (C) and (D) refer to the corresponding lanes in (A).
The BSF luciferase RNA levels did not completely mirror the corresponding measured luciferase activity (compare Figure 3C and D). For example, the mRNA level measured for the luciferase gene with the full length MSP-B 3′-UTR was about two-fold less than the Soe4+R 3′-UTR (Figure 3C, lane 5 vs. lane 7). Luciferase activity measurements on the same transfected cells, on the other hand, again showed about a 25-fold suppression with the full length MSP-B 3′-UTR compared to Soe4+R (Figure 3D, lanes 5 and 7). This is consistent with the fact that endogenous MSP-B mRNA occurs in BSF cells (Figure 2A), but MSP-B protein is not detectable on western blots [3]. Thus, MSP-B regulation does not appear to be controlled solely by RNA abundance but to also include translational control. The corresponding stably transfected PRO cells, on the other hand, had relative luciferase RNA levels that mirrored closely the relative luciferase activity levels (not shown). This is expected as MSP-B protein occurs in the PRO stage and the luciferase activity levels in stably transfected PRO cells were consistent with the transient transfections performed previously (not shown).
Figure 3A shows that each transfected BSF cell line unexpectedly has three distinct bands of luciferase RNA corresponding to ∼4 kb, ∼2.4 kb and ∼1.4 kb in size. These RNA lengths vary slightly according to the length of the 3′ UTR present. In contrast, transfected PRO cell lines have only a single luciferase RNA of ∼2.4 kb (not shown). The reason for the three bands in BSF cells was discovered to be the result of multiple spliced-leader addition sites specific to the BSF cells [23]. The ∼1.4-kb RNA is too small to encode luciferase, and the ∼4.0-kb RNA has a 5′-UTR of ∼1.6 kb and is likely not translated. Thus, the central RNA band, which is the expected size of ∼2.4 kb, was used to measure luciferase mRNA levels shown in Figure 3C.
3.6 A 23-bp U-Rich Regulatory Element in the MSP-B 3′-UTR
To analyze the MSP-B 3′-UTR further, SOE PCR was used to eliminate segments within Soe4 and delete the surrounding boundaries to see if a smaller regulatory segment could be identified (Figure 4A). Figure 4B shows the resulting relative luciferase values for transiently transfected BSF cells. The previously constructed plasmids were used as a reference. PRO cell transient transfections showed no significant variation in luciferase expression (not shown). In contrast, the BSF cell transient transfections showed the presence of a specific regulatory sequence within the 3′-end of the SoeR4 region, and suggest a 23-bp U-rich section of the MSP-B 3′-UTR is responsible for MSP-B suppression in BSF cells. The sequence is UCGUCUGUUAUUUCUUAGUCCAG (see Figure 2C) where the underlined region resembles an AU-rich element (AURE) found in 3′-UTRs of some mammalian mRNAs (reviewed in [24,25]). To verify the importance of this 23-bp region, it was excised from the MSP-B 3′-UTR using SOE PCR. Transient transfections of BSF cells with this plasmid, called MSP-B(-23), gave luciferase expression levels nearly matching that of the actin IC region and about 40-fold higher than that the full-length MSP-B IC region (Figure 4B). This finding indicates that this 23-bp U-rich region contributes significantly to the suppression of MSP-B in BSF cells.
Fig. 4.

Further deletion analysis of the MSP-B 3′-UTR. (A) Diagram showing additional deletions generated around the Soe4 region to resolve the sequence responsible for the observed differential expression. Soe3,4 and Soe4,5 are deletions across the boundaries of Soe4. SoeL4, SoeC4, and SoeR4 are deletions within the Soe4 region. (B) Bar graph showing the results of transient transfections of BSF cells with the indicated IC constructs. SoeR4, and Soe4, 5 are significantly different when compared to the full length MSP-B IC (n=5). The last (right-most) bar in the graph shows the results of BSF cells transiently transfected with a plasmid in which only a 23-bp segment has been deleted from the full-length MSP-B IC region [MSP-B(-23)]. This MSP-B(-23) luciferase construct showed significant increase (P<0.05) over the full length MSP-B IC construct (n=12).
Next, segment Soe4 of the MSP-B 3′-UTR was used as the entire 3′-UTR of the luciferase gene in the pMP1 plasmid (Figure 5A). As a control, nearly the entire MSP-B 3′-UTR was eliminated from the plasmid, maintaining about 15 bp containing the poly A site and the rest of the MSP-B IC region [pMP4(-)]. Soe4 was placed in both the forward and reverse orientations. Figure 5B shows the luciferase activities of transiently transfected BSF cells bearing these plasmid modifications and demonstrates that the Soe4 region by itself in the forward orientation can suppress the expression level nearly to the level of full-length MSP-B 3′-UTR. Not shown is our observation that when the Soe4 region was placed in triplicate in the forward orientation, suppression was also at nearly the level of the full-length MSP-B 3′-UTR.
Fig. 5.

Luciferase expression and the MSP-B Soe4 region. (A) Diagrams showing plasmid constructs made by first eliminating the 3′-UTR of MSP-B but maintaining the polyadenylation site (vertical arrow) and the remaining IC region [pMP4(-)]. The Soe4 region was then inserted in both the forward (+4) and reverse (+4rev) directions between the luciferase coding sequence and the remaining polyadenylation site and IC region. (B) Bar graph showing luciferase activities in BSF cells transiently transfected with the plasmids described in panel A. Compared to the full-length MSP-B IC region, Soe4+R, pMP4(-), and pMP4(-)+4rev showed significant (P<0.05) increase in luciferase expression (n=8). (C) A portion of a representative predicted secondary structure of the complete 389-nucleotide MSP-B 3′-UTR as determined by the DINAMelt program [39]. The AURE-like region of the 23-nucleotide segment is underlined. The default parameters of the program were used to determine the structure.
A variety of secondary-structure predictions for the entire MSP-B 3′-UTR were performed (mFold and DINAMelt), which suggested that in the most stable conformations at 37°C much of the 23-bp region is likely to be a single-stranded segment flanked by hairpin loops (Figure 5C). This finding is consistent with other AURE-like instability elements reported for at least a few other genes in trypanosomes [26].
Similarities between the central region of the 23-bp U-rich region of the MSP-B 3′-UTR and AURE elements found in some mammalian systems led us to generate several mutations within this AURE-like region in which U residues were replaced with C or G residues via SOE PCR (Figure 6A). These mutations (Mut1, Mut2 and Mut3) were placed within the full-length MSP-B IC region and luciferase activity was measured in transiently transfected BSF cells (Figure 6B). Predicted secondary structures of the mutated 3′-UTRs implied that the overall structure of Mut2 would not have an effect whereas Mut1 and Mut3 showed the generation of small stem loop regions in the AURE-like element (not shown). Despite the predicted secondary-structures, all three had intermediate effects where they neither suppressed luciferase expression to the level caused by the full-length MSP-B 3′-UTR sequence nor relieved suppression to the level seen when the entire 23-bp U-rich region was deleted. Some variability occurred among different sets of assays involving the different 3′-UTR constructs (e.g., MSP-B(-23) in Figures 4B and 6B); however, the patterns of expression remained consistent within each set of assays.
Fig. 6.

Mutation analysis within the 23-nucleotide segment. (A) Sequence of the 23-nt segment within Soe4 region. Mut1, Mut2, and Mut3 represent three different mutated segments within the context of the full length MSP-B 3′-UTR. Dots indicate the mutated positions and the new nucleotides are underlined. (B) Bar graph showing luciferase activity when the indicated MSP-B 3′-UTR constructs were transiently transfected into BSF cells. Asterisks indicate significance when compared to full-length MSP-B 3′-UTR (P<0.05) (n=9).
3.7 Analysis of Polysomes in PRO and BSF cells
To further examine regulation of MSP-B mRNA in PRO and BSF cells, polysomes in cell extracts were fractionated on the basis of their size and RNA prepared from the fractionated samples. Prior to their collection, the cultured cells were incubated for 10-15 minutes with cycloheximide (see Experimental Procedures) to arrest protein synthesis while maintaining the ribosomes on the mRNA [19]. Figure 7A is a representative profile of a polysome separation of a PRO extract where the top of the sucrose gradient contains RNAs not associated with ribosomes (Free RNA) and the gradient contains RNAs present in ribosomes and increasingly larger polysomes as the sucrose density increases down the tube. Fractions (∼1 ml each) were collected and RNA isolated for northern blot analysis. Figure 7B, top panel, shows an agarose gel of the ethidium bromide-stained ribosomal RNAs in each fraction of the PRO extract. As indicated by the profile, the increased numbers of ribosomes on the mRNAs correspond to increased ribosomal RNA. Probing a northern blot of the fractionated PRO RNA with MSP-B and α-tubulin coding sequences (Figure 7B, middle and bottom panels) showed that MSP-B and α-tubulin mRNAs are present in all ribosome and polysome fractions, with increased amounts of both mRNAs in the larger polysome fractions. Figures 7C and E are control experiments showing that addition of EDTA during the cell isolation disrupts the mRNA-ribosome interaction as expected.
Fig. 7.
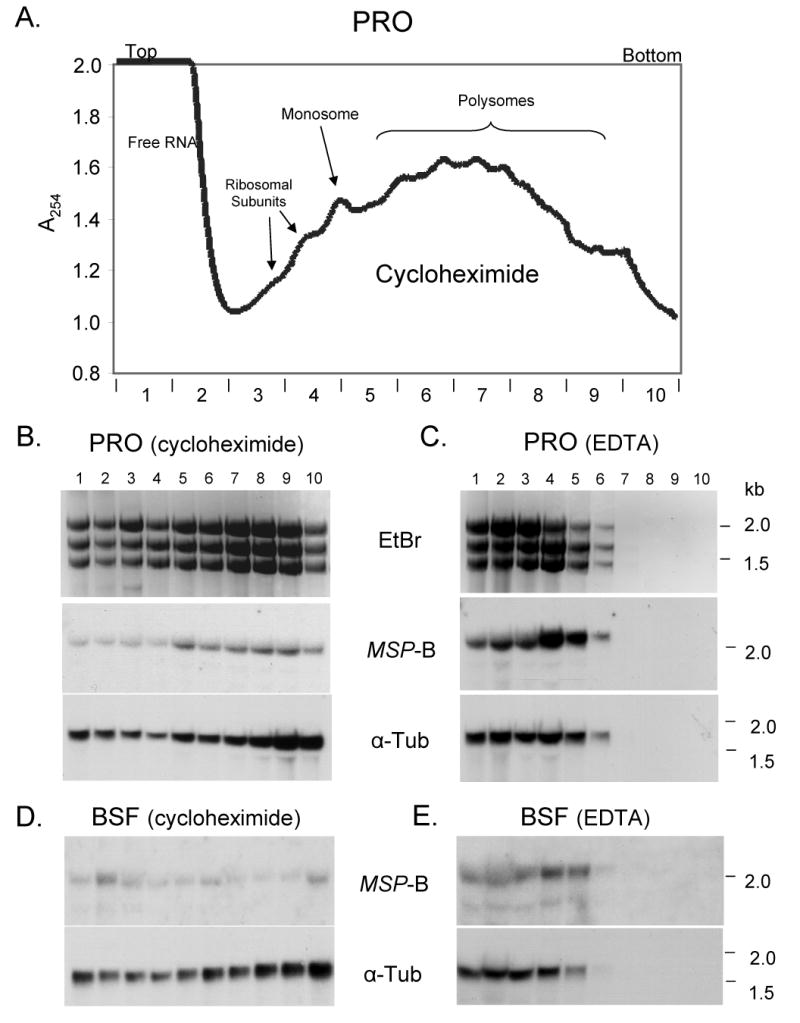
Sucrose gradient separation of polysomes from PRO and BSF cells. (A) Representative profile of the absorbance at 254 nm from a sucrose gradient of an extract of PRO cells. Polysome, monosome, ribosomal subunits, and free RNA peaks are indicated. Ten 1-ml fractions were collected and RNA isolated. Lanes 1-10 are from the 1-ml fractions where 1 is the top of the gradient and 10 is the bottom. (B and C) Northern blot analysis of collected fractions of an extract of PRO cells either incubated with cycloheximide for 10-15 min or resuspended in EDTA (see Materials and Methods). Cycloheximide maintains the ribosomes on the mRNA, whereas EDTA disrupts polyribosome association. The top panels show the EtBr-stained rRNAs, the middle panels show blots probed with MSP-B, and the bottom panels show the same blot re-probed with α-tubulin coding sequence. (D and E) Northern blot analysis of fractions of extracts of similarly treated BSF cells showing (top panels) blots probed with MSP-B and (bottom panels) reprobed with α-tubulin coding sequence.
When polysome fractionations of BSF cell extracts were conducted, the α-tubulin RNA profile was similar to that seen with PRO cells (Figure 7D, bottom panel), but two aspects of the MSP-B RNA profile were different (Figure 7D, top panel). First, the total amount of MSP-B RNA in BSF cells was less (i.e., the signal intensities were less), as expected from the previous northern blot showing that BSF cells have about one-eighth the amount of endogenous MSP-B RNA as PRO cells (Figure 2A). Secondly, in BSF cells more of the MSP-B RNA occurs in fractions near the top of the gradient containing free RNA and monosomes, and less in fractions near the bottom of the gradient containing large polysomes. This difference is depicted in Figure 8A and B. For BSF cells (Figure 8A) about 36% of the total MSP-B RNA occurs in the top three fractions of the gradient, whereas for PRO cells (Figure 8B) only about 18% of the total MSP-B RNA appears in these same three fractions. Likewise, for the BSF cells about 28% of the total MSP-B RNA is in the bottom three fractions and for the PRO cells about 40% is in these bottom fractions. Thus, more of the MSP-B RNA occurs in large polysomes in PRO cells than in BSF cells. By way of comparison, about 60% of the α-tubulin RNA in both PRO cells (Figure 8C) and BSF cells (not shown) is in the bottom three fractions.
Fig. 8.

Percent of total MSP-B RNA or α-tubulin RNA in each polysome fraction (fractions 1-10) from BSF and PRO cells. The intensities of the MSP-B and α-tubulin RNA bands in Figures 7B and D were quantitated by densitometry and are displayed as a percent in each fraction of the 100% total. The α-tubulin RNA profile in PRO cells (panel C) and BSF RNA (not shown) are similar. For BSF MSP-B RNA, n = 3, and for PRO MSP-B and α-tubulin RNAs, n = 4.
A difficulty with evaluating the MSP-B RNA results in PRO cells (Figure 8B) is that fraction 7 of the PRO cells appears abnormally low in MSP-B RNA for unknown reasons. The data of Figure 8B are taken from four sucrose-gradient experiments on independently prepared PRO extracts, one of which is shown in Figure 7B. In the experiment shown, the signal intensity of fraction 7 was not abnormally low, but in the other three experiments it was, which led to the low averaged value for fraction 7 shown in Figure 8B. Although we have no good explanation for the low MSP-B value in fraction 7 of these three experiments, the simplest interpretation is it was an experimental problem with the fraction collection procedure. This interpretation is supported by the observation that PRO α-tubulin RNA is also somewhat low in fraction 7 compared to the flanking fractions (Figure 8C).
4. Discussion
T. brucei MSP-B contributes to the release of VSG from the surface of the parasite during differentiation from BSF to PCF [3]. Our results presented here show that differential expression of this MSP is regulated by a specific sequence element in the 3′UTR of its mRNA. The center portion of this 23-nucleotide, U-rich, regulatory sequence bears a resemblance to the destabilizing AUREs found in the 3′-UTRs of many mammalian mRNAs (reviewed in [24,25,27]), but it does not include the consensus AUUUA motif [27]. Elimination of this 23-nucleotide region from the MSP-B 3′-UTR in the luciferase reporter system used here relieved most of the 3′-UTR's suppressive effects in BSF cells. However, multiple point mutations within the central AURE-like region only partially relieved the suppression (Figure 6), suggesting that the entire 23-nucleotide region is important for the regulatory effect. It is also interesting to note that this 23-bp region is not the only, or even the most, U-rich region in the 389-nucleotide 3′-UTR, which itself is comprised of 37% U residues (Figure 2C). Furthermore, a consensus AURE element, AUUUA, does occur in the Soe6 region of this 3′-UTR, but appears to have no or minimal regulatory effect.
AUREs are among the most investigated RNA instability determinants characterized in mammalian cells. These sequence elements facilitate the binding of cellular proteins that either directly or indirectly degrade or stabilize AURE-bearing mRNAs. Many AU-rich binding proteins (AUBPs) are regulated by intracellular signaling and interacting pathways. For example, a well studied family of AUBPs are the mammalian homologs of embryonic lethal abnormal vision (ELAV) proteins first described in Drosophila [28,29]. In particular, the human ELAV-like protein, HuR, is ubiquitously expressed and predominately nuclear in location but shuttles between the cytoplasm and nucleus via a shuttling sequence that contains both nuclear export and import elements [30-33]. Although the process remains poorly understood, upon activation of a HuR ribonucleoprotein (RNP) complex HuR specifically interacts with AURE-containing mRNAs in the nucleus and transports them to the cytoplasm, increasing the AURE-mRNA half-life. Expression of recombinant HuR in T. brucei stabilized the mRNAs of several AURE-containing genes, including EP, PGK and PPDK [26], but its effect on MSP-B was not examined in this study.
The secondary structures of UTRs are sometimes critical in determining mRNA abundance, such as the 16mer stem-loop of the 3′-UTR of procyclin mRNA [11,34,35], the iron responsive element in the 5′-UTR of mammalian ferritin mRNA and the 3′-UTR of transferrin receptor mRNA (discussed in [36,37]). When potential secondary structures of the MSP-B 3′-UTR were analyzed using both the mFold analysis program [38] and DINAMelt [39], the AURE-like element in the MSP-B 3′-UTR was most often found in an unstructured or single-stranded state (Figure 5C). Similar predicted single-stranded U-rich regions have been identified in the 3′-UTRs of the T. brucei genes encoding EP-procyclin [35], PGKB and PPDK [26]. In each of these cases the corresponding mRNA is low abundance in BSF cells and its abundance could be increased by the expression of recombinant HuR, which binds specifically to single stranded U-rich RNA [24,26]. The U-rich sequence described here is also similar to an AURE-like element found in the developmentally regulated mucin mRNA in Trypanosoma cruzi [40]. The similarities between these correspondingly regulated genes of T. brucei and T. cruzi suggest that an AURE-mediated type of degradation is generally important in trypanosome differentiation and could be necessary to abruptly alter gene expression.
It is also worth noting that the MSP-B 3′-UTR structures predicted to be the most stable at 37°C (Figure 5C), have less secondary structure than the structures predicted to be most stable at 25°C. At 25°C the AURE-like element in the MSP-B 3′-UTR is more likely to be part of a double-stranded stem (not shown). Thus, the decreased secondary structure stability of this 3′-UTR at 37°C, which is the in vivo temperature of BSF trypanosomes, may play a role in the ability of the AURE-like element to regulate expression.
One caveat to the apparent AURE-like element in the MSP-B 3′-UTR is the observation that replacing multiple nucleotides in this element had only an intermediate effect on luciferase activity values (Figure 6). In an effort to refute the possibility that MSP-B mRNA abundance regulated through this element may not depend on sequence specificity as much as context, the Soe4 segment alone was tested as the complete 3′-UTR (Figure 5A). Taken out of context, the ability of Soe4 to suppress expression of the reporter gene was still detected.
RNA binding proteins have been described in T. brucei and other related kinetoplastids. A PUF-like family of sequence-specific RNA-binding proteins has been described in both T. cruzi [41] and T. brucei [42]. Although genes for ten PUF protein family members have been detected so far in T. brucei, no in vivo regulatory targets have been identified. T. cruzi RNA AURE elements have been shown to bind an RNA-recognition motif (RRM)-type RNA binding protein, which can alter the half-lives of the RNAs [43]. Two of these T. cruzi U-rich binding proteins (UBP), UBP1 and UBP2, were shown to be in a complex with the poly(A)-binding protein on the 3′-UTR of the mucin antigens of T. cruzi [44]. Two known T. brucei RNA binding proteins, NRBD1 and NRBD2, are involved in the import and/or assembly pathway of 5S rRNA during ribosome biogenesis [45]. Our efforts to demonstrate specific protein binding to the 23-nucleotide region of the MSP-B 3′-UTR were not successful (not shown).
Polysome isolations provide an alternative way to examine the state of the mRNA in the different cell stages. As expected, polysome analysis of PRO extracts showed that MSP-B mRNA occurs predominately in the intermediate and large polysome fractions and is present to some extent in all fractions (Figures 7B and 8B). This profile of PRO MSP-B mRNA in the polysome isolation fractions was consistent with that of α-tubulin mRNA, a highly expressed mRNA. Somewhat unexpectedly, the BSF analysis showed that BSF MSP-B mRNA can also be detected in all fractions of the polysome isolation (Figures 7D and 8A), though at a reduced level in the intermediate polysome fractions. Whereas PRO MSP-B mRNA is most abundant in the intermediate and large polysome fractions, BSF MSP-B mRNA is most abundant in the “free” or unassociated RNA fractions (Figure 8A and B).
The presence of some BSF MSP-B mRNA in the polysome-containing fractions implies, but does not prove, that translation is occurring. An alternative possibility is that in BSF cells MSP-B mRNA is in non-ribosomal complexes such as P-bodies or stress granules, which are aggregates of non-translating mRNA and non-ribosomal proteins (mRNPs), where the mRNA can be either degraded or stored for possible future association with polysomes [46-48]. Thus, a small pool of MSP-B mRNA important for differentiation may be maintained in a non-translated manner similar to that of maternal mRNAs found in oocytes of other systems (reviewed in [49]). In preliminary experiments (not shown) to examine this possibility, BSF trypanosomes were incubated with puromycin prior to collection and lysis of the cells. Puromycin inhibits peptidyl transfer and dislodges the ribosomes from the mRNA. The incubation with puromycin diminished the percentage of α-tubulin mRNA in the intermediate and large polysome fractions as expected (not shown), but had little effect on the overall MSP-B mRNA profile, which remained similar to that shown in Figure 7D. This result is consistent the possibility that in BSF cells, at least some of the non-free MSP-B mRNA is sequestered in a P-body-like complex. Although this complex was not characterized further, its possible presence serves as a starting point for future studies. Non-translated MSP-B mRNA in BSF cells may be maintained in preparation for its rapid translation and the subsequent deployment of MSP-B protein in the event of differentiation. The ability to rapidly adapt to a new environment by increasing translation of pre-existing mRNAs might increase transmissibility and thus survival of the parasite.
In conclusion, the results presented here show that MSP-A, -B and -C are differentially regulated by their 3′-UTRs and a 23-bp U-rich segment in the MSP-B 3′-UTR exerts a strong effect in suppressing expression of MSP-B protein in BSF cells. The post-transcriptional mechanism of MSP-B suppression is complex and involves a combination of mRNA stability, ribosomal association with the mRNA and possibly other translational mechanisms.
Acknowledgments
This work was supported by NIH grants R01 AI059451 and T32 007511.
Abbreviations
- BSF
bloodstream form
- PRO
procyclic form
- VSG
variant surface glycoprotein
- IC
intercoding region
- UTR
untranslated region
- SOE PCR
spliced overlap extension polymerase chain reaction
- AURE
AU-rich element
Footnotes
Publisher's Disclaimer: This is a PDF file of an unedited manuscript that has been accepted for publication. As a service to our customers we are providing this early version of the manuscript. The manuscript will undergo copyediting, typesetting, and review of the resulting proof before it is published in its final citable form. Please note that during the production process errors may be discovered which could affect the content, and all legal disclaimers that apply to the journal pertain.
References
- 1.Pays E. The variant surface glycoprotein as a tool for adaptation in African trypanosomes. Microbes Infect. 2006;8:930–7. doi: 10.1016/j.micinf.2005.10.002. [DOI] [PubMed] [Google Scholar]
- 2.El-Sayed NM, Donelson JE. African trypanosomes have differentially expressed genes encoding homologues of the Leishmania GP63 surface protease. J Biol Chem. 1997;272:26742–8. doi: 10.1074/jbc.272.42.26742. [DOI] [PubMed] [Google Scholar]
- 3.Grandgenett PM, Otsu K, Wilson HR, Wilson ME, Donelson JE. A Function for a Specific Zinc Metalloprotease of African Trypanosomes. PLoS Pathog. 2007;3:e150. doi: 10.1371/journal.ppat.0030150. [DOI] [PMC free article] [PubMed] [Google Scholar]
- 4.Coughlin BC, Teixeira SM, Kirchhoff LV, Donelson JE. Amastin mRNA abundance in Trypanosoma cruzi is controlled by a 3′-untranslated region position-dependent cis-element and an untranslated region-binding protein. J Biol Chem. 2000;275:12051–60. doi: 10.1074/jbc.275.16.12051. [DOI] [PubMed] [Google Scholar]
- 5.Clayton C, Shapira M. Post-transcriptional regulation of gene expression in trypanosomes and leishmanias. Mol Biochem Parasitol. 2007;156:93–101. doi: 10.1016/j.molbiopara.2007.07.007. [DOI] [PubMed] [Google Scholar]
- 6.Clayton CE. Life without transcriptional control? From fly to man and back again. Embo J. 2002;21:1881–8. doi: 10.1093/emboj/21.8.1881. [DOI] [PMC free article] [PubMed] [Google Scholar]
- 7.Benz C, Nilsson D, Andersson B, Clayton C, Guilbride DL. Messenger RNA processing sites in Trypanosoma brucei. Mol Biochem Parasitol. 2005;143:125–34. doi: 10.1016/j.molbiopara.2005.05.008. [DOI] [PubMed] [Google Scholar]
- 8.Blattner J, Clayton CE. The 3′-untranslated regions from the Trypanosoma brucei phosphoglycerate kinase-encoding genes mediate developmental regulation. Gene. 1995;162:153–6. doi: 10.1016/0378-1119(95)00366-e. [DOI] [PubMed] [Google Scholar]
- 9.Brittingham A, Miller MA, Donelson JE, Wilson ME. Regulation of GP63 mRNA stability in promastigotes of virulent and attenuated Leishmania chagasi. Mol Biochem Parasitol. 2001;112:51–9. doi: 10.1016/s0166-6851(00)00346-7. [DOI] [PubMed] [Google Scholar]
- 10.Furger A, Schurch N, Kurath U, Roditi I. Elements in the 3′ untranslated region of procyclin mRNA regulate expression in insect forms of Trypanosoma brucei by modulating RNA stability and translation. Mol Cell Biol. 1997;17:4372–80. doi: 10.1128/mcb.17.8.4372. [DOI] [PMC free article] [PubMed] [Google Scholar]
- 11.Hotz HR, Hartmann C, Huober K, Hug M, Clayton C. Mechanisms of developmental regulation in Trypanosoma brucei: a polypyrimidine tract in the 3′-untranslated region of a surface protein mRNA affects RNA abundance and translation. Nucleic Acids Res. 1997;25:3017–26. doi: 10.1093/nar/25.15.3017. [DOI] [PMC free article] [PubMed] [Google Scholar]
- 12.Gibson WC, Swinkels BW, Borst P. Post-transcriptional control of the differential expression of phosphoglycerate kinase genes in Trypanosoma brucei. J Mol Biol. 1988;201:315–25. doi: 10.1016/0022-2836(88)90140-4. [DOI] [PubMed] [Google Scholar]
- 13.Hirumi H, Hirumi K, Doyle JJ, Cross GA. In vitro cloning of animal-infective bloodstream forms of Trypanosoma brucei. Parasitology. 1980;80:371–82. doi: 10.1017/s0031182000000822. [DOI] [PubMed] [Google Scholar]
- 14.LaCount DJ, Barrett B, Donelson JE. Trypanosoma brucei FLA1 is required for flagellum attachment and cytokinesis. J Biol Chem. 2002;277:17580–8. doi: 10.1074/jbc.M200873200. [DOI] [PubMed] [Google Scholar]
- 15.de Wet JR, Wood KV, Helinski DR, DeLuca M. Cloning of firefly luciferase cDNA and the expression of active luciferase in Escherichia coli. Proc Natl Acad Sci U S A. 1985;82:7870–3. doi: 10.1073/pnas.82.23.7870. [DOI] [PMC free article] [PubMed] [Google Scholar]
- 16.Matthews JC, Hori K, Cormier MJ. Purification and properties of Renilla reniformis luciferase. Biochemistry. 1977;16:85–91. doi: 10.1021/bi00620a014. [DOI] [PubMed] [Google Scholar]
- 17.Horton RM, Hunt HD, Ho SN, Pullen JK, Pease LR. Engineering hybrid genes without the use of restriction enzymes: gene splicing by overlap extension. Gene. 1989;77:61–8. doi: 10.1016/0378-1119(89)90359-4. [DOI] [PubMed] [Google Scholar]
- 18.Ho SN, Hunt HD, Horton RM, Pullen JK, Pease LR. Site-directed mutagenesis by overlap extension using the polymerase chain reaction. Gene. 1989;77:51–9. doi: 10.1016/0378-1119(89)90358-2. [DOI] [PubMed] [Google Scholar]
- 19.Brecht M, Parsons M. Changes in polysome profiles accompany trypanosome development. Mol Biochem Parasitol. 1998;97:189–98. doi: 10.1016/s0166-6851(98)00151-0. [DOI] [PubMed] [Google Scholar]
- 20.LaCount DJ, El-Sayed NM, Kaul S, Wanless D, Turner CM, Donelson JE. Analysis of a donor gene region for a variant surface glycoprotein and its expression site in African trypanosomes. Nucleic Acids Res. 2001;29:2012–9. doi: 10.1093/nar/29.10.2012. [DOI] [PMC free article] [PubMed] [Google Scholar]
- 21.LaCount DJ, Gruszynski AE, Grandgenett PM, Bangs JD, Donelson JE. Expression and function of the Trypanosoma brucei major surface protease (GP63) genes. J Biol Chem. 2003;278:24658–64. doi: 10.1074/jbc.M301451200. [DOI] [PubMed] [Google Scholar]
- 22.Biebinger S, Rettenmaier S, Flaspohler J, Hartmann C, Pena-Diaz J, Wirtz LE, Hotz HR, Barry JD, Clayton C. The PARP promoter of Trypanosoma brucei is developmentally regulated in a chromosomal context. Nucleic Acids Res. 1996;24:1202–11. doi: 10.1093/nar/24.7.1202. [DOI] [PMC free article] [PubMed] [Google Scholar]
- 23.Helm JR, Wilson ME, Donelson JE. Different trans RNA splicing events in bloodstream and procyclic Trypanosoma brucei. Mol Biochem Parasitol. 2008;159:134–7. doi: 10.1016/j.molbiopara.2008.02.006. [DOI] [PMC free article] [PubMed] [Google Scholar]
- 24.Mitchell P, Tollervey D. mRNA stability in eukaryotes. Curr Opin Genet Dev. 2000;10:193–8. doi: 10.1016/s0959-437x(00)00063-0. [DOI] [PubMed] [Google Scholar]
- 25.Khabar KS. The AU-rich transcriptome: more than interferons and cytokines, and its role in disease. J Interferon Cytokine Res. 2005;25:1–10. doi: 10.1089/jir.2005.25.1. [DOI] [PubMed] [Google Scholar]
- 26.Quijada L, Guerra-Giraldez C, Drozdz M, Hartmann C, Irmer H, Ben-Dov C, Cristodero M, Ding M, Clayton C. Expression of the human RNA-binding protein HuR in Trypanosoma brucei increases the abundance of mRNAs containing AU-rich regulatory elements. Nucleic Acids Res. 2002;30:4414–24. doi: 10.1093/nar/gkf577. [DOI] [PMC free article] [PubMed] [Google Scholar]
- 27.Chen CY, Shyu AB. AU-rich elements: characterization and importance in mRNA degradation. Trends Biochem Sci. 1995;20:465–70. doi: 10.1016/s0968-0004(00)89102-1. [DOI] [PubMed] [Google Scholar]
- 28.Robinow S, Campos AR, Yao KM, White K. The elav gene product of Drosophila, required in neurons, has three RNP consensus motifs. Science. 1988;242:1570–2. doi: 10.1126/science.3144044. [DOI] [PubMed] [Google Scholar]
- 29.Robinow S, White K. Characterization and spatial distribution of the ELAV protein during Drosophila melanogaster development. J Neurobiol. 1991;22:443–61. doi: 10.1002/neu.480220503. [DOI] [PubMed] [Google Scholar]
- 30.Fan XC, Steitz JA. Overexpression of HuR, a nuclear-cytoplasmic shuttling protein, increases the in vivo stability of ARE-containing mRNAs. Embo J. 1998;17:3448–60. doi: 10.1093/emboj/17.12.3448. [DOI] [PMC free article] [PubMed] [Google Scholar]
- 31.Peng SS, Chen CY, Xu N, Shyu AB. RNA stabilization by the AU-rich element binding protein, HuR, an ELAV protein. Embo J. 1998;17:3461–70. doi: 10.1093/emboj/17.12.3461. [DOI] [PMC free article] [PubMed] [Google Scholar]
- 32.Keene JD. Why is Hu where? Shuttling of early-response-gene messenger RNA subsets. Proc Natl Acad Sci U S A. 1999;96:5–7. doi: 10.1073/pnas.96.1.5. [DOI] [PMC free article] [PubMed] [Google Scholar]
- 33.Dormoy-Raclet V, Menard I, Clair E, Kurban G, Mazroui R, Di Marco S, von Roretz C, Pause A, Gallouzi IE. The RNA-binding protein HuR promotes cell migration and cell invasion by stabilizing the {beta}-actin mRNA in a U-rich-element-dependent manner. Mol Cell Biol. 2007 doi: 10.1128/MCB.00113-07. [DOI] [PMC free article] [PubMed] [Google Scholar]
- 34.Irmer H, Clayton C. Degradation of the unstable EP1 mRNA in Trypanosoma brucei involves initial destruction of the 3′-untranslated region. Nucleic Acids Res. 2001;29:4707–15. doi: 10.1093/nar/29.22.4707. [DOI] [PMC free article] [PubMed] [Google Scholar]
- 35.Drozdz M, Clayton C. Structure of a regulatory 3′ untranslated region from Trypanosoma brucei. Rna. 1999;5:1632–44. doi: 10.1017/s1355838299990623. [DOI] [PMC free article] [PubMed] [Google Scholar]
- 36.Klausner RD, Rouault TA, Harford JB. Regulating the fate of mRNA: the control of cellular iron metabolism. Cell. 1993;72:19–28. doi: 10.1016/0092-8674(93)90046-s. [DOI] [PubMed] [Google Scholar]
- 37.Laing LG, Hall KB. A model of the iron responsive element RNA hairpin loop structure determined from NMR and thermodynamic data. Biochemistry. 1996;35:13586–96. doi: 10.1021/bi961310q. [DOI] [PubMed] [Google Scholar]
- 38.Zuker M, Jaeger JA, Turner DH. A comparison of optimal and suboptimal RNA secondary structures predicted by free energy minimization with structures determined by phylogenetic comparison. Nucleic Acids Res. 1991;19:2707–14. doi: 10.1093/nar/19.10.2707. [DOI] [PMC free article] [PubMed] [Google Scholar]
- 39.Markham NR, Zuker M. DINAMelt web server for nucleic acid melting prediction. Nucleic Acids Res. 2005;33:W577–81. doi: 10.1093/nar/gki591. [DOI] [PMC free article] [PubMed] [Google Scholar]
- 40.Di Noia JM, D'Orso I, Sanchez DO, Frasch AC. AU-rich elements in the 3′-untranslated region of a new mucin-type gene family of Trypanosoma cruzi confers mRNA instability and modulates translation efficiency. J Biol Chem. 2000;275:10218–27. doi: 10.1074/jbc.275.14.10218. [DOI] [PubMed] [Google Scholar]
- 41.Caro F, Bercovich N, Atorrasagasti C, Levin MJ, Vazquez MP. Trypanosoma cruzi: analysis of the complete PUF RNA-binding protein family. Exp Parasitol. 2006;113:112–24. doi: 10.1016/j.exppara.2005.12.015. [DOI] [PubMed] [Google Scholar]
- 42.Luu VD, Brems S, Hoheisel JD, Burchmore R, Guilbride DL, Clayton C. Functional analysis of Trypanosoma brucei PUF1. Mol Biochem Parasitol. 2006;150:340–9. doi: 10.1016/j.molbiopara.2006.09.007. [DOI] [PubMed] [Google Scholar]
- 43.D'Orso I, Frasch AC. TcUBP-1, a developmentally regulated U-rich RNA-binding protein involved in selective mRNA destabilization in trypanosomes. J Biol Chem. 2001;276:34801–9. doi: 10.1074/jbc.M102120200. [DOI] [PubMed] [Google Scholar]
- 44.D'Orso I, Frasch AC. TcUBP-1, an mRNA destabilizing factor from trypanosomes, homodimerizes and interacts with novel AU-rich element- and Poly(A)-binding proteins forming a ribonucleoprotein complex. J Biol Chem. 2002;277:50520–8. doi: 10.1074/jbc.M209092200. [DOI] [PubMed] [Google Scholar]
- 45.Pitula JS, Park J, Parsons M, Ruyechan WT, Williams N. Two families of RNA binding proteins from Trypanosoma brucei associate in a direct protein-protein interaction. Mol Biochem Parasitol. 2002;122:81–9. doi: 10.1016/s0166-6851(02)00076-2. [DOI] [PubMed] [Google Scholar]
- 46.Zamore PD, Haley B. Ribo-gnome: the big world of small RNAs. Science. 2005;309:1519–24. doi: 10.1126/science.1111444. [DOI] [PubMed] [Google Scholar]
- 47.Ambros V. The functions of animal microRNAs. Nature. 2004;431:350–5. doi: 10.1038/nature02871. [DOI] [PubMed] [Google Scholar]
- 48.Cassola A, De Gaudenzi JG, Frasch AC. Recruitment of mRNAs to cytoplasmic ribonucleoprotein granules in trypanosomes. Mol Microbiol. 2007;65:655–70. doi: 10.1111/j.1365-2958.2007.05833.x. [DOI] [PubMed] [Google Scholar]
- 49.Stitzel ML, Seydoux G. Regulation of the oocyte-to-zygote transition. Science. 2007;316:407–8. doi: 10.1126/science.1138236. [DOI] [PubMed] [Google Scholar]