

Abstract
How can the central nervous system make accurate decisions about external stimuli at short times on the basis of the noisy responses of nerve cell populations? It has been suggested that spike time latency is the source of fast decisions. Here, we propose a simple and fast readout mechanism, the temporal Winner-Take-All (tWTA), and undertake a study of its accuracy. The tWTA is studied in the framework of a statistical model for the dynamic response of a nerve cell population to an external stimulus. Each cell is characterized by a preferred stimulus, a unique value of the external stimulus for which it responds fastest. The tWTA estimate for the stimulus is the preferred stimulus of the cell that fired the first spike in the entire population. We then pose the questions: How accurate is the tWTA readout? What are the parameters that govern this accuracy? What are the effects of noise correlations and baseline firing? We find that tWTA sensitivity to the stimulus grows algebraically fast with the number of cells in the population, N, in contrast to the logarithmic slow scaling of the conventional rate-WTA sensitivity with N. Noise correlations in first-spike times of different cells can limit the accuracy of the tWTA readout, even in the limit of large N, similar to the effect that has been observed in population coding theory. We show that baseline firing also has a detrimental effect on tWTA accuracy. We suggest a generalization of the tWTA, the n-tWTA, which estimates the stimulus by the identity of the group of cells firing the first n spikes and show how this simple generalization can overcome the detrimental effect of baseline firing. Thus, the tWTA can provide fast and accurate responses discriminating between a small number of alternatives. High accuracy in estimation of a continuous stimulus can be obtained using the n-tWTA.
Author Summary
Considerable experimental as well as theoretical effort has been devoted to the investigation of the neural code. The traditional approach has been to study the information content of the total neural spike count during a long period of time. However, in many cases, the central nervous system is required to estimate the external stimulus at much shorter times. What readout mechanism could account for such fast decisions? We suggest a readout mechanism that estimates the external stimulus by the first spike in the population, the tWTA. We show that the tWTA can account for accurate discriminations between a small number of choices. We find that the accuracy of the tWTA is limited by the neuronal baseline firing. We further find that, due to baseline firing, the single first spike does not encode sufficient information for estimating a continuous variable, such as the direction of motion of a visual stimulus, with fine resolution. In such cases, fast and accurate decisions can be obtained by a generalization of the tWTA to a readout that estimates the stimulus by the first n spikes fire by the population, where n is larger than the mean number of baseline spikes in the population.
Introduction
In recent years, there has been growing interest in coding information about external stimuli by the fine temporal structure of the neural dynamic response [1]–[18]. Several studies have shown that response latency is modulated by external stimuli [1]–[4]. Many cells in the middle temporal (MT) cortex code for the direction of motion of visual stimuli, and can be characterized by a preferred direction of the stimulus, to which they respond maximally, see e.g., [19],[20]. Osborne et al. [1] reported that the MT cells respond with the shortest delay when the stimulus is in their preferred direction and that the response delay increases as the stimulus direction diverges from the preferred direction of the cell. In the auditory system of the ferret, Nelken et al. [2] showed response-latency tuning in primary auditory cortex cells to the direction of a virtual sound source. In a recent work Gollisch and Meister [18] showed that relative first-spike times of retinal ganglion cells carry considerable information about the external stimulus, but they did not suggest a concrete readout mechanism.
Here we study the accuracy of a simple readout mechanism, the temporal-Winner-Take-All (tWTA), which extracts information from response latency. The tWTA estimates the stimulus by the identity of the cell that fired the first spike in a population of cells, in contrast to the conventional rate-Winner-Take-All (WTA), which estimates the stimulus by the identity of the cell that fired the most spikes. For example, the tWTA estimate for the direction of motion of a visual stimulus from the responses of a population of MT cells would be the preferred direction of the cell that fired the first spike in the entire population.
Considerable theoretical effort has been devoted to the study of the accuracy of population code readout mechanisms, such as the population-vector, optimal-linear and ideal observer readouts. Of particular interest in the investigation of these readouts was the dependence of the readout accuracy on the population size and the effects of noise correlations in the neuronal responses. In this work, we quantify tWTA accuracy. To this end, we address three specific questions. One, what are the essential features of the neuronal dynamic response to the stimulus to which the tWTA is sensitive? Two, how does the tWTA accuracy depend on the population size? Three, what are the effects of noise correlations and baseline firing on tWTA accuracy?
These questions are addressed in the framework of a statistical model for the dynamic response of MT cells to a moving visual stimulus. In the first part of the results section we investigate tWTA accuracy in a two-column competition model, and in the second part we study tWTA accuracy in the framework of a hypercolumn model. Both parts start by defining the statistical model of the neuronal dynamic response and then follow with an investigation of tWTA accuracy in the absence of noise correlations and baseline firing. In the final stage of each part, correlations and baseline firing are introduced and their effect on tWTA accuracy is investigated.
Results
tWTA Readout Accuracy in a Two Competing Columns Model
The model
We study tWTA accuracy in a model of two competing MT columns coding for the
direction of motion of visual stimuli. Each column is comprised of  homogeneous cells. We denote the preferred direction of
the cells in column 1 by
homogeneous cells. We denote the preferred direction of
the cells in column 1 by  and the preferred direction of the cells in column 2 by
  . Without loss of generality, we take
  , which is equivalent to measuring all angles with respect
to
, which is equivalent to measuring all angles with respect
to  . We denote the probability density of a single cell
  (
( ) in column
  with preferred direction
  to fire its first spike at time
  given that stimulus
  was presented at time
  by
by  . Assuming that first-spike times are statistically
independent, the probability density of the first spike in the entire column
. Assuming that first-spike times are statistically
independent, the probability density of the first spike in the entire column  at time
  is given by the product of three terms: the probability
density of a specific cell to fire its first at time
is given by the product of three terms: the probability
density of a specific cell to fire its first at time  ,
,  , the probability that that the first spike times of the
rest
, the probability that that the first spike times of the
rest  cells in the population occurred after time
t,
cells in the population occurred after time
t,  , and the
  different possibilities of choosing the cell that fired
the first spike:
different possibilities of choosing the cell that fired
the first spike:
| (1) |
| (2) |
The function  is the logarithm of the probability of a single cell
firing its first spike after time
is the logarithm of the probability of a single cell
firing its first spike after time  , and it has the following properties:
  ,
,  and
and  . Equation (1) can also be obtained by taking the
derivative of the probability that the first spike in the column occurred
after time
. Equation (1) can also be obtained by taking the
derivative of the probability that the first spike in the column occurred
after time  :
:  , with respect to first spike time,
  .
.
Throughout this section, we will quantify tWTA accuracy by using the two
alternative forced choice (2AFC) paradigm. In a 2AFC discrimination task,
the system is given a stimulus, either  or
or  , randomly with equal probabilities. Presentation of the
stimulus generates a population response in the two columns,
, randomly with equal probabilities. Presentation of the
stimulus generates a population response in the two columns,  and
and  , which are distributed as defined above. The task of the
readout is to infer, on the basis of these spike times, whether the stimulus
was
, which are distributed as defined above. The task of the
readout is to infer, on the basis of these spike times, whether the stimulus
was  or
or  . We will use the probability of correct discrimination,
  , and the error rate,
  , as measures of the tWTA performance. We will use the term
sensitivity to designate the inverse of the stimulus
difference,
, as measures of the tWTA performance. We will use the term
sensitivity to designate the inverse of the stimulus
difference,  , at which
  crosses a certain threshold,
  . This latter measure is related to the
‘just noticeable difference’ used
in psychophysics.
. This latter measure is related to the
‘just noticeable difference’ used
in psychophysics.
tWTA accuracy in the absence of correlations
Assuming that column 1 responds faster to a stimulus in direction  than column 2 and vice versa for stimulus
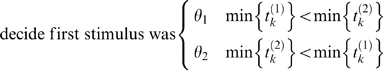
  , we define the tWTA readout in the 2AFC task as follows:
 |
(3) |
For the sake of convenience, we take  and
and  . This choice equalizes the probability of correct response
given stimulus
. This choice equalizes the probability of correct response
given stimulus  and given stimulus
  . The probability of correct response,
  , is given by the probability that population 1 fired the
first spike, given stimulus
, is given by the probability that population 1 fired the
first spike, given stimulus  . Thus,
  can be written as the integration over all possible
first-spike times,
can be written as the integration over all possible
first-spike times,  , of the probability density that population 1 fired its
first spike at time
, of the probability density that population 1 fired its
first spike at time  multiplied by the probability that the first spike time of
population 2 is large than
multiplied by the probability that the first spike time of
population 2 is large than  :
:
| (4) |
In the limit of large populations,  , the integral in the right-hand-side of equation (4) will
be dominated by the region in which the exponent obtains its maximum. Since
, the integral in the right-hand-side of equation (4) will
be dominated by the region in which the exponent obtains its maximum. Since  is a monotonically decreasing function of
  , this region is the region of small
  . For small
  , we approximate
  by:
by:
| (5) |
where  is the scale parameter,
  is the shape parameter,
  is the delay parameter and
  for
for  and 0 otherwise.
Relation to the peri stimulus time histogram (PSTH) in an inhomogeneous Poisson process (IHPP)
The IHPP is widely used to model the stochastic nature of the neural temporal
response [21],[22] and is fully
defined by the PSTH. In the context of first spike-time distribution, the
choice of an IHPP model does not limit the generality of the model, since
every PSTH,  , of an IHPP could be mapped to first spike time
distribution,
, of an IHPP could be mapped to first spike time
distribution,  , and vice versa. For a given IHPP with PSTH,
  , the first spike time distribution is given by (see e.g.,
[21],[22])
, the first spike time distribution is given by (see e.g.,
[21],[22])
| (6) |
In the other direction, we want to obtain the PSTH,  , that will yield a specific first spike time distribution,
  , in an IHPP model. The probability density that the first
spike has occurred in time
, in an IHPP model. The probability density that the first
spike has occurred in time  in an IHPP model, can be written as the product of the
probability density of spiking at that time,
in an IHPP model, can be written as the product of the
probability density of spiking at that time,  , multiplied by the probability that there were no prior
spikes,
, multiplied by the probability that there were no prior
spikes,  ; hence,
  . Thus we obtain the reciprocal relation
| (7) |
which could be verified by substituting equation (7) into
equation (6). For small  :
:  . Thus, the scale parameter corresponds to the scale of the
PSTH, the shape parameter governs the initial acceleration of the PSTH, and
the delay parameter measures the temporal shift of the PSTH. Figure 1 illustrates how
the different parameters that characterize the initial neural response:
scale, shape and delay, affect the first spike probability density and the
corresponding PSTH. Note that whereas
. Thus, the scale parameter corresponds to the scale of the
PSTH, the shape parameter governs the initial acceleration of the PSTH, and
the delay parameter measures the temporal shift of the PSTH. Figure 1 illustrates how
the different parameters that characterize the initial neural response:
scale, shape and delay, affect the first spike probability density and the
corresponding PSTH. Note that whereas  and
and  are very similar for small
  , for large
  ,
,  decays to zero while
  may continue to increase. Below we study the different
effects of the tuning of these parameters on the accuracy of the tWTA.
may continue to increase. Below we study the different
effects of the tuning of these parameters on the accuracy of the tWTA.
Figure 1. Three examples showing the effects of the scale parameter (a,b),
the shape parameter (c,d), and the delay parameter (e,f) on the
first spike time probability density,  , (left column) and the PSTH rate,
  , of a corresponding inhomogeneous Poisson process
(right column).
, of a corresponding inhomogeneous Poisson process
(right column).

The PSTHs were taken to be of the form of  (compare with equation 5), and
  is obtained via the relation of equation (6). The
parameters used to generate the plots are as follows. For a and b:
is obtained via the relation of equation (6). The
parameters used to generate the plots are as follows. For a and b:  ,
,  , and
, and  as appears on the figure. For (c,d):
  ,
,  , and
, and  as appears on the figure. For (e,f):
  ,
,  , and
, and  as appears on the figure.
Effect of scale parameter tuning
We first consider a simple model in which the scale is the only parameter
that is tuned to the stimulus. In this case, we can write  near
near  as the product of a function of the stimulus and a
function of time:
as the product of a function of the stimulus and a
function of time:
| (8) |
where  is independent of
  . Expanding
  in small
  ,
,  and substituting in equation (4), we obtain to a leading
order in
and substituting in equation (4), we obtain to a leading
order in 
 |
(9) |
Hence, in this case, the probability of correct response is
at chance level,  , when the neural response has the same scale for the two
alternatives,
, when the neural response has the same scale for the two
alternatives,  , and increases monotonically in the ratio
  . The accuracy of the tWTA is not improved by increasing
  : The same accuracy will be obtained with
  and
and  cells, but, somewhat faster for the
  case. Figure
2a shows the probability of correct discrimination as a function
of
case. Figure
2a shows the probability of correct discrimination as a function
of  for different values of
  from top to bottom. The open circles are estimates of the
tWTA accuracy obtained by averaging the tWTA accuracy over 106
realizations of the neural stochastic response. The dashed line shows the
analytical prediction of equation 9 with
from top to bottom. The open circles are estimates of the
tWTA accuracy obtained by averaging the tWTA accuracy over 106
realizations of the neural stochastic response. The dashed line shows the
analytical prediction of equation 9 with  .
.
Figure 2. tWTA performance in a 2AFC discrimination task between stimulus
0° and  in a two-column model as function of the number of
cells in the population.
in a two-column model as function of the number of
cells in the population.

Open symbols show numerical estimation of the tWTA performance as
obtained by averaging the probability of correct discrimination over
106 realizations of the stochastic neural responses.
Probability distribution of first spike times followed an IHPP with
the following PSTHs. (a) Scale parameter tuning:  with
with  and
and  from top to bottom. The dashed lines show the
analytical prediction of equation (9). (b) Shape parameter tuning:
from top to bottom. The dashed lines show the
analytical prediction of equation (9). (b) Shape parameter tuning:  with
with  ,
,  and
and  from top to bottom. The tWTA performance is shown
in terms of
from top to bottom. The tWTA performance is shown
in terms of  where
where  . The dashed lines show linear regression lines in
keeping with the prediction of equation (12). (c) Delay parameter
tuning:
. The dashed lines show linear regression lines in
keeping with the prediction of equation (12). (c) Delay parameter
tuning:  with
with  ,
,  and
and  . The tWTA performance is shown in terms of minus
the log of the error rate. The solid line shows the analytical
prediction of equation (15).
. The tWTA performance is shown in terms of minus
the log of the error rate. The solid line shows the analytical
prediction of equation (15).
Effect of shape parameter tuning
In the case where only the shape parameter,  , is tuned to the stimulus, we write:
| (10) |
where  is independent of
  . We assume that population 1, with preferred direction
  , fires faster than population 2, with preferred direction
  , given stimulus
  , in the sense that for short times the probability of
firing of cell in population 2 is larger than that in population 1; hence,
, in the sense that for short times the probability of
firing of cell in population 2 is larger than that in population 1; hence,  . To compute
  in the limit of large populations, equation (4), it is
convenient to make a change of variables to
in the limit of large populations, equation (4), it is
convenient to make a change of variables to  , yielding:
 |
(11) |
where  is the time derivative of
  ,
,  . To leading order in small
  for
for  ,
,  . Applying Watson's Lemma [23] we obtain the
asymptotic approximation for the error rate:
. Applying Watson's Lemma [23] we obtain the
asymptotic approximation for the error rate:
| (12) |
Hence, in this case, the probability of error decays
algebraically with  to zero. This scaling of the readout accuracy with
population size is similar to the scaling of the conventional rate-WTA
accuracy with population size [24]. For small
to zero. This scaling of the readout accuracy with
population size is similar to the scaling of the conventional rate-WTA
accuracy with population size [24]. For small  ,
,  , we obtain:
| (13) |
Thus, although in this case tWTA sensitivity improves by
utilizing larger populations, this logarithmic improvement is extremely
slow. Figure 2b shows
the discrimination error rate to the power of  as a function of
  for different values of
  from top to bottom. The open squares are estimates of the
tWTA accuracy obtained by averaging tWTA accuracy over 106
realizations of the neural stochastic response. The dashed lines show linear
regression fits to the curves, in keeping with the asymptotic relation of
equation (12).
from top to bottom. The open squares are estimates of the
tWTA accuracy obtained by averaging tWTA accuracy over 106
realizations of the neural stochastic response. The dashed lines show linear
regression fits to the curves, in keeping with the asymptotic relation of
equation (12).
Effect of delay parameter tuning
In the case where the delay parameter,  , is the only the parameter that is tuned to the stimulus,
we write:
, is the only the parameter that is tuned to the stimulus,
we write:
| (14) |
where  is the Heavyside function:
  for
for  and 0 otherwise. In this case. we find (see Methods) that the probability of error
decays exponentially fast with the population size,
and 0 otherwise. In this case. we find (see Methods) that the probability of error
decays exponentially fast with the population size,  :
:
| (15) |
| (16) |
where  is defined in Methods. Hence, in this case, the tWTA error rate decays to zero
exponentially with
is defined in Methods. Hence, in this case, the tWTA error rate decays to zero
exponentially with  , in contrast to the slow algebraic scaling of the
conventional rate-WTA accuracy with the population size [24]. For small
, in contrast to the slow algebraic scaling of the
conventional rate-WTA accuracy with the population size [24]. For small  , we can expand the delay parameter,
  , in
, in  and approximate
  ; for small
  , we thus find that tWTA sensitivity grows algebraically
with
, we thus find that tWTA sensitivity grows algebraically
with  :
:
| (17) |
in contrast to the logarithmic scaling of the conventional rate-WTA sensitivity with population size [24]. Figure 2c shows minus the logarithm of the discrimination error rate in the case of delay parameter tuning to the stimulus. The open squares are estimates of the tWTA accuracy obtained by averaging tWTA accuracy over 106 realizations of the neural stochastic response. The solid line shows the analytical prediction of equation (15).
The different effects exerted by scale, shape and delay parameters on the
scaling of the tWTA accuracy with the population size highlights the
sensitivity of the tWTA to fine details of the first-spike-time
distribution. Nevertheless, in the general case, all parameters will be
tuned to the stimulus. The dominant contribution to the tWTA accuracy will
result from the tuning of the delay parameter. Hence, the tWTA error rate
will decay exponentially fast to zero with  , and the sensitivity will scale algebraically with
  . We will therefore focus hereafter on models in which the
delay parameter is tuned to the stimulus and ignore the tuning of other
parameters to the stimulus.
. We will therefore focus hereafter on models in which the
delay parameter is tuned to the stimulus and ignore the tuning of other
parameters to the stimulus.
Two important factors may have a considerable effect on the tWTA accuracy are addressed below. The first is noise correlations in the fluctuations of first spike times of different cells. It has been shown that noise correlations have a considerable effect on population code readout accuracy [25]–[29]. The second factors is nonzero baseline firing rate.
Effect of correlations on the tWTA accuracy
How should the covariance between first spike times of different cells be
modeled? One possible mechanism that can cause correlated firing is having a
shared input. Two cells that receive a common input that fluctuates above
its mean will integrate it over time and reach spiking threshold sooner than
their average first spike time. If the common input fluctuates below its
average value, spike time of both cells will be delayed. It is reasonable to
assume that cells that are functionally close, i.e., have
similar preferred directions, will have more common input. Hence, their
first spike times are expected to be more positively correlated. motivated
by this intuition, we model correlations by adding a uniform random shift,  , to the spike times of the cells in column
  , which represents the effect of fluctuations in shared
inputs to cells in every column. Thus, we write the first spike time
, which represents the effect of fluctuations in shared
inputs to cells in every column. Thus, we write the first spike time  of neuron
  in population
  as the sum of a correlated term and an independent term:
| (18) |
where  are statistically independent, given the stimulus, with
probability distribution
are statistically independent, given the stimulus, with
probability distribution  . We assume that, given stimulus
  ,
,  is delayed relative to
  by
by  , i.e.,
  for
for  whereas
  for
for  . The correlated components,
  and
and  , are independent, with probability distribution
  . In the limit of large
  , the probability of correct discrimination is given by
(see Methods):
, the probability of correct discrimination is given by
(see Methods):
| (19) |
Hence, for large populations, the uncorrelated fluctuations
can be ignored, and the probability of correct discrimination saturates to a
size-independent limit. Figure
3 shows the performance of the tWTA, in terms of percent correct
discrimination, as a function of the number of cells in each column,  , for increasing values of
  from top to bottom. In the simulations, we used a model in
which only the delay parameter is tuned to the stimulus. Specifically we
took:
from top to bottom. In the simulations, we used a model in
which only the delay parameter is tuned to the stimulus. Specifically we
took:  with
with  and
and  . For the correlated, part we used
  . In this case we obtain (see Methods):
 |
(20) |
| (21) |
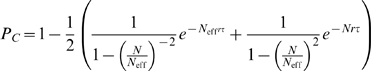
In the absence of correlations,  , equation (20) converges to equation (15) with
  and
and  . The error rate,
  , decays to zero exponentially with the number of cells,
  . In the presence of correlations,
  , for small populations,
  , the tWTA error rate decays exponentially with
  , as in the uncorrelated case, equation (15). When
  , tWTA performance reaches the saturation regime, and tWTA
accuracy converges to a finite limit for
, tWTA performance reaches the saturation regime, and tWTA
accuracy converges to a finite limit for  :
:
| (22) |
Hence, in the presence of correlations for large  , the tWTA error rate is an increasing function of
  , which saturates to chance level (chance level:
  ) in the limit of
  .
.
Figure 3. Effect of correlations on the tWTA readout accuracy.

The probability of tWTA correct response,  , in the presence of noise correlations is shown as
a function of the population size,
, in the presence of noise correlations is shown as
a function of the population size,  . Open squares show numerical estimation of the
probability of correct response by averaging over 105
trials of simulating the network stochastic response. The model was
defined as in section ‘effect of correlations on the tWTA
accuracy’. We write the first spike time
. Open squares show numerical estimation of the
probability of correct response by averaging over 105
trials of simulating the network stochastic response. The model was
defined as in section ‘effect of correlations on the tWTA
accuracy’. We write the first spike time  of neuron
  in population
  as the sum of a correlated term and an independent
term:
as the sum of a correlated term and an independent
term:  (see equation 18), where
  are statistically independent, given the stimulus,
with probability distribution
are statistically independent, given the stimulus,
with probability distribution  . Specifically, here we took:
  with
with  and
and  . The probability density of the correlated part,
  , is given by
  . The parameters that were used for the simulations
are:
. The parameters that were used for the simulations
are:  ,
,  and
and  from top to bottom. The solid lines show the
analytical result of equation (20).
from top to bottom. The solid lines show the
analytical result of equation (20).
Effect of baseline firing on tWTA accuracy
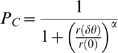
In the above analysis we assumed zero baseline firing for all cells. However, nonzero baseline firing may have a significant effect on the tWTA accuracy. To incorporate baseline firing into our model, it is most convenient to use the framework of the IHPP, which is defined by the PSTH. The PSTHs of the two populations are modeled by:
| (23) |
where,  is the baseline firing rate (
 ) and
) and  is the duration in which both columns fire at baseline
prior to responding selectively to the stimulus. The function
is the duration in which both columns fire at baseline
prior to responding selectively to the stimulus. The function  is the tuning of the delay parameter. As above we take
  and
and  . In this case, we find:
| (24) |
 |
(25) |
| (26) |
| (27) |
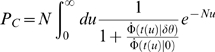
Figure 4 shows the
probability of correct discrimination as a function of  for different values of
  from top to bottom. For any positive
  , the probability of correct discrimination,
  , decays to chance level,
  , exponentially fast with
  for large
  . This decay results from the fact that the probability of
not spiking in the time interval before time
. This decay results from the fact that the probability of
not spiking in the time interval before time  decays to zero exponentially with
  . For
. For  , the probability of correct response will saturate
exponentially to
, the probability of correct response will saturate
exponentially to  (compare with equation (9)) which can be high for low
baseline firing rate,
(compare with equation (9)) which can be high for low
baseline firing rate,  . For small
  , there exists a region,
 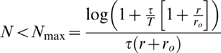 , in which
  increases with
  .
.
Figure 4. Effect of baseline firing on tWTA readout accuracy.

The probability of tWTA correct response,  , in the case of nonzero baseline firing is shown
as a function of the population size,
, in the case of nonzero baseline firing is shown
as a function of the population size,  , equation (24), for
  from top to bottom. Parameters used for this graph
are:
from top to bottom. Parameters used for this graph
are:  ,
,  and
and  .
.
The temporal n Winners-Take-All (n-tWTA)
To overcome the detrimental effect of baseline firing we generalize the tWTA
to a family of readouts,  , that are determined by the subgroup of cells that fired
the first
, that are determined by the subgroup of cells that fired
the first  spikes. In a 2AFC competition between two homogeneous
columns, the
spikes. In a 2AFC competition between two homogeneous
columns, the  estimates the stimulus by the preferred direction of the
column that fired the first
estimates the stimulus by the preferred direction of the
column that fired the first  spikes. In the model of delayed step function response
PSTH, equation (23), spikes that are fired in the absolute delay period,
from time 0 to time
spikes. In the model of delayed step function response
PSTH, equation (23), spikes that are fired in the absolute delay period,
from time 0 to time  , are independent of the stimulus and hence carry no
information. The informative time of spiking is that from time
, are independent of the stimulus and hence carry no
information. The informative time of spiking is that from time  to time
  , where firing rates of the cells depend on the stimulus.
For a given population size,
, where firing rates of the cells depend on the stimulus.
For a given population size,  , the mean number of spikes fired during the absolute delay
time is
, the mean number of spikes fired during the absolute delay
time is  . During the informative period, an average of
  spikes is being fired by the informative group. Taking
  diminishes the detrimental effect of baseline firing and
conserves the essential information embedded in the temporal order of the
neural responses. Figure
5 shows the percent correct discrimination of the
diminishes the detrimental effect of baseline firing and
conserves the essential information embedded in the temporal order of the
neural responses. Figure
5 shows the percent correct discrimination of the  , as a function of
  . In this case, the average number of baseline spikes fired
during the absolute delay time is
. In this case, the average number of baseline spikes fired
during the absolute delay time is  , and
, and  does indeed increase as
  is increased from
  and to almost perfect discrimination at about
  . During the informative period of spiking, an average of
  spikes are fired by the ‘correct’
group. As expected, the probability of correct discrimination deteriorates
for
spikes are fired by the ‘correct’
group. As expected, the probability of correct discrimination deteriorates
for  . In this example, the performance of the
  will decay to chance level in the limit of large
  , since we did not incorporate any scale differences in the
firings of the two populations. Thus, a reasonable choice of
, since we did not incorporate any scale differences in the
firings of the two populations. Thus, a reasonable choice of  can eliminate the effect of baseline firing and greatly
improve the performance of the tWTA.
can eliminate the effect of baseline firing and greatly
improve the performance of the tWTA.
Figure 5. Performance of the  readout in a 2AFC discrimination task in a
two-column model.
readout in a 2AFC discrimination task in a
two-column model.

The probability of correct discrimination of the  readout is shown as function of
  . The probability of correct discrimination was
estimated by averaging over 105 realizations of the
neural stochastic response in an IHPP model for spike time
distribution as defined in equation (23) with:
. The probability of correct discrimination was
estimated by averaging over 105 realizations of the
neural stochastic response in an IHPP model for spike time
distribution as defined in equation (23) with:  ,
,  ,
,  ,
,  and
and  .
.
Note that the optimal region for  , depends on the population size. For any fixed
  , increasing the population size increases the number of
baseline spikes fired during the absolute delay period,
, increasing the population size increases the number of
baseline spikes fired during the absolute delay period,  . Hence, for
  the
the  performance will decay to chance level. An alternative
  generalization is to estimate the stimulus by the
preferred direction of the first single cell that fired
generalization is to estimate the stimulus by the
preferred direction of the first single cell that fired  spikes, see [2]. Results for
this later generalization are qualitatively similar to those of the former
in this model.
spikes, see [2]. Results for
this later generalization are qualitatively similar to those of the former
in this model.
tWTA Estimation Accuracy in a Hypercolumn Model
The model
We study the tWTA estimation accuracy in a hypercolumn model of  cells coding for an angular variable,
  , such as the coding for the direction of motion of a
visual stimulus by MT cells. Each cell
, such as the coding for the direction of motion of a
visual stimulus by MT cells. Each cell  is characterized by its preferred direction
  to which it responds fastest. Spike time distributions of
different cells are modeled by independent IHPPs with PSTH
to which it responds fastest. Spike time distributions of
different cells are modeled by independent IHPPs with PSTH  , for cell
  ,
,  .
.
The tWTA estimate of the stimulus is given by the preferred direction,  , of the cell
  that fired the first spike
| (28) |
where  denotes the time of the first spike of cell
  , following presentation of the stimulus. Throughout this
section, we quantify tWTA sensitivity by the inverse of the root-mean-square
estimation error,
, following presentation of the stimulus. Throughout this
section, we quantify tWTA sensitivity by the inverse of the root-mean-square
estimation error,  , where
  denotes averaging of
  over the distribution of spike times for a given external
stimulus
over the distribution of spike times for a given external
stimulus  .
.
tWTA accuracy in the absence of correlations
The probability of the tWTA estimator to be  , is given by the probability that the first spike in the
population was fired by the cell with preferred direction
, is given by the probability that the first spike in the
population was fired by the cell with preferred direction  :
:
| (29) |
Empirical examples of first spike time tuning to an angular external stimulus
is shown for example in [1],[2]. Since tuning of
the delay parameter makes the dominant contribution to the tWTA accuracy
(see above), we now analyze the case of a delayed step function PSTH model
with stimulus-independent scale and shape parameters. Specifically, we take
the instantaneous firing rate of cell  with preferred direction
  , given that stimulus
  was presented at time
  , to be:
| (30) |
This simple choice of PSTH does not limit the generality of
our results but rather clarifies the analysis such that our conclusions are
not obscured by non-relevant parameters. Figure 6 shows typical population
response to stimulus  . The dots on row
  show the spike times of a single cell with preferred
direction
show the spike times of a single cell with preferred
direction  . The dashed line shows the delay tuning function,
  , which yields the minimum possible spike time for each
preferred direction.
, which yields the minimum possible spike time for each
preferred direction.
Figure 6. Simulation of a hypercolumn population raster plot.

Spiking responses of 360 cells coding for an external stimulus  during a single trial are shown. Each line shows
the spike-times of a single cell. The cells are arranged according
to their preferred directions. Spike times of cell with preferred
direction
during a single trial are shown. Each line shows
the spike-times of a single cell. The cells are arranged according
to their preferred directions. Spike times of cell with preferred
direction  was modeled by an IHPP with PSTH
 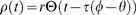 , where
  is the rate and the latency function is
  . The dashed line shows
  .
.
The delay tuning function,  , is assumed to be a periodic function of
  . We further assume that the delay function,
  , is a continuous, even function of its argument with a
single minimum at
, is a continuous, even function of its argument with a
single minimum at  . For cells with preferred directions close to the
stimulus, we can approximate the delay function by:
. For cells with preferred directions close to the
stimulus, we can approximate the delay function by:
| (31) |
where  characterizes the delay tuning function near its unique
minimum, for a smooth delay function
characterizes the delay tuning function near its unique
minimum, for a smooth delay function  , and
, and  is a constant in units of time. Since the tWTA is affected
only by the fastest cells, we can use the approximation of equation (31) to
describe the delay function of the entire hypercolumn, bearing in mind that
the likelihood of cells with preferred directions that are far removed from
the stimulus to affect the tWTA decays exponentially fast with
is a constant in units of time. Since the tWTA is affected
only by the fastest cells, we can use the approximation of equation (31) to
describe the delay function of the entire hypercolumn, bearing in mind that
the likelihood of cells with preferred directions that are far removed from
the stimulus to affect the tWTA decays exponentially fast with  .
.
Using the continuum limit approximation for the exponent in the right hand
side of equation (29), we evaluate the conditional probability density of
the estimation error of  and obtain:
| (32) |
In the limit of large  ,
,  is of
is of  in
in  for
for  and decays exponentially with
  for
for  . Hence, we obtain the following scaling law for the tWTA accuracy:
| (33) |
As in the two-column competition in the 2AFC paradigm, the
sensitivity of the tWTA readout in a hypercolumn model scales
algebraically fast with  , in the absence of noise correlations and in the limit of
low baseline firing. This fast scaling is in contrast to the slow
logarithmic scaling of the conventional rate-WTA readout accuracy wih the
population size [24]. Figure 7 shows tWTA sensitivity, in terms
of the inverse root mean square estimation error, as a function of the
population size in a hypercolumn model for
, in the absence of noise correlations and in the limit of
low baseline firing. This fast scaling is in contrast to the slow
logarithmic scaling of the conventional rate-WTA readout accuracy wih the
population size [24]. Figure 7 shows tWTA sensitivity, in terms
of the inverse root mean square estimation error, as a function of the
population size in a hypercolumn model for  from top to bottom. The open squares show numerical
estimation of the sensitivity as obtained by averaging tWTA error over
104 realizations of simulating the network stochastic
response. The solid lines show fits using the analytical result of equation
(33) with
from top to bottom. The open squares show numerical
estimation of the sensitivity as obtained by averaging tWTA error over
104 realizations of simulating the network stochastic
response. The solid lines show fits using the analytical result of equation
(33) with  from top to bottom.
Figure 7. Estimation accuracy of the tWTA readout in a hypercolumn model.

The accuracy of the tWTA readout, in terms of one over the squared
estimation error of estimating  , is plotted as a function of the population size,
in an IHPP hypercolumn population model, equation(30). The latency
tuning was modeled by
, is plotted as a function of the population size,
in an IHPP hypercolumn population model, equation(30). The latency
tuning was modeled by  (where
  is measured in radian) with
  from top to bottom. Accuracy was measured by
averaging the squared estimation error over 10,000 trials of
simulating the neuronal stochastic response (squares). The solid
lines show the analytical fit using equation (33).
from top to bottom. Accuracy was measured by
averaging the squared estimation error over 10,000 trials of
simulating the neuronal stochastic response (squares). The solid
lines show the analytical fit using equation (33).
Effect of correlations on the tWTA estimation accuracy
To model first spike time correlations in a hypercolumn, we write the spike times of each cell as the sum of correlated and uncorrelated parts
| (34) |
where the uncorrelated parts,  , are taken to be distributed according to an IHPP with a
PSTH
, are taken to be distributed according to an IHPP with a
PSTH  . For the sake of simplicity, we take
  . The terms
  ,
,  and
and  are the correlated components of the spike times. The
  term represent the effect of shared input to the entire
hypercolumn, whereas,
term represent the effect of shared input to the entire
hypercolumn, whereas,  and
and  represent the effect of shared input that is stronger for
columns that are functionally closer, i.e., have smaller preferred
directions difference. We assume that the correlated noise has zero means
represent the effect of shared input that is stronger for
columns that are functionally closer, i.e., have smaller preferred
directions difference. We assume that the correlated noise has zero means  and variance
  and
and  . Figure
8 shows typical realizations of the population response during a
single trial of presenting stimulus
. Figure
8 shows typical realizations of the population response during a
single trial of presenting stimulus  in the presence of noise correlations. In Figure 8b
 and
and  . The uniform correlations generates collective
fluctuations that shift the entire population response right (as in the
specific realization in the figure) and left of the dashed line that shows
. The uniform correlations generates collective
fluctuations that shift the entire population response right (as in the
specific realization in the figure) and left of the dashed line that shows  . Nevertheless, this fluctuation exists in a collective
mode of the neural responses that does not alter the order of firing and
hence does not affect tWTA accuracy. In Figure 8a
. Nevertheless, this fluctuation exists in a collective
mode of the neural responses that does not alter the order of firing and
hence does not affect tWTA accuracy. In Figure 8a
 and
and  . In this case, the collective fluctuations shift the
response of the entire population up and down (as in the specific
realization in the figure). These fluctuations limit the accuracy in which
the tWTA can estimate the stimulus. In the limit of large
. In this case, the collective fluctuations shift the
response of the entire population up and down (as in the specific
realization in the figure). These fluctuations limit the accuracy in which
the tWTA can estimate the stimulus. In the limit of large  , the error is dominated by the correlated response.
Neglecting the uncorrelated part of the fluctuations, we obtain (see Methods):
, the error is dominated by the correlated response.
Neglecting the uncorrelated part of the fluctuations, we obtain (see Methods):
| (35) |
where  is measured in radians. Note that equation (35) takes the
form of a signal-to-noise ratio, where the signal is the modulation
amplitude of the delay function,
is measured in radians. Note that equation (35) takes the
form of a signal-to-noise ratio, where the signal is the modulation
amplitude of the delay function,  , and the noise is the component of collective noise
correlations that affect the tWTA estimation,
, and the noise is the component of collective noise
correlations that affect the tWTA estimation,  . The tWTA sensitivity, equation (35), is independent of
the collective fluctuations in the uniform direction,
. The tWTA sensitivity, equation (35), is independent of
the collective fluctuations in the uniform direction,  .
.
Figure 8. Simulation of a hypercolumn population raster in the presence of correlations.

Spiking responses of 360 cells coding for an external stimulus  during a single trial are shown. Every line shows
the spike-times of a single cell. The cells are arranged according
to their preferred directions. Spike times are distributed as
defined in the section ‘effect of correlations on tWTA
accuracy’, see equation (34), with
during a single trial are shown. Every line shows
the spike-times of a single cell. The cells are arranged according
to their preferred directions. Spike times are distributed as
defined in the section ‘effect of correlations on tWTA
accuracy’, see equation (34), with  and
and  . For the correlated part: (a)
  ,
,  ; (b)
; (b)  ,
,  . The dashed line shows
  .
.
Figure 9 shows the
asymptotic accuracy of the tWTA as a function of the noise-to-signal ratio  . The solid line shows the analytical result of equation
(35) in the limit of large
. The solid line shows the analytical result of equation
(35) in the limit of large  . The open squares show numerical estimation of asymptotic
accuracy using a population of size
. The open squares show numerical estimation of asymptotic
accuracy using a population of size  cells. The finite size of the network limits the ability
of the numerical estimate to follow the analytic curve at high accuracy (low
noise levels). To compensate somewhat for this effect, an extremely high
firing rate was used in the simulations.
cells. The finite size of the network limits the ability
of the numerical estimate to follow the analytic curve at high accuracy (low
noise levels). To compensate somewhat for this effect, an extremely high
firing rate was used in the simulations.
Figure 9. Effect of correlations on the asymptotic tWTA estimation accuracy in a hypercolumn model.

tWTA accuracy, in terms of the root mean square estimation error,  , is shown as a function of the
correlations' strength,
, is shown as a function of the
correlations' strength,  , in a hypercolumn model, as defined in section
‘effect of correlations on the tWTA estimation
accuracy’, see equation (34). The solid line shows the
analytical asymptotic value, equation (35). Open squares show the
numerical estimation of the asymptotic value as calculated by
averaging the tWTA estimation error over 100 trials in a hypercolumn
model of
, in a hypercolumn model, as defined in section
‘effect of correlations on the tWTA estimation
accuracy’, see equation (34). The solid line shows the
analytical asymptotic value, equation (35). Open squares show the
numerical estimation of the asymptotic value as calculated by
averaging the tWTA estimation error over 100 trials in a hypercolumn
model of  cells. The latency function that was used was:
  . To minimize the effect of finite
  , an extremely high firing rate of
  was used in the IHPP simulations.
Effect of baseline firing on the tWTA accuracy
The effect of nonzero baseline firing on tWTA estimation accuracy is studied
in the framework of a hypercolumn IHPP model with a delayed step function
PSTH. Specifically, we took the following PSTH for the response of cell  with preferred direction
  :
:
| (36) |
where  is the absolute delay,
  is the tuning of the delay parameter with
  . For
. For  in the limit of large
  , we can approximate the probability of the tWTA estimator
to be
, we can approximate the probability of the tWTA estimator
to be  , equation (29), by:
| (37) |
where  is a normalizing factor of the probability distribution.
Figure 10a and 10b
show histograms of tWTA estimations of stimulus
is a normalizing factor of the probability distribution.
Figure 10a and 10b
show histograms of tWTA estimations of stimulus  for
for  and
and  , respectively, in this model with
  . The solid line shows the analytical approximation,
equation (37). The distribution is characterized by a narrow peak around
zero error, with a width that decreases to zero as
. The solid line shows the analytical approximation,
equation (37). The distribution is characterized by a narrow peak around
zero error, with a width that decreases to zero as  grows to infinity and a uniform probability for large
errors. The ratio of the peak distribution of the zero error (at
grows to infinity and a uniform probability for large
errors. The ratio of the peak distribution of the zero error (at  ) to the distribution of a specific large error is given by
  . However, since the width of the peak decreases as
  increases (compare Figure 10a and 10b), the average squared
estimation error increases for large
increases (compare Figure 10a and 10b), the average squared
estimation error increases for large  , even in for
  , in contrast to the effect of baseline firing in the 2AFC,
where at
, in contrast to the effect of baseline firing in the 2AFC,
where at  the probability of correct response is an increasing
function of
the probability of correct response is an increasing
function of  . A hallmark of the tWTA readout is the high kurtosis of
the estimation error.
. A hallmark of the tWTA readout is the high kurtosis of
the estimation error.
Figure 10. Effect of baseline firing on the tWTA estimation in a hypercolumn model.

Histograms of tWTA estimation of stimulus  were obtained in a model of delayed step function
response to the stimulus, equation (36), with
were obtained in a model of delayed step function
response to the stimulus, equation (36), with  , and parameters:
  ,
,  and
and  . Population size was
  in (a) and
  in (b,c). Histograms were estimated using
106 repetitions in (a,b) and using 107
repetitions in (c). The solid lines are analytical approximations of
equation (37) in (a,b) and equation (38) in (c).
in (b,c). Histograms were estimated using
106 repetitions in (a,b) and using 107
repetitions in (c). The solid lines are analytical approximations of
equation (37) in (a,b) and equation (38) in (c).
In the case of  , using equation (37), one obtains
| (38) |
Hence, in this case the peak to base ratio of the
distribution is decreased and decays exponentially to zero with the product  . This effect is shown by the histogram of tWTA estimation
errors in Figure 10c
where we took
. This effect is shown by the histogram of tWTA estimation
errors in Figure 10c
where we took  and
and  (compare with Figure 10b where
  and
and  ). The solid line shows the analytical approximation of
equation (38).
). The solid line shows the analytical approximation of
equation (38).
Discussion
At the time of the first spike, the tWTA is the ideal observer and, in the case of
angle estimation, it is also the population vector readout. If a decision must be
made at very short times, then the tWTA is the best readout. It is therefore
important that we know and understand the capabilities and limitation of this
readout. Scaling of the tWTA accuracy with the population size,  , can show a wide range of behaviors: from constant in
  (equation 9), through logarithmic (equation 13) to algebraic
(equation 17). These different scaling regimes depend on fine details of the tuning
of the probability distribution of the first-spike-times or alternatively on the
initial rise of the PSTH response to the stimulus. In the generic case in which
scale, shape and delay parameters are all tuned to the stimulus, the tWTA accuracy
will increase algebraically with
(equation 9), through logarithmic (equation 13) to algebraic
(equation 17). These different scaling regimes depend on fine details of the tuning
of the probability distribution of the first-spike-times or alternatively on the
initial rise of the PSTH response to the stimulus. In the generic case in which
scale, shape and delay parameters are all tuned to the stimulus, the tWTA accuracy
will increase algebraically with  , in contrast to the expected logarithmic slow scaling of the
conventional rate-WTA readout [24]. Nevertheless, the tWTA is expected to show high
sensitivity to the inherent neuronal diversity at the level of single cell response
properties (see e.g., [30]). This sensitivity of the tWTA predicts
considerable subject-to-subject variability in psychophysical performance as well as
large fluctuations in the psychophysical accuracy for the same subject under
different stimuli conditions, such as discriminating
, in contrast to the expected logarithmic slow scaling of the
conventional rate-WTA readout [24]. Nevertheless, the tWTA is expected to show high
sensitivity to the inherent neuronal diversity at the level of single cell response
properties (see e.g., [30]). This sensitivity of the tWTA predicts
considerable subject-to-subject variability in psychophysical performance as well as
large fluctuations in the psychophysical accuracy for the same subject under
different stimuli conditions, such as discriminating  and
and  versus discriminating
  and
and  .
.
Noise correlations in the fluctuations of first-spike times of different cells have a
drastically detrimental effect on the tWTA accuracy, limiting the effective number
of degrees of freedom in the network and resulting in finite error levels, even in
the limit of large  , see e.g., equations (21), (22) and (35) and Figures 3 and 9. This effect is similar to that has been
reported in population coding literature [25]–[29],[31], and
depends on the correlations structure. Here we investigated the effect of
correlations that had simple spatial structure and no temporal structure. A
drastically detrimental effect on the tWTA accuracy is caused by neuronal response
covariance which generates collective fluctuation that resembles the
‘signal’, i.e., similar to the tuning of the delay parameter
(see Figure 8). For a detailed
discussion on the effects of correlations structure see [27]. The temporal
structure of response covariance may also have a considerable effect. For example,
if the correlations depend on the absolute time, in a manner that they are
negligible for small
, see e.g., equations (21), (22) and (35) and Figures 3 and 9. This effect is similar to that has been
reported in population coding literature [25]–[29],[31], and
depends on the correlations structure. Here we investigated the effect of
correlations that had simple spatial structure and no temporal structure. A
drastically detrimental effect on the tWTA accuracy is caused by neuronal response
covariance which generates collective fluctuation that resembles the
‘signal’, i.e., similar to the tuning of the delay parameter
(see Figure 8). For a detailed
discussion on the effects of correlations structure see [27]. The temporal
structure of response covariance may also have a considerable effect. For example,
if the correlations depend on the absolute time, in a manner that they are
negligible for small  and build up later in time, then they will not necessarily cause
saturation of the tWTA accuracy. However, better empirical understanding of first
spike time correlations is required to yield sufficient constraint for theoretical
study of this issue. It is important to emphasize that by correlations we mean first
spike time covariance of simultaneously recorded cells, in contrast
to other types of correlations [5].
and build up later in time, then they will not necessarily cause
saturation of the tWTA accuracy. However, better empirical understanding of first
spike time correlations is required to yield sufficient constraint for theoretical
study of this issue. It is important to emphasize that by correlations we mean first
spike time covariance of simultaneously recorded cells, in contrast
to other types of correlations [5].
In a 2AFC, task nonzero baseline firing has a twofold detrimental effect on the tWTA
accuracy. The first is in the case in which the onset of the tWTA readout precedes
the stimulus response of the fastest cell in the entire population,  . In this case, the tWTA accuracy will decrease as
  is increased beyond some optimal value
  . This effect can be minimized by obtaining a more accurate
estimate for the minimal response time of the cells in the population, i.e.,
effectively decreasing
. This effect can be minimized by obtaining a more accurate
estimate for the minimal response time of the cells in the population, i.e.,
effectively decreasing  [5]. The
second effect is a saturating effect, which limits the maximal accuracy that can be
obtained by the tWTA,
[5]. The
second effect is a saturating effect, which limits the maximal accuracy that can be
obtained by the tWTA,  , even for
  . Note that, although
  is less than 1, psychophysical accuracy is also finite. The value
of
is less than 1, psychophysical accuracy is also finite. The value
of  can be rather high in cases in which the baseline firing is small
relative to the stimulus response. These effects can be decreased for any given
can be rather high in cases in which the baseline firing is small
relative to the stimulus response. These effects can be decreased for any given  by using a generalized
  readout that makes a decision according to the population that
fired the first n spikes, see Figure 5. Nevertheless, for any given fixed value
of
readout that makes a decision according to the population that
fired the first n spikes, see Figure 5. Nevertheless, for any given fixed value
of  , increasing the population size,
  , will decrease the
  performance to chance level, for
  . Hence, for fast decisions there are advantages to reading out the
responses of small neuronal populations rather than larger populations.
. Hence, for fast decisions there are advantages to reading out the
responses of small neuronal populations rather than larger populations.
Baseline firing has similar detrimental effects on the tWTA readout in estimation
tasks (see Figure 10). A
hallmark of the tWTA readout that can serve as a prediction is its high kurtosis.
There are various ways to generalize the tWTA to use more than one spike in order to
overcome the detrimental effect of baseline firing. One option is that readout is
determined by the preferred direction of the single cell that fired the first  spikes. An alternative generalization is to define the readout by
a ‘vote’ of cells that fired the first
spikes. An alternative generalization is to define the readout by
a ‘vote’ of cells that fired the first  spikes in the population. In the later case, different weights may
be assigned to the votes. The utility of the different possible generalizations is
expected to depend largely on the structure of the correlations in the neuronal
initial dynamic response to the stimulus.
spikes in the population. In the later case, different weights may
be assigned to the votes. The utility of the different possible generalizations is
expected to depend largely on the structure of the correlations in the neuronal
initial dynamic response to the stimulus.
In a series of highly influential papers, Thorpe and colleagues (see e.g., [12],[14]), have highlighted
the possible role of spike latency as primary source of information in the CNS and
have shown, for example, how an image falling on the retina could be reconstructed
from a spike latency (see also work of [15]). In the context of
this work, their readout could be thought of as a specific choice for the  generalization. Here, we presented a systematic investigation of
the tWTA accuracy that allows for comparison with psychophysical accuracy; hence,
enables testing of the hypothesis that tWTA is actually used by the CNS. In
addition, our analysis provides a framework that allows for the understanding and
the investigation of the effects of correlations and baseline firing on the tWTA
accuracy.
generalization. Here, we presented a systematic investigation of
the tWTA accuracy that allows for comparison with psychophysical accuracy; hence,
enables testing of the hypothesis that tWTA is actually used by the CNS. In
addition, our analysis provides a framework that allows for the understanding and
the investigation of the effects of correlations and baseline firing on the tWTA
accuracy.
Neural network implementations of the tWTA
Considerable theoretical effort has been devoted to the investigation of
neural network models that can implement the conventional rate-WTA [32]–[43]. These studies
have focused on inputs that are constant in time and differ by their scale.
However, it has been acknowledged that the temporal structure of the inputs
may have a considerable effect on the WTA readout [43]. This effect
shows the sensitivity of existing rate-WTA neural network models to the
order of firing and demonstrates the capability of neural networks to
implement a tWTA computation. Indeed one can imagine the responses of the
(assumed excitatory) hypercolumn network that code for the external stimulus
by their spike time latency, being input to a  readout layer of laterally all to all connected inhibitory
neurons. Once, input to a inhibitory cell crosses firing threshold of
readout layer of laterally all to all connected inhibitory
neurons. Once, input to a inhibitory cell crosses firing threshold of  excitatory post synaptic potential, it will fire and
silence the rest of the network. Investigation of various neural network
implementations, their limitations and deviations from the mathematically
ideal tWTA and the computational consequences of these deviations if exist
is beyond the scope of the current work and will be addressed elsewhere.
excitatory post synaptic potential, it will fire and
silence the rest of the network. Investigation of various neural network
implementations, their limitations and deviations from the mathematically
ideal tWTA and the computational consequences of these deviations if exist
is beyond the scope of the current work and will be addressed elsewhere.
The neural code
To what extent does the CNS use the tWTA as a readout mechanism? Readout
mechanisms used by the CNS are necessarily dynamic processes that may
involve inhibition and hence generate WTA-like competition between inputs
from different columns. If fast decisions between a small number of
alternatives are required, then the tWTA can provide the correct result with
high probability. In such a case, we predict that the readout will be
determined by competition between relatively small groups
of cells rather than by the entire cell population that responds to the
stimulus so as to decrease the effect of baseline firing. Such decisions
include, for example, estimation of the direction of motion of a visual
stimulus at a low resolution of 45°. However, for discrimination
between many alternatives the tWTA is limited by the baseline firing. Why is
this task more sensitive to baseline firing? Consider an example in which
estimation of the direction of motion of a visual stimulus is required at a
precision of 3.6°. For this angular resolution, a population of at
least  cells is needed. Let us assume that at the stimulus onset
the ‘correct’ cell fires at a rate of
cells is needed. Let us assume that at the stimulus onset
the ‘correct’ cell fires at a rate of  while the rest of the population fires at a baseline rate
of
while the rest of the population fires at a baseline rate
of  . During the first
  of stimulus presentation, the
‘correct’ cell will fire an average of
of stimulus presentation, the
‘correct’ cell will fire an average of  spike, while the rest of the cells will fire an average of
  spikes; thus, the tWTA is expected to err in more than
3.6° in about 50% of the cases. Hence, fine estimation
tasks cannot rely on the single first spike, and our theory
predicts that in these cases the first
spikes; thus, the tWTA is expected to err in more than
3.6° in about 50% of the cases. Hence, fine estimation
tasks cannot rely on the single first spike, and our theory
predicts that in these cases the first  spikes must be considered where
  should be larger than the average number of baseline
spikes. How should the
should be larger than the average number of baseline
spikes. How should the  combine the information from the first
  spikes? The answer to this question depends on the
temporal structure of correlations, fine details of the PSTH, and on our
assumptions on the computational capabilities of this readout and is beyond
the scope of the current paper. The current work provides the essential
framework for addressing this question. To further study the hypothesis that
the CNS actually uses the tWTA better empirical understanding of the tuning
of first spike time distribution to the stimulus, baseline firing, and the
spatial and temporal structure of noise correlations is required.
spikes? The answer to this question depends on the
temporal structure of correlations, fine details of the PSTH, and on our
assumptions on the computational capabilities of this readout and is beyond
the scope of the current paper. The current work provides the essential
framework for addressing this question. To further study the hypothesis that
the CNS actually uses the tWTA better empirical understanding of the tuning
of first spike time distribution to the stimulus, baseline firing, and the
spatial and temporal structure of noise correlations is required.
Methods
Calculation of tWTA Accuracy in 2AFC in the Case of Delay Parameter Tuning to the Stimulus
Substituting equation (14) into equation (4), we obtain the probability of correct discrimination as sum of two terms:
| (39) |
| (40) |
| (41) |
The integral  , equation (40), can be evaluated exactly, yielding the
contribution of
, equation (40), can be evaluated exactly, yielding the
contribution of
| (42) |
where we have used  as shorthand for
  . The contribution of
  to
to  is positive; hence, the tWTA error rate, in this case, will
decay to zero exponentially with the population size
is positive; hence, the tWTA error rate, in this case, will
decay to zero exponentially with the population size  .
.
For the calculation of  , equation (41), we change variables to
  , yielding:
 |
(43) |
where for a small positive  ,
,  . Assuming
  , the leading term in
  , for small
  , is given by:
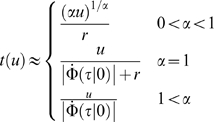 |
(44) |
Using Watson's Lemma to evaluate  to leading order in
  , we obtain
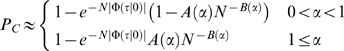 |
(45) |
where
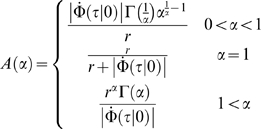 |
(46) |
and
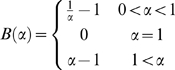 |
(47) |
Calculation of the tWTA Accuracy in 2AFC with Correlations
For a given stimulus  , the probability density,
  , that the first spike of population 1 occurred at time
  is
is
| (48) |
where  . The probability density,
  , that population 2 did not fire before time
  is given by:
| (49) |
Assuming the tWTA decides the stimulus is  if the first spike comes from population 1, the probability of
correct response is:
if the first spike comes from population 1, the probability of
correct response is:
 |
(50) |
In the limit of large  ,
,  , we obtain
  , and due to the delay
  , we thus obtain
| (51) |
In the specific example of Figure
3, the following model was used. The uncorrelated part of the first spike
times was generated by an IHPP with a delayed step function PSTH, yielding the
first-spike-time probability density:  with
with  and
and  . For the correlated part, we used an IHPP model with PSTH,
yielding:
. For the correlated part, we used an IHPP model with PSTH,
yielding:  . From equation (48), the probability density,
  , that the first spike in column 1 occurred at time
  , is given by:
| (52) |
The probability density,  , that no cell in column 2 had fired until time
  , equation (49), is equal to the probability that the first
spike of the cells in column 2 occurred at any time
, equation (49), is equal to the probability that the first
spike of the cells in column 2 occurred at any time  :
:
 |
(53) |
Note that for  ,
,  . The probability of correct classification is given by:
| (54) |
Substituting equations (52) and (53) into equation (54) and integrating one obtains the result of equation (20).
tWTA Accuracy in a Correlated Hypercolumn Model
We now turn to calculate tWTA asymptotic accuracy in the presence of
correlations, see section ‘Effect of correlations on the tWTA
estimation accuracy’. In the limit of large  , the estimation error will be dominated by the correlated
noise. We can, therefore, neglect the fluctuations of the uncorrelated part,
, the estimation error will be dominated by the correlated
noise. We can, therefore, neglect the fluctuations of the uncorrelated part,  (see equation (34)), replacing its distribution with a delta
function at the first time the PSTH of cell
(see equation (34)), replacing its distribution with a delta
function at the first time the PSTH of cell  is larger than zero:
| (55) |
In this case, for a specific realization of  ,
,  and
and  we can write the first spike time of cell
  as
as
| (56) |
Without loss of generality, we will assume  . The tWTA estimate for the stimulus,
  is obtained by taking the derivative of equation (56) with
respect to
is obtained by taking the derivative of equation (56) with
respect to  and equating to zero at
| (57) |
For small errors, we can approximate:
| (58) |
and obtain:
| (59) |
which is equivalent to the result of equation (35).
Acknowledgments
MS is grateful for helpful discussion with Professor Israel Nelken.
Footnotes
The authors have declared that no competing interests exist.
MS is supported by the Ben-Gurion University.
References
- 1.Osborne LC, Bialek W, Lisberger SG. Time course of information about motion direction in visual area MT of macaque monkeys. J Neurosci. 2004;24:3210–3222. doi: 10.1523/JNEUROSCI.5305-03.2004. [DOI] [PMC free article] [PubMed] [Google Scholar]
- 2.Nelken I, Chechik G, Mrsic-Flogel TD, King AJ, Schnupp JW. Encoding stimulus information by spike numbers and mean response time in primary auditory cortex. J Comput Neurosci. 2005;19:199–221. doi: 10.1007/s10827-005-1739-3. [DOI] [PubMed] [Google Scholar]
- 3.Brugge JF, Reale RA, Hind JE. The structure of spatial receptive fields of neurons in primary auditory cortex of the cat. J Neurosci. 1996;16:4420–4437. doi: 10.1523/JNEUROSCI.16-14-04420.1996. [DOI] [PMC free article] [PubMed] [Google Scholar]
- 4.Brugge JF, Reale RA, Jenison RL, Schnupp J. Auditory cortical spatial receptive fields. Audiol Neurootol. 2001;6:173–177. doi: 10.1159/000046827. [DOI] [PubMed] [Google Scholar]
- 5.Chase SM, Young ED. First-spike latency information in single neurons increases when referenced to population onset. Proc Natl Acad Sci U S A. 2007;104:5175–5180. doi: 10.1073/pnas.0610368104. [DOI] [PMC free article] [PubMed] [Google Scholar]
- 6.Foffani G, Chapin JK, Moxon KA. Computational role of large receptive fields in the primary somatosensory cortex. J Neurophysiol. 2008;100:268–280. doi: 10.1152/jn.01015.2007. [DOI] [PMC free article] [PubMed] [Google Scholar]
- 7.Gütig R, Sompolinsky H. The tempotron: a neuron that learns spike timing-based decisions. Nat Neurosci. 2006;9:420–428. doi: 10.1038/nn1643. [DOI] [PubMed] [Google Scholar]
- 8.Johansson RS, Birznieks I. First spikes in ensembles of human tactile afferents code complex spatial fingertip events. Nat Neurosci. 2004;7:170–177. doi: 10.1038/nn1177. [DOI] [PubMed] [Google Scholar]
- 9.Furukawa S, Middlebrooks JC. Cortical representation of auditory space: information-bearing features of spike patterns. J Neurophysiol. 2002;87:1749–1762. doi: 10.1152/jn.00491.2001. [DOI] [PubMed] [Google Scholar]
- 10.Jenison RL, Reale RA. Likelihood approaches to sensory coding in auditory cortex. Network. 2003;14:83–102. [PubMed] [Google Scholar]
- 11.Van Rullen R, Gautrais J, Delorme A, Thorpe S. Face processing using one spike per neurone. Biosystems. 1998;48:229–239. doi: 10.1016/s0303-2647(98)00070-7. [DOI] [PubMed] [Google Scholar]
- 12.Van Rullen R, Thorpe SJ. Rate coding versus temporal order coding: What the retinal ganglion cells tell the visual cortex. Neural Comput. 2001;13:1255–1283. doi: 10.1162/08997660152002852. [DOI] [PubMed] [Google Scholar]
- 13.Thorpe S, Delorme A, Van Rullen R. Spike-based strategies for rapid processing. Neural Netw. 2001;14:715–725. doi: 10.1016/s0893-6080(01)00083-1. [DOI] [PubMed] [Google Scholar]
- 14.VanRullen R, Guyonneau R, Thorpe SJ. Spike times make sense. Trends Neurosci. 2005;28:1–4. doi: 10.1016/j.tins.2004.10.010. [DOI] [PubMed] [Google Scholar]
- 15.Wiener MC, Richmond BJ. Decoding spike trains instant by instant using order statistics and the mixture-of-Poissons model. J Neurosci. 2003;23:2394–2406. doi: 10.1523/JNEUROSCI.23-06-02394.2003. [DOI] [PMC free article] [PubMed] [Google Scholar]
- 16.Panzeri S, Petersen RS, Schultz SR, Lebedev M, Diamond ME. The role of spike timing in the coding of stimulus location in rat somatosensory cortex. Neuron. 2001;29:769–777. doi: 10.1016/s0896-6273(01)00251-3. [DOI] [PubMed] [Google Scholar]
- 17.Shamir M, Sen K, Colburn HS. Temporal coding of time varying stimuli. Neural Comput. 2007;19:3239–3261. doi: 10.1162/neco.2007.19.12.3239. [DOI] [PubMed] [Google Scholar]
- 18.Gollisch T, Meister M. Rapid neural coding in the retina with relative spike latencies. Science. 2008;319:1108–1111. doi: 10.1126/science.1149639. [DOI] [PubMed] [Google Scholar]
- 19.Dubner R, Zeki SM. Response properties and receptive fields of cells in an anatomically defined region of the superior temporal sulcus in the monkey. Brain Res. 1971;35:528–532. doi: 10.1016/0006-8993(71)90494-x. [DOI] [PubMed] [Google Scholar]
- 20.Britten KH, Shadlen MN, Newsome WT, Movshon JA. The analysis of visual motion: a comparison of neuronal and psychophysical performance. J Neurosci. 1992;12:4745–4765. doi: 10.1523/JNEUROSCI.12-12-04745.1992. [DOI] [PMC free article] [PubMed] [Google Scholar]
- 21.Tuckwell CH. Introduction to Theoretical Neurobiology. New York: Cambridge University Press; 1988. Volume 2. [Google Scholar]
- 22.van Kampen NG. Stochastic Processes in Physics and Chemistry. Amsterdam, The Netherlands: Elsevier Science B.V; 1997. [Google Scholar]
- 23.Orszag SA, Bender CM. Advanced Mathematical Methods for Scientists and Engineers. New York: Springer-Verlag; 1991. [Google Scholar]
- 24.Shamir M. The scaling of winner-takes-all accuracy with population size. Neural Comput. 2006;18:2719–2729. doi: 10.1162/neco.2006.18.11.2719. [DOI] [PubMed] [Google Scholar]
- 25.Zohary E, Shadlen MN, Newsome WT. Correlated neuronal discharge rate and its implications for psychophysical performance. Nature. 1994;370:140–143. doi: 10.1038/370140a0. [DOI] [PubMed] [Google Scholar]
- 26.Abbott LF, Dayan P. The effect of correlated variability on the accuracy of a population code. Neural Comput. 1999;11:91–101. doi: 10.1162/089976699300016827. [DOI] [PubMed] [Google Scholar]
- 27.Sompolinsky H, Yoon H, Kang K, Shamir M. Population coding in neuronal systems with correlated noise. Phys Rev E Stat Nonlin Soft Matter Phys. 2001;64:051904. doi: 10.1103/PhysRevE.64.051904. [DOI] [PubMed] [Google Scholar]
- 28.Mazurek ME, Shadlen MN. Limits to the temporal fidelity of cortical spike rate signals. Nat Neurosci. 2002;5:463–471. doi: 10.1038/nn836. [DOI] [PubMed] [Google Scholar]
- 29.Montani F, Kohn A, Smith MA, Schultz SR. The role of correlations in direction and contrast coding in the primary visual cortex. J Neurosci. 2007;27:2338–2348. doi: 10.1523/JNEUROSCI.3417-06.2007. [DOI] [PMC free article] [PubMed] [Google Scholar]
- 30.Ringach DL, Shapley RM, Hawken MJ. Orientation selectivity in macaque V1: diversity and laminar dependence. J Neurosci. 2002;22:5639–5651. doi: 10.1523/JNEUROSCI.22-13-05639.2002. [DOI] [PMC free article] [PubMed] [Google Scholar]
- 31.Averbeck BB, Latham PE, Pouget A. Neural correlations, population coding and computation. Nat Rev Neurosci. 2006;7:358–366. doi: 10.1038/nrn1888. [DOI] [PubMed] [Google Scholar]
- 32.Hertz J, Krogh A, Palmer RG. Introduction to the Theory of Neural Computation. Redwood City, CA: Addison-Wesley Publishing Company; 1991. [Google Scholar]
- 33.Grossberg S. Contour enhancement, short-term memory, and constancies in reverberating neural networks. Stud Appl Math. 1973;L11:213. [Google Scholar]
- 34.Amari S, Arbib MA. In: Systems Neuroscience. Metzler J, editor. Boston: Academic Press; 1977. p. 119. [Google Scholar]
- 35.Ermentrout B. Complex dynamics in WTA neural nets with slow inhibition. Neural Netw. 1992;5:415–431. [Google Scholar]
- 36.Feng J, Hadeler KP. Qualitative behaviour of some simple networks. J Phys A. 1996;29:5019–5033. [Google Scholar]
- 37.Hahnloser RHR, Sarpeshkar R, Mahowald MA, Douglas RJ, Seung HS. Digital selection and analogue amplification coexist in a cortex-inspired silicon circuit. Nature. 2000;405:947–951. doi: 10.1038/35016072. [DOI] [PubMed] [Google Scholar]
- 38.Ermentrout B, Wang JW, Flores J, Gelperin A. Model for olfactory discrimination and learning in Limax procerebrum incorporating oscillatory dynamics and wave propagation. J Neurophysiol. 2001;85:1444–1452. doi: 10.1152/jn.2001.85.4.1444. [DOI] [PubMed] [Google Scholar]
- 39.Jin DZ, Seung HS. Fast computation with spikes in a recurrent neural network. Phys Rev E. 2002;65:051922. doi: 10.1103/PhysRevE.65.051922. [DOI] [PubMed] [Google Scholar]
- 40.Xie X, Hahnloser RH, Seung HS. Selectively grouping neurons in recurrent networks of lateral inhibition. Neural Comput. 2002;14:2627–2646. doi: 10.1162/089976602760408008. [DOI] [PubMed] [Google Scholar]
- 41.Richards W, Seung HS, Pickard G. Neural voting machines. Neural Netw. 2006;19:1161–1167. doi: 10.1016/j.neunet.2006.06.006. [DOI] [PubMed] [Google Scholar]
- 42.Fukai T, Tanaka S. A simple neural network exhibiting selective activation of neuronal ensembles: from WTA to winners-share-all. Neural Comput. 1997;9:77–97. doi: 10.1162/neco.1997.9.1.77. [DOI] [PubMed] [Google Scholar]
- 43.Lumer ED. Effects of spike timing on WTA competition in model cortical circuits. Neural Comput. 2000;12:181–194. doi: 10.1162/089976600300015943. [DOI] [PubMed] [Google Scholar]