

SUMMARY
Decision making with several choice options is central to cognition. To elucidate the neural mechanisms of such decisions, we investigated a recurrent cortical circuit model in which fluctuating spiking neural dynamics underlie trial-by-trial stochastic decisions. The model encodes a continuous analog stimulus feature and is thus applicable to multiple choice decisions. Importantly, the continuous network captures similarity between alternatives and possible overlaps in their neural representation. Model simulations accounted for behavioral as well as single-unit neurophysiological data from a recent monkey experiment, and revealed testable predictions about the patterns of error rate as a function of the similarity between the correct and actual choices. We also found that the similarity and number of options affect speed and accuracy of responses. A mechanism is proposed for flexible control of speed-accuracy tradeoff, based on a simple top-down signal to the decision circuit that may vary non-monotonically with the number of choice alternatives.
INTRODUCTION
The ability to make a choice among multiple alternatives is a hallmark of goal-directed adaptive behavior, and has been the subject of a large body of work in cognitive psychology. Human studies showed that, typically, increasing the number of alternatives results in longer response times and lower accuracy (the probability of correct choices) (Hick, 1952; Luce, 1986). Speed and accuracy, however, are not set in stone and are affected by practice, attention, motivation, and more. Furthermore, subjects can flexibly adapt their responses according to changing task demands, often via a speed-accuracy tradeoff: improving performance on the cost of slower response times (Hale, 1969; Palmer et al., 2005; Reddi and Carpenter, 2000; Wickelgren, 1977).
In recent years, significant progress has been made in revealing the neural basis of perceptual decision making (reviewed by Glimcher, 2003; Gold and Shadlen, 2007; Heekeren et al., 2008; Wang 2008). Theoretical studies provided additional insights into the underlying mechanisms and helped to bridge between the single neuron level and behavior (Bogacz et al., 2006; Cisek, 2006; Deco and Rolls, 2006; Frank and Claus, 2006; Ganguli et al., 2008; Grossberg and Pilly, 2008; Machens et al., 2005; Wang, 2002). Recently, building on previous work about two-choice decision making (Huk and Shadlen, 2005; Roitman and Shadlen, 2002), Churchland et al. (2008) recorded neural activity in the lateral-intraparietal area (LIP) and collected behavioral data while monkeys performed two- and four-alternative forced-choice random-dot motion (RDM) discrimination tasks. In this task, the subject is required to report the perceived direction of motion in a dynamic random dot array (Fig. 1A). At the behavioral level, increasing the number of choices from two to four resulted in longer response times and lower accuracy. At the neural level, the activity of single neurons in LIP was correlated with the animal’s decisions, showing a ramping-up of activity when the selected target was in the neuron’s response field. Decisions were made when the activity crossed a threshold activity level.
Figure 1.
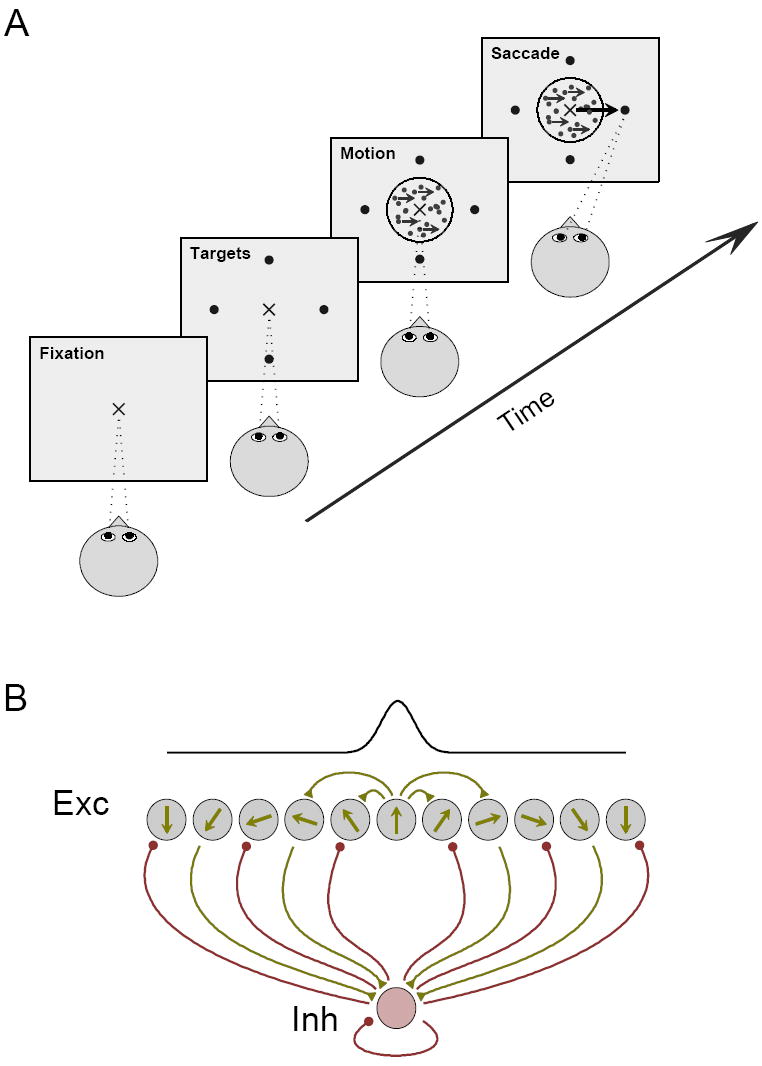
The multiple-choice motion discrimination task and network architecture. (A) In the task, the subject fixates, and is then presented with a number of peripheral targets indicating the choice alternatives. After a delay, a dynamic random-dots array appears. A fraction of the dots move coherently in the direction toward one of the targets, while the remaining dots move at random directions. When ready to respond, the subject reports the perceived net direction of motion by making a saccadic eye movement to the corresponding target. (B) Schematic description of the spiking neuron network model. The network is composed of spiking pyramidal cells and inhibitory interneurons. Pyramidal cells are directionally selective and are spatially arranged according to their preferred directions. The connectivity strength between pyramidal cells is a Gaussian function of the difference between their preferred directions. For the sake of simplicity, connections to and from the interneurons are non selective. Recurrent excitation in the model underlies accumulation of sensory information over time, while feedback inhibition mediates competition between the choice alternatives and categorical decision formation.
Multiple-choice decisions have been commonly modeled as a race between discrete integrators (Churchland et al., 2008; McMillen and Holmes, 2006; Niwa and Ditterich, 2008), or by a competition between a number of discrete neural pools (Bogacz et al., 2007; Usher and McClelland, 2001). While successful in accounting for a range of behavioral data, this approach is likely to be inadequate for understanding the physiological basis of multi-choice decisions, because the tuning of neurons is typically broad and consequently the neural representations of the choice alternatives may overlap to a varying extent that depends on the number of choice options and the similarity between them. Similarity between stimulus/choice items, widely studied in psychology, plays a fundamental role in classification, recognition, and other decision processes (Ashby and Perrin, 1988; Kahana and Bennett, 1994; Nosofsky, 1986; Nosofsky, 1997; Tversky, 1977). In physiological studies, the issue of similarity has so far been largely avoided using two diametrically opposing alternatives (e.g. left versus right motion direction). However, similarity becomes important when the number of choice options is increased in a limited feature space (e.g. directional angles between 0 and 360 degrees). The RDM direction discrimination task represents a suitable experimental paradigm for studying similarity effects on the choice behavior and the underlying neural circuit dynamics.
In this work, we considered a novel approach to multiple-choice decisions, using a continuous network capable of representing an analog sensory input (Ben-Yishai et al., 1995; Camperi and Wang, 1998; Erlhagen and Schöner, 2002; Jazayeri and Movshon, 2006; Ma et al., 2006). Specifically, we investigated a biophysically-based, “line-attractor” network of spiking neurons that can encode directional inputs (Carter and Wang, 2007; Compte et al., 2000; Renart et al., 2003), and tested the hypothesis that it can serve as a framework for modeling multiple-choice decision making. This model is the continuous analog of a model with discrete neural pools, which is endowed with slow synaptic reverberation mediated by NMDA-receptors (for time integration of information) and winner-take-all competition mediated by feedback inhibition (Wang, 2002; Wong and Wang, 2006; Wong et al., 2007). The discrete model accounted successfully for behavioral and physiological data from the RDM experiment with two-alternative forced-choice task (Shadlen and Newsome, 2001; Roitman and Shadlen, 2002; Huk and Shadlen, 2005).
The continuous network model offers, for the first time, a biophysically based circuit mechanism for multiple-choice decision making, which operates independently of the number of choices and takes into account the similarity among them. We used the model to address the following important questions: (1) Can a line-attractor network account for behavioral and physiological data from the multiple-choice RDM direction discrimination task? (2) What are the effects of similarity between choice alternatives on the neural population firing pattern that ultimately determines performance and response time? (3) Can such a model shed light on the neural mechanisms that control subjects’ response times and performance in multiple-choice tasks?
Computer simulations show that the model accounts for a range of behavioral and physiological data from the recent monkey experiment (Churchland et al., 2008). Interestingly, the recurrent (attractor) network dynamics depend on the number (2, 4 and 8) of choice options in a non-monotonic fashion, which we explain in terms of similarity and its neuronal underpinning. Furthermore, we show that in the presence of similarity effects, optimal behavior (defined by maximal rewards) requires a flexible mechanism for controlling the speed-accuracy tradeoff, which, we propose, can be achieved by a simple top-down signal to the decision circuit. Taken together, our findings suggest a general computational framework for multiple-choice decision making.
RESULTS
We used a recurrent circuit model of spiking neurons to simulate network dynamics underlying decision making in a multiple-choice motion discrimination task (Fig. 1). For the sake of comparing with data from Churchland et al. (2008), the model network can be viewed as representing a local microcircuit in area LIP. The pyramidal neurons in the model are directionally tuned, and their preferred directions cover uniformly all directions along a circle. The network is endowed with recurrent connections, in accordance with the physiology of cortical circuits (Douglas and Martin, 2004; Goldman-Rakic, 1995). Due to sufficiently strong recurrent excitation, a directional cue can trigger bell-shaped persistent activity patterns (“bump attractor”) (Compte et al., 2000; Wang, 2004), consistently with the fact that LIP neurons show direction-selective sustained activity during delay periods in working memory tasks (e.g., Gnadt and Andersen, 1988; Chafee and Goldman-Rakic, 1998; Shadlen and Newsome, 2001). The transition from spontaneous activity to persistent firing in the model, however, is not necessarily fast or irreversible. Slow NMDA-mediated reverberation enables the network to integrate inputs over extended time periods (Wang, 2002; Wong and Wang, 2006). Therefore, this attractor network does not simply operate in the steady states, but performs computations by virtue of transient dynamics. In addition, feedback inhibition mediates winner-take-all competition and categorical decision formation. All the neurons in the network receive a large amount of background Poisson inputs that enable the neurons to fire irregularly and approximately asynchronously at a few hertz in the absence of additional external inputs. Furthermore, as shown below, the stochastic neuronal spike discharges play an important role in producing trial-to-trial variability of both the network activity pattern and the resulting decision outcome.
Network dynamics of multiple-choice decisions
We assume that the RDM stimulus is encoded in the middle-temporal area (MT), while the visual input about choice alternatives (the targets) is encoded in a separate sensory area, and the two signals converge in a putative decision circuit like LIP. In addition, to study how subjects can internally modulate their response in the task, we assume that the decision circuit receives a simple ‘top-down’ control signal from higher brain areas such as the prefrontal cortex. In summary, the pyramidal neurons in the model receive three external inputs, representing the visual targets, the motion stimulus, and the control signal, respectively. Fig. 2 shows the temporal and spatial structure of the target-input and the motion stimulus input. The control signal input is uniform in space and time-independent.
Figure 2.
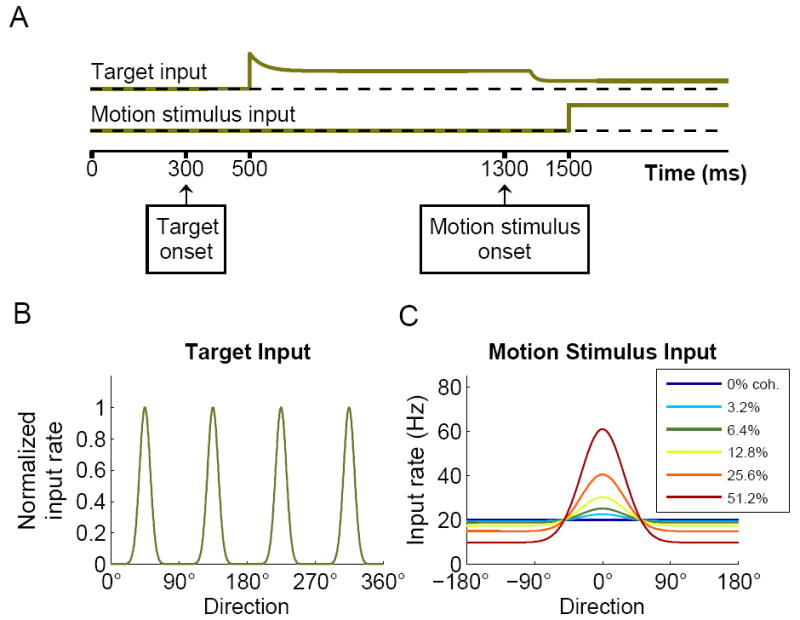
Simulation protocol. (A) Schematic time course of the input signals. The input signals represent sensory information acquired during the task, and are implemented by rate-modulated Poisson spike trains projecting to the neurons in the network. The targets are presented at 300ms and the corresponding signal to the network is activated after a latency of 200ms. The target-input has a transient phase, to model spike-rate adaptation of the input neurons, followed by tonic activity. The motion stimulus is presented at 1300ms, resulting first in a reduction of the target-input (after a latency of 80 ms), and then in activation of the motion stimulus input to the decision circuit after a latency of 200 ms. (B) Normalized spatial profile of the target-input with four choice options. (C) Spatial profile of the motion stimulus input for different coherence levels, as function of direction relative to the coherent motion.
Fig. 3A, B shows a sample simulation trial with 4 choices. The motion coherence is 0% in this trial, and therefore the motion stimulus input is the same for all neurons. However, as the activity develops in response to the motion stimulus, the four neural pools close to the targets compete against each other through shared inhibition, and stochastic recurrent network dynamics eventually breaks the symmetry. Namely, the activity of one of the neural pools (the top one in this simulation) ramps up and wins the competition, yielding a categorical choice. Interestingly, the model network does not exhibit winner-take-all competition prior to the motion stimulus onset, as long as the target inputs are sufficiently strong. This feature was also observed in a discrete model for two-choice decision making; an explanation can be found in earlier papers from our lab (Wong and Wang, 2006; Wong et al., 2007). The decision process terminates when the activity of a neural group in the network crosses a pre-determined threshold level. Based on experimental findings (Churchland et al., 2008; Roitman and Shadlen, 2002), we assume that the threshold depends neither on coherence level nor on the number of choices. As shown by the four sample trials in Fig. 3C-F, both the winner (hence the choice) and the response time fluctuate from trial to trial, due to stochastic network dynamics.
Figure 3.
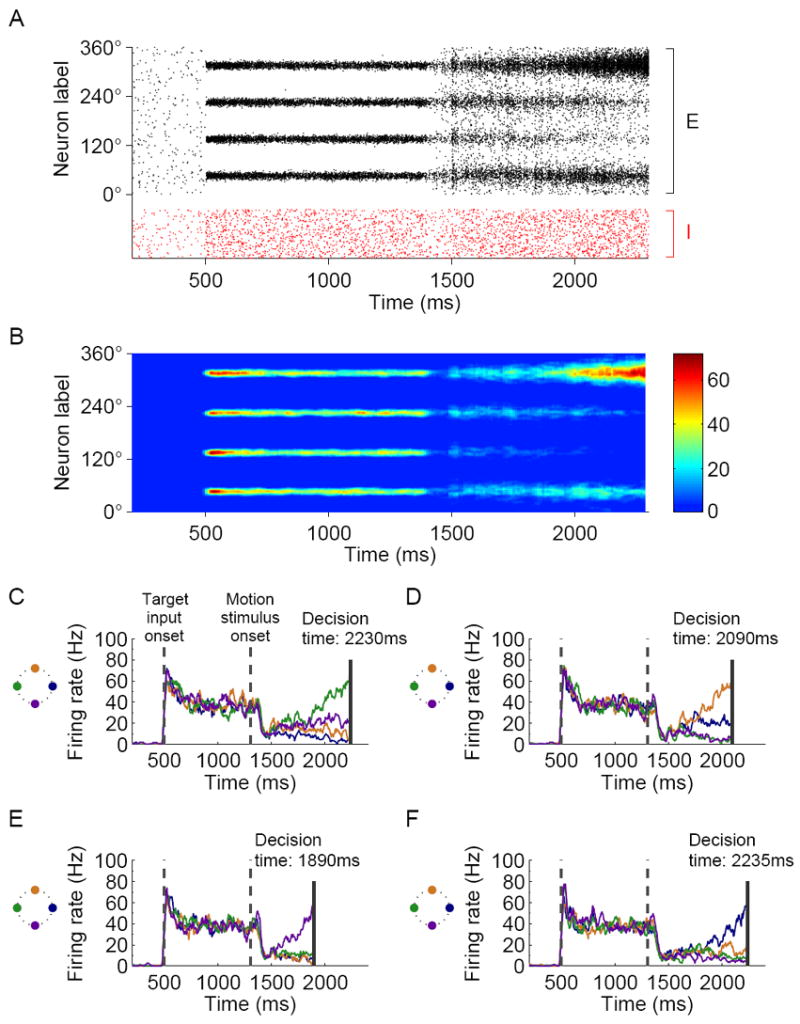
Simulated neural activity during sample trials with 4 choices and 0% coherence level. (A) Spiking activity of the pyramidal (black) and inhibitory (red) neurons in the model. Pyramidal neurons are arranged along the ordinate according to their preferred direction. The directions of the targets are 45°, 135°, 225° and 315°. (B) Color-coded activity of the pyramidal neurons in (A) after smoothing (see Experimental Procedures). (C-F) Activity time course of neurons located around the targets in four sample trials. The colors of the traces correspond to the targets in the schematic illustration of target locations (left). Similar to neural data from LIP, neurons located around the targets respond vigorously to the presence of the targets even before the onset of the motion stimulus. When the motion stimulus is presented, firing activity shows an initial dip, which in the model is assumed to arise from divided attention between the target and the motion stimuli. During the decision process the network displays competitive dynamics, and eventually, the activity of a group of neurons ramps up and reaches the preset decision threshold (solid vertical line). Due to stochastic firing within the network, both the winning neural pool (hence the choice) and the response time vary from trial to trial even when the stimulus condition remains unchanged.
The simulated neural dynamics shown in Fig. 3 compare directly with decision-correlated neurophysiological data from area LIP. In the 4-choice experiments, for example (Churchland et al. 2008, Fig. 4), the activity of neurons located close to the selected target in each trial ramped up, while the activity of neurons at orthogonal and opposite directions either decreased or ramped up at a much more moderate rate. In comparing the model and the neurophysiology, it is worth noting that in the monkey experiment typically a single-unit is recorded at a time and its selectivity and dynamics are assessed across trials. By contrast, in our model all neurons can be monitored and shown in a spatiotemporal pattern for a single trial (Fig. 3A-B). At the neural population level, the experimentally observed ramping activity of single-units is interpreted in our model in terms of a gradual development of “bump” or “hill” of network activity around the direction of the selected target (Fig. 3A-B). Our model proposes a circuit mechanism for the formation of such activity patterns, and therefore captures a key stage in the decision making process. When a “bump” activity profile is developed near one of the choice targets, it determines a well defined choice response, which can be readout by a downstream system (e.g. the superior colliculus, a command center for saccadic eye movements; cf. Lo and Wang 2006).
Figure 4.
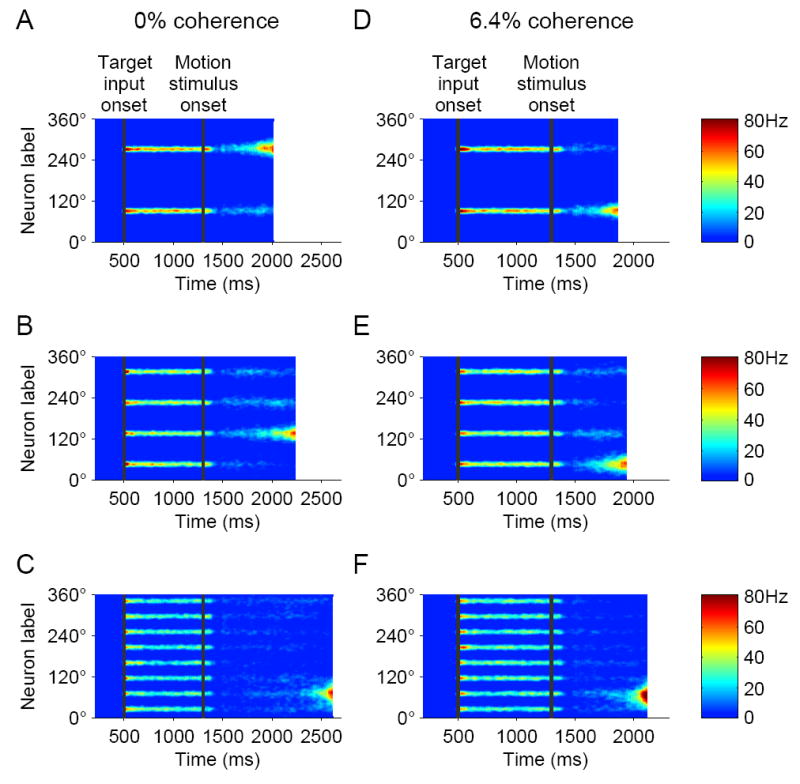
Network activity dynamics in sample simulations with 2, 4 and 8 choices, at 0% coherence (A-C) and 6.4% coherence (D-F). When the number of choices is increased, the input signal representing the targets is modified accordingly, but the motion stimulus input and all the network parameters remain unchanged. Thus, the same circuit underlies decision making in the motion discrimination task independently of the number of choices.
For the sake of simplicity, in this work we did not explicitly include a downstream motor command circuit, but used a population vector measure to readout the choice of response. Specifically, in our simulations, we calculated the activity population vector at the time a neural pool crosses a firing threshold level (which presumably triggers a motor response downstream), and selected the nearest target as the behavioral choice (see Supplemental Experimental Procedures). We also examined an alternative readout algorithm, in which a target is selected only if its angular distance from the population vector is smaller than a certain tolerance window (Supplementary Fig. 1). With the latter algorithm, performance is slightly lower, because in a fraction of trials the population vector falls outside the tolerance window. However, the results are basically similar using these two different methods. In this way, a single response (among 2, 4 or 8 options) is selected by the model, enabling us to directly compare our model with the monkey experiment in terms of both behavioral performance and single-unit neurophysiology.
The model (Fig. 3C-F) captures several physiological observations from the LIP neurons in the monkey experiment. At the onset of the visual target input, pyramidal neurons located close to one of the targets respond by an initial transient followed by a tonic response (Churchland et al., 2008; Huk and Shadlen, 2005; Roitman and Shadlen, 2002). Shortly after the onset of the motion stimulus, the model neurons show a dip in the neural response. To model the dip in response, we assume that 80ms after the motion stimulus onset, there is a drop in the efficacy of the target-input due to either a shift in covert attention from the targets to the random dots motion stimulus, or cross inhibition between upstream neurons signaling the targets and the motion stimulus (cf. Wong et al., 2007). The exact neural mechanism that causes the dip is not critical for our purpose. The important point is that it serves as a starting point for activity buildup during the decision process. The input signal representing the motion stimulus is assumed to reach the circuit after a 200ms latency following the motion stimulus onset. The decision process proceeds then in two steps: gradual ramping activity that integrates sensory input over time, followed by a categorical choice through competition between neural pools selective for the choice alternatives. Importantly, as in the monkey experiment (Churchland et al., 2008), the input signal representing the visual targets is constantly present during the decision process, to guide the network on the categorical choice options.
Note that, during presentation of the targets, activity of the inhibitory neurons is elevated relative to the spontaneous firing (Fig. 3A), partly because the activity of pyramidal neurons located around the targets causes an increase in the recurrent excitatory input to the inhibitory neurons. Moreover, as part of the simulation protocol, the inhibitory neurons receive an external excitatory input signal (feed-forward inhibition). We found that such a signal contributes to stabilizing the response of the network to the targets over time (data not shown).
Fig. 4 shows sample simulations with 2, 4 and 8 choices. When the number of choices was changed, the motion stimulus input, the decision threshold and all the network parameters remained the same. The target-input, on the other hand, depends on the number of targets and their location. In addition, we assumed that the magnitude of the control signal can vary as function of the number of choices or their angular separation, to model a flexible top-down modulation of the decision process in response to variations in task difficulty (see below). In sum, since the network represents all the directions along a circle, the same circuit can operate as a substrate for decision making in the task, independently of the number of targets or their angular directions.
Time course of ramping activity and its dependence on motion coherence
How does the strength of the sensory evidence, i.e. the coherence level, affect the decision dynamics in the network? Fig. 5A-C shows activity of neurons around the selected target (solid lines) and the opposite target (dashed lines) during correct trials with 2, 4 and 8 choices. During the decision process, the activity of neurons located around the selected target ramped up, and the build-up rate increased with the coherence level. Fig. 5D shows the buildup-rate of ramping activity (see Supplemental Experimental Procedures) as a function of coherence for simulations with 2 and 4 choices. Buildup-rates increase as a function of coherence for neurons around the selected target (Tin), and decrease for neurons at the opposite direction (Tout). Notably, in agreement with experimental findings of Churchland et al. (2008), for neurons at Tin, the dependence of the buildup rate on the motion coherence has a similar slope for 2 and 4 choices, but is shifted downward for the 4-choice task. Unlike the experimental findings, however, the model does not exhibit a significant difference between neurons located at 90° to the selected target (T90) and neurons in the opposite direction (Tout) in the 4-choice task (see Discussion).
Figure 5.
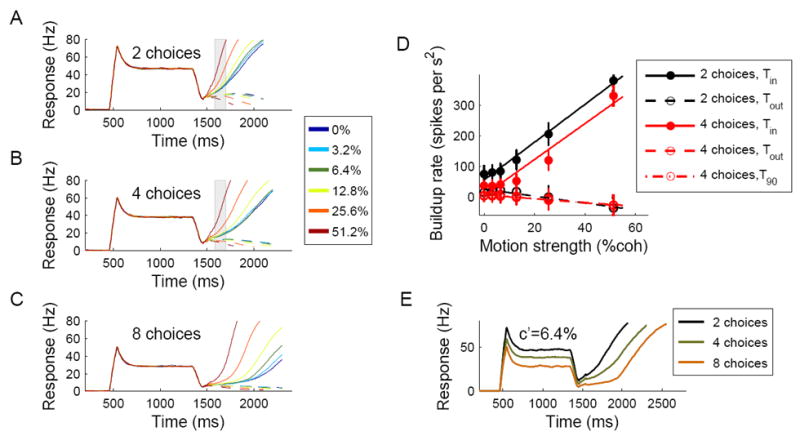
Time course of neural firing and activity buildup during the decision process. (A-C) Activity of neurons located around the selected target (solid lines) and in the opposite direction (dashed lines) during simulations with 2, 4 and 8 choices, respectively. Different colors denote different coherence levels. Each plot was obtained by averaging neural activity over 200 correct trials. (D) Activity buildup rates with 2 and 4 choices, calculated over the epoch indicated by a shaded rectangle in (A) and (B). The buildup rate for neurons located around the selected target increased quasi-linearly as a function of the coherence level. Increasing the number of choices from 2 to 4 resulted in lower buildup rates, but the slope of the buildup vs. coherence remains approximately unchanged, as observed in LIP neurons in the monkey experiment (Churchland et al., 2008). (E) Activity of neurons around the selected target during simulations with 6.4% coherence and different number of targets. Similar to findings from LIP neurons, the spiking response to the targets was reduced when the number of targets was increased, resulting in a lower dip of activity and larger excursion from baseline to threshold during motion stimulus presentation.
We tested next how changing the number of targets affects the activity patterns in the network. Fig. 5E compares the responses of neurons located around the selected target during simulations with 2, 4 and 8 choices (6.4% coherence). Increasing the number of targets reduced both the neural response to the targets and the activity level at the dip, in accordance with experimental findings (Churchland et al., 2008). Two factors contribute in our model to the reduction of response when the number of choices is increased. First, in our simulation protocol we assume that the magnitude of the target input is monotonically decreasing as function of the number of targets, presumably as a result of a normalization of neural activity in the upstream system where the target input is encoded. Second, feedback inhibition within the circuit contributes further to the modulation of response as a function of the number of targets (see Supplemental Results and Discussion).
Performance and response times
At the system level, the decision process is manifested in behavioral measures such as performance and response times. Fig. 6A shows the model’s performance, i.e. percentage of correct choices as a function of coherence level, for simulations of the 2-, 4- and 8-choice motion discrimination tasks. Each data point is based on 2500 simulation trials. At low coherence levels, performance was close to chance, and as the motion coherence increases, performance increased monotonically and approached 100% for high coherence levels. The data was fitted by a Weibull function (see Supplemental Experimental Procedures). Fig. 6B shows the simulated mean response times as a function of coherence level. For a given coherence level, performance was lower and response times were longer for a larger number of choice alternatives. Notably, the mean response time for error choices (Fig. 6B, boxes) in a given condition was longer than that of correct choices. Overall, the model reproduces all the salient characteristics of the psychometric functions observed in the monkey behavioral experiment with 2 and 4 equally distanced targets (Churchland et al., 2008), and predicts the behavioral trend for 8 choices.
Figure 6.
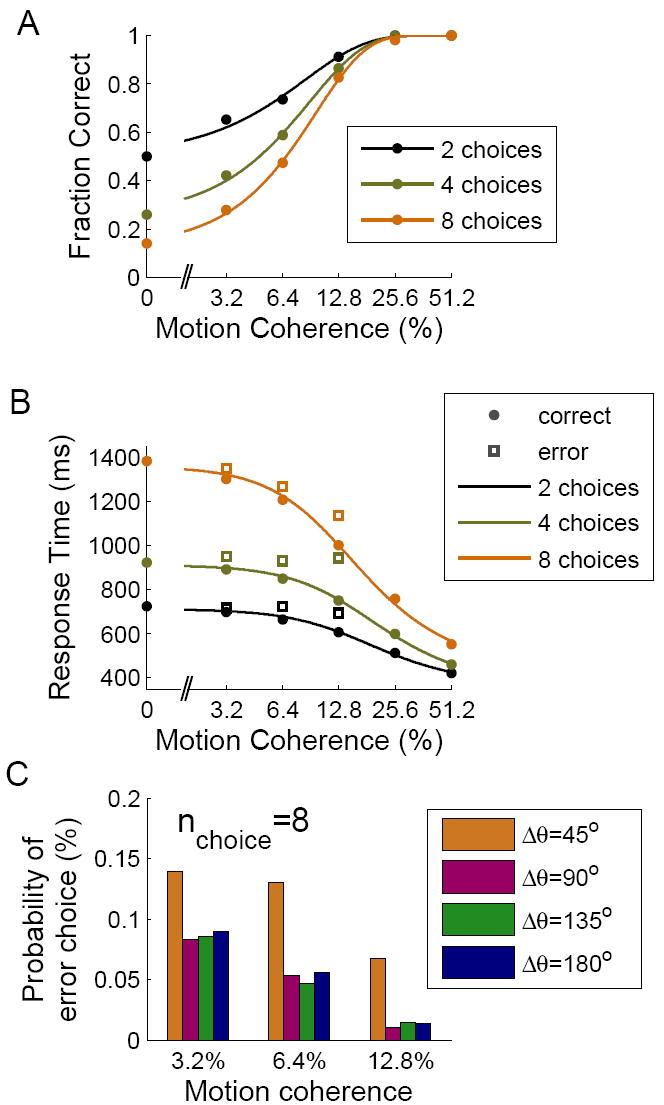
Simulated behavioral data. (A) Performance as a function of motion coherence. Except for the highest coherence levels, performance decreases with increasing number of choice options. (B) Mean response times as a function of coherence on correct (circles) and error (squares) trials. Decisions take longer times to achieve with a larger number of choice options. For (A-B), the control signal in these simulations was 6Hz, 20Hz and 16Hz for 2, 4 and 8 choices, respectively. (C) Spatial distribution of errors in simulations with 8 choices. The histograms show the probability of choosing a target at different angular distances Δθ from the correct target, at coherence levels 3.2%, 6.4% and 12.8%. Due to lateral interactions in the network, the probability of making an erroneous choice to a target adjacent to the correct one was higher than for the other targets.
For further comparison with experimental data, we simulated also a 2-choice task with targets separated by 90°. Churchland et al. (2008) found that with 90° separation, performance was similar in comparison to 180° separation, but response times were somewhat longer at low motion coherence levels. Our model also performed with the same accuracy when the separation of the two choice options is either 90° or 180°, but did not show significant differences in the reaction times under these two conditions (Supplementary Fig. 2). A possible explanation for this discrepancy will be offered in the Discussion.
Error rate as a function of the similarity between the correct and actual choice
In our model, the choice alternatives signaled by the visual targets are directional angles. If the targets are positioned at equal distances, the angular difference ΔΘ between adjacent targets decreases with a larger number of choice options (180°, 90°, 45° for 2, 4 and 8, respectively). Correspondingly, the similarity between alternatives, defined by an appropriate decreasing function of ΔΘ e.g. exp(−ΔΘ)), increases with the number of choice options. When the neural pools selective for choice targets are close to each other, interactions between them through lateral excitatory connections become important in determining the network dynamics. We wondered whether this similarity effect had observable consequences at the behavioral level. Indeed, we found that for intermediate coherence levels (between 3.2% and 12.8%), the probability of an erroneous choice in the 8 choice task depended on the location of the selected target (Fig. 6C). Specifically, the probability of making an erroneous choice to a target adjacent to the correct one was higher than for the other targets. This spatial pattern of errors provides a testable prediction that is specific to the continuous model in relation to a discrete model.
Similarity effect and overlaps in the neural representation of targets
We analyzed the effect of similarity on network dynamics when the separation between two adjacent targets is relatively small, resulting in overlap in their neural representation. In 8-choice simulations, we observed that, during the motion stimulus presentation, as the activity of neural pools located around the targets built up over time, the “growing” bumps in the network activity profile often merged with each other (49% of the trials; see Supplemental Experimental Procedures), instead of displaying winner-take-all competition (Fig. 7A, right). In other words, activity buildup is observed not only around the selected target but also at one or two of the adjacent targets (Fig. 7A, middle).
Figure 7.
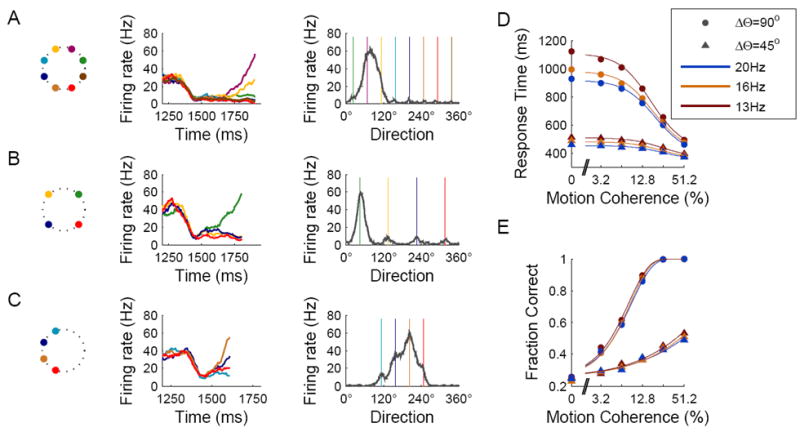
Similarity effect and overlaps in the neural representation of targets. (A-C) Responses during sample simulation with 8 targets separated by 45° (A), 4 targets separated by 90° (B), and 4 targets separated by 45° (C). Left: Schematic illustration of target locations. Middle: Activity dynamics of neural pools located around the targets (color coding as in Fig. 3). Right: Activity profile at the decision time (colored lines indicate target locations). In many of the simulations with 45° separation (panels A and C; see text) activity buildup occurred around more than one target, resulting in merging of activity-bumps around adjacent targets. (D,E) Response times (D) and performance (E) as a function of motion coherence for 4 targets separated by either 90° (dots) or 45° (triangles). In the 45° targets separation case, recurrent excitation between neural pools that were involved in merging of activity buildup resulted in acceleration of the network dynamics. Different colors denote three magnitudes of the control signal, which can be used to adjust response times and performance.
To further test the hypothesis that this phenomenon stems from overlaps in the neural representation of adjacent targets, we performed a set of simulations with 4 choice options but with targets separated by ΔΘ = 45°, and compared them with the standard 4-choice simulations (ΔΘ = 90°) (Fig. 7B, C). Indeed, in a large fraction of the trials activity buildup occurred around more than one target (93% of the trials with ΔΘ = 45°, compared to 5% with ΔΘ = 90°). Interestingly, for a given value of the control signal, response times were about twice faster in simulations with ΔΘ = 45° compared to ΔΘ = 90° (Fig. 7D). This can be explained by mutually excitatory interactions between adjacent neural pools that, with ΔΘ = 45°, display overlapping buildup activity, leading to an acceleration of the network dynamics. However, response accuracy is lower with ΔΘ = 45° (Fig. 7E), demonstrating that in the model, insufficient time integration of sensory evidence is detrimental to the decision performance. This result suggests that in order to achieve optimal behavior, a mechanism is needed to flexibly control the tradeoff between speed and accuracy, as the number and similarity of choice alternatives are varied.
Control of speed-accuracy tradeoff by a simple top-down signal
At the behavioral level, response times and performance vary in response to cognitive, top-down “instructions” (e.g. Palmer et al., 2005) or changes in the difficulty of the task (e.g., when the choices become more similar). We explored the possibility that during decision making a top-down signal projects to the decision circuit and modulates the decision process according to changing task demands. A simple and conceivable form of a top-down signal is a non-selective and time-independent input to the pyramidal neurons. We included such a control signal in our simulations and tested how it affects the decision process.
Fig. 8A, B shows the performance and response times as a function of coherence in simulations with 8 choice alternatives and a control signal of 13Hz, 16Hz and 20Hz. Increasing the magnitude of the control signal reduced response times, with an especially pronounced effect at low coherence levels. Intuitively, the elevated external drive to the pyramidal population accelerates the dynamics of the network. Surprisingly, however, increasing the control signal also resulted in lower performance at the medium range of coherence levels (3.2% to 12.8%). The reduced performance could partly result from less time-integration due to the shorter response times. Moreover, while the motion stimulus provides a selective input to neurons located around the correct target, adding a non-selective input signal reduces, in a way, the signal-to-noise ratio of the total input to neurons selective to the correct direction relative to neurons selective to other directions.
Figure 8.
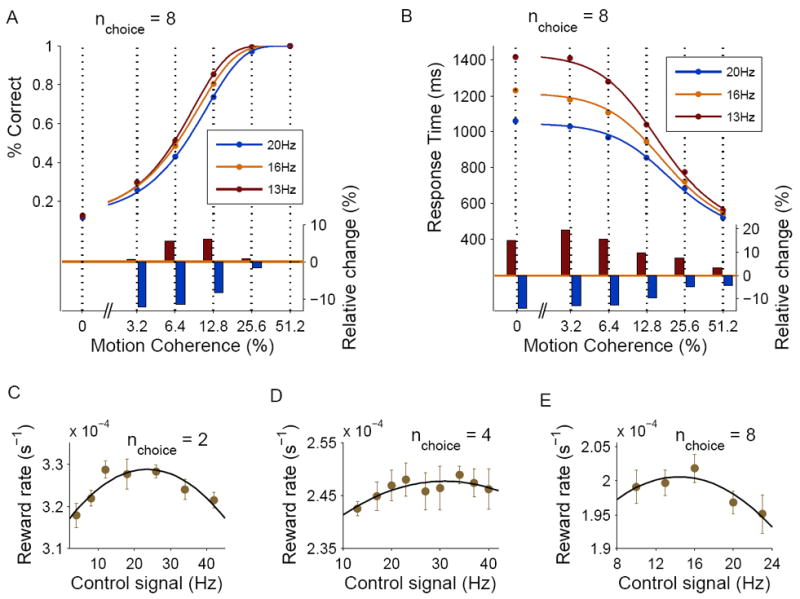
Speed-accuracy tradeoff and optimization of the decision-making process. (A) Top: Performance as a function of the motion coherence in simulations with 8 choices, for three values of the control signal. Bottom: Relative change in performance for control signals of 13Hz and 20Hz relative to 16Hz. (B) Response times as a function of the motion coherence, same conventions as in (A). (C-E) Dependence of the mean reward rate on the control signal level in simulations with 2, 4 and 8 choices respectively. The optimal control level (corresponding to maximum reward rate) has a non-monotonic dependence on the number of choice options, due to similarity effects (see text). Each point is calculated from a block of trials with a uniform distribution of coherence levels. The reward rate R is defined as R = P/T, where P is the average performance and T is the average trial time duration (see Supplemental Experimental Procedures). Error bars indicate SEM.
The fact that a stronger control signal results in faster responses but lower performance indicates that the control signal mediates, according to the model, a speed-accuracy tradeoff in the task. We tested therefore how changes in the strength of the control signal affect the overall reward rate R = P/T, where P is the average percentage of correct (and rewarded) trials and T is the average trial duration (see Supplementary Experimental Procedures). We found that for a given number of choices, the reward rate R had an inverted-U-shape as function of the control signal, suggesting that reward optimization can be achieved by tuning of the control signal.
Maximal reward rates were obtained with control signals of 24Hz, 31Hz, and 14Hz for 2, 4 and 8 choices respectively. Somewhat surprisingly, the optimal control signal is not a monotonic function of the number of choices. This non-monotonic dependence, however, can be explained by the significant similarity effect with 8 choices but not 2 or 4 choices discussed previously: The targets in the 8-choice task are separated from each other by ΔΘ = 45°, and as a result adjacent “bumps” of activity merge and lead to acceleration of the decision process. If the control signal is relatively high, the activity ramp-up is fast and performance is poor. To compensate for the accelerated dynamics, the magnitude of the control signal has to be reduced accordingly. Therefore, to ensure optimality, the level of control signal should vary non-monotonically as the number of (equally distanced) choice alternatives is increased. More generally, these results show that overlaps in the neural representations of the choice alternatives could have important effects on the decision circuit dynamics, with significant implications for reward outcomes.
DISCUSSION
A neural circuit model for multiple-choice decisions
We present here a continuous network model of spiking neurons for multiple-choice decision-making. The model is innovative in combining a relatively detailed level of biological realism and the ability to represent decision making independently of the number of choice alternatives or their angular locations (Fig. 4). Thus, the model provides a useful platform to study, within one unifying framework, how changing the number of choices affects subjects’ response times and performance, and to inquire about the underlying synaptic mechanisms.
We found that this model accounts successfully for a wide-range of behavioral and physiologically data from the motion discrimination task (Figs 5, 6) and provides specific testable experimental predictions, in particular about the pattern of error rates as a function of the similarity between the selected and correct target. Interestingly, this model reveals similarity effects at both the neuronal and behavioral levels. Namely, overlaps in the neural representation of similar choice alternatives greatly affect the network activity patterns, speeding up ramping activity and hence response times, but leading to poorer performance with higher error rates for those choices closest to the correct option. To effectively handle such similarity effects and optimize their overall performance, subjects have to adapt their responses in the task. We propose a simple mechanism for such flexible control of performance, based on a top-down projection to the decision circuit that can mediate a speed-accuracy tradeoff (Fig. 8).
From a discrete to a continuous recurrent attractor network
In recent years, neurophysiological studies have revealed decision-correlated neural activity in various brain areas, including LIP (Shadlen and Newsome, 2001), the frontal-eye-fields (Schall and Hanes, 1993), dorsolateral prefrontal cortex (Kim and Shadlen, 1999), frontoparietal cortex (Cisek and Kalaska, 2005) and medial premotor cortex (Romo et al., 1997). Notably, in the same brain areas, persistent activity is commonly observed during delay periods of working memory tasks (Funahashi et al., 1989; Gnadt and Andersen, 1988), suggesting a role for attractor network dynamics as the neural substrate for both processes.
Previous work from our lab (Wang, 2002; Wong and Wang, 2006; Wong et al., 2007; Wang, 2008) has shown that attractor dynamics in a biophysically based model is not only suitable for winner-take-all competition underlying categorical choice, but is also compatible with slow transients required for graded temporal integration of sensory inputs. In fact, strong recurrent synaptic circuitry represents a leading candidate mechanism for realizing a long integration time constant (up to ~1s) beyond typical neuronal and synaptic time constants (10-100ms).
To model two-choice decision making tasks, previous attractor models represented the choice alternatives by two separate and homogeneous neural populations (a discrete model) (Wang, 2002; Wong and Wang, 2006; Wong et al. 2007). In the present study we generalize the attractor network framework to multiple-choice decisions by using a line-attractor network, capable of representing a continuum of directions of motion. Our circuit is based on a model originally developed for mnemonic delay-period activity in spatial working memory (Compte et al., 2000) and later elaborated in several ways (Carter and Wang, 2007; Renart et al., 2003; Tegner et al., 2002; Wang et al., 2004). Thus, the model not only represents decision related dynamics but can also support, in a natural way, storage of the decision result in the form of persistent activity. Whether LIP indeed behaves as an attractor network remains an open question (Ganguli et al, 2008; Wang, 2008). The mechanism proposed here is concerned with a local circuit and may well be realized in other cortical areas such as the prefrontal cortex.
Fluctuating neural activity patterns underlying trial-by-trial stochastic decisions
At a conceptual level, our work contrasts with some other studies regarding the computational interpretation of the activity pattern that develops on each trial and the stochastic variation of these patterns from trial to trial. In our model, a decision is made in the form of a bell-shaped “bump” activity pattern. With two or more choice targets, such a bump develops stochastically and its peak location varies among possible choice targets in different trials, with probabilities that depend on the motion coherence level. This contrasts with an alternative view in which, on a single trial, a bump activity profile explicitly represents a probability density function about a continuous range of possible choices, from which a categorical decision is readout by a Bayesian decoder (Ma et al., 2006; Beck et al., 2008). Our work suggests that explicit representation of probability densities by neurons might not be necessary. Instead, probabilistic perceptual decisions can be made by fluctuating neural spatiotemporal dynamics on a trial-by-trial basis (Wang, 2008).
Neural dynamics of multiple-choice decision making
Our simulations reproduce salient findings from single-unit recordings in LIP during the monkey experiment of Churchland et al., 2008 (Fig. 5). Neurons located close to one of the targets respond vigorously to the presence of the targets even before the onset of the motion stimulus. When the motion stimulus is presented, activity drops to a dip which serves as a starting point for the decision-related dynamics. Such a dip in neural activity was observed in a number of brain areas (Huk and Shadlen, 2005; Sato and Schall, 2001) and has been suggested to “reset” the integration process. During the decision process, neurons located around the selected target exhibit quasi-linear ramping activity, with a ramping rate which is monotonically increasing with coherence level (Fig. 5D).
Our simulation results differ from the experimental findings in relation to the activity of neurons selective to directions orthogonal to the selected target in the 4-choice task. Churchland et al. (2008) found that at high coherence levels, neurons orthogonal to the selected targets showed a higher buildup rate than neurons located opposite to the selected target. Such a difference is not observed in our simulations. This discrepancy may hint at a possible role of structured inhibition in a putative decision circuit like LIP. While in our model, for the sake of simplicity, inhibition was assumed to be uniform hence the same across the network, it is likely that in the LIP circuit the connectivity from inhibitory interneurons to excitatory pyramidal cells is structured, so that synaptic inhibition is different for pyramidal cells located at 90° and 180° relative to the selected target. Inclusion of structured lateral inhibition in our LIP model could also account for the differences in the reaction times observed in the monkey experiment when two targets were separated by 90° versus 180°. This hypothesis should be tested in future experimental and computational studies.
In our simulations, the target-input is active during the decision process, to model the fact that the targets remain on screen during presentation of the motion stimulus in the monkey experiment. Thus, even at the 0% coherence case, where the motion stimulus is non-selective, the target-input induces a bias for activity ramp-up to emerge around one of the targets. More generally, since a neural circuit underlying multiple-choice decision making is unlikely to be rewired or reconstructed according to the number of targets, which may vary from trial to trial, such a circuit requires a combined representation of the choice alternatives and the sensory information on which the decision should be based, presumably in the form of input signals projecting to the circuit.
The selected target in a given trial was determined in our model using a population-vector decoding of the neural activity at the time of threshold crossing (see Supplemental Experimental Procedures). The question of how a broad profile of activity is realistically “translated” into a categorical choice is an important goal for future research. A possible mechanism is a downstream continuous circuit, where movement neurons fire in an all-or-none fashion, triggering a behavioral response when the synaptic drive from the decision circuit exceeds a critical threshold (see below).
Buildup of neural activity with a neutral sensory input
The 0% coherence condition, where the sensory input is neutral, raises important conceptual issues about the decision dynamics. In bounded-accumulation models, a neutral input implies a zero drift rate, and therefore the unconditioned average activity is flat over time. The neurophysiological data, in contrast, shows a ramping firing activity, averaged across all trials, even at 0% coherence (Churchland et al. 2008; Roitman and Shadlen, 2002). Consequently, some studies suggested a modified accumulation model, involving a time-varying mechanism (“urgency signal”) that causes decisions to terminate as time elapses, regardless of the sensory evidence (Churchland et al., 2008; Ditterich, 2006). How such a mechanism is implemented physiologically, however, is not clear. Furthermore, in the context of multiple choice decisions, fitting the behavioral data by this kind of approach required modification of the urgency signal according to the number of choices, resulting in different time-constants and magnitudes of the urgency signal for 2- and 4-choices (Churchland et al., 2008). In contrast, our model reproduces both ramping firing activity at 0% coherence and the behavioral data for 2- and 4-choices without need for time-dependent signals or a decaying bound. Our model suggests that instead of an urgency signal, a functionally equivalent effect can naturally arise from accelerated ramping activity in a strongly recurrent cortical local circuit.
Comparison with behavioral data
Our model reproduces salient characteristics of the psychometric functions observed in the monkey behavioral experiment (Fig. 6A, B). Although the simulation protocol contains several parameters, the number of free parameters that were adjusted to fit the behavioral data is small and, importantly, the intrinsic properties of the network itself were fixed and were not changed to fit the data. Some of the parameters in the protocol were constrained by experimental findings and were not changed between simulations (see Experimental Procedures), including the threshold for decision and the motion stimulus. Other parameters, such as those related to target-input during target viewing, were adjusted to capture neural firing-rates in area LIP before the onset of the motion stimulus, but these details are not essential as they do not substantially affect the network decision behavior (e.g. the psychometric curves) (Supplementary Fig. 3). The behavioral data was fitted by adjusting (1) the strength of the target-input during motion stimulus presentation (hence the decision process) and (2) the control signal. The control signal was modified based on the assumption that subjects use some form of internal adjustment in reaction to changes in the number of choices (and hence the difficulty of the task). The values of the control signal that were used to best fit the experimental data (Fig. 6) were close to, but did not coincide, with the ones that yield maximum reward rates (Fig. 8). However, near the optimal control signal level, the reward-rate vs. control signal curve is fairly shallow (Fig. 8), hence the overall reward rate corresponding to the behaviorally-fitted control signal level is not much different from optimality.
Notably, the model predicts longer response-times on error trials than on correct trials, in accordance with experimental findings from the monkey experiments (Churchland et al., 2008; Roitman and Shadlen, 2002). In the context of a two-choice task and a discrete attractor network, Wong and Wang (2006) used a mean-field reduction of the model and phase-plain analysis of the system dynamics to show that during error trials the system’s trajectory in the decision space travels across a boundary of attraction basins. The dynamics near the boundary is relatively slow, resulting in longer response times. We think that the same principle applies to a line attractor network, but a full analysis of this issue for a continuous circuit model is beyond the scope of the present study.
Changing the number of choices: implications on response times
Our model enables a systematic study, within a biophysically realistic scenario, of how changing the number of choice options affects response times in the task. Generally, the decision time depends on the starting point of the accumulation process, the decision threshold, and the slope of the activity build-up during the decision process, as discussed below.
In our simulations, increasing the number of targets reduces the firing rate at the beginning of the decision process (Fig. 5E). This agrees with experimental findings from LIP (Churchland et al., 2008) and resembles the inverse relationship between firing rates and the number of saccade targets for selection in the superior colliculus (SC) (Basso and Wurtz, 1998). We showed that in the model, the reduced response stems in part from the recurrent connections within the network: Increasing the number of choices recruits more strongly the inhibitory population, which in turn attenuates the activity of the pyramidal neurons (see Supplemental Results). In addition, we assumed that the input to LIP representing the visual targets is smaller when the number of targets is increased. Such a normalization of the target-input could be caused by suppressive surround interactions in lower visual areas upstream from LIP, or by top-down projections signaling the increased uncertainty associated with a larger number of targets.
On basis of experimental findings, we assumed that the threshold for decision depends neither on coherence level nor on the number of choices. Yet due to the changes in the starting point, the excursion from baseline to threshold in our simulations increases moderately with the number of choices (47Hz, 51Hz, 55Hz for 2, 4, and 8 choices respectively), explaining in part the difference in response times between trials with 2, 4 and 8 choices. The relatively moderate increase in excursion in our model, that compares directly with the neurophysiological data (Churchland et al., 2008), contrasts with some of the accumulator models of multiple choice decision making, in which large changes in the threshold are used to compensate for changes in the number of choice alternatives (Usher et al., 2002; Bogacz et al., 2007).
Finally, the average slope of the activity ramp-up during the decision process depends on two factors that have opposing effects. As long as the similarity effect is not significant, increasing the number of choice alternatives (e.g. from 2 to 4) recruits more strongly the inhibitory population in the network, resulting in slower dynamics and a more moderate slope of activity build-up (Fig. 5D). On the other hand, when choice alternatives become sufficiently similar (e.g. from 4 to 8 choice alternatives), overlap and lateral interactions between neural pools representing adjacent choice targets lead to an acceleration of ramping activity and faster response times. Importantly, the ramping slope can also be sensitively tuned by the control signal, as discussed in more detail below (“A flexible control mechanism for speed-accuracy tradeoff”).
Similarity between choice alternatives and overlaps in their neural representation
Similarity plays an important role in classification or categorization decisions (Ashby and Perrin, 1988; Kahana and Bennett, 1994; Nosofsky, 1986; Nosofsky, 1997; Tversky, 1977). To our knowledge, the present study is the first to examine the neural circuit underpinning of similarity in categorical decision making.
The continuous line-attractor approach allowed us to study the implications of overlaps in the neural representation of the different choice alternatives. Neurons in the posterior parietal cortex have relatively wide tuning for direction of saccade direction (Chafee and Goldman-Rakic, 1998; Shadlen and Newsome, 2001). Accordingly, in our model a specific direction of movement is represented by a distributed bell-shaped population response. When the targets are separated by 45°, the neural representation of adjacent targets is partially overlapping. We found that similarity between choice alternatives has an observable behavioral effect, namely the probability of making an error in the 8-choice simulations is higher for those alternatives more similar to the correct one (Fig. 6C). This prediction is specific to the continuous model but not to a discrete model, and is experimentally testable.
Moreover, when choice alternatives are similar, with overlapping neural representations, the “bumps” of activity located around adjacent targets merge in many of the simulation trials. This is reminiscent of a previous observation, in the context of working memory, of the network behavior in response to two input stimuli (a cue and a distractor). The network dynamics is governed by winner-take-all competition when the inputs are far apart, but by vector-averaging (with the peak of the network activity profile intermediate between the two input locations) when the stimuli are close to each other (Compte et al., 2000). In our decision making simulations, this effect resulted in faster dynamics and shorter response times. To study the effect of targets separation while controlling for the confounding factor of number of targets, we performed simulations with 4 targets separated form each other by either 90° or 45°. 45° separation resulted both in activity merging between adjacent bumps and faster response times compared to 90° separation. It would be interesting to test experimentally the model’s predictions for the 4-choice task with 45° separation.
At angular differences smaller than 45° and close to the threshold for direction discrimination, significant overlaps in the neural representations of the choices emerge. It has been argued that during fine discriminations, downstream systems should pool direction-selective MT neurons with a weighting profile shifted away from the two alternatives (Hol and Treue, 2001; Jazayeri and Movshon, 2006; Purushothaman and Bradley, 2005). The biophysical processes that underlie decision making involving fine discrimination are unknown and remain to be elucidated in future research.
A flexible control mechanism for speed-accuracy tradeoff
We tested how a top-down, non-selective and time-independent input to the pyramidal neurons (“control” signal) affects the decision process in the model. We found that increasing the magnitude of the control signal accelerates the dynamics in the network and results in shorter response times, but interestingly, also reduces the performance. Therefore, the control signal mediates a speed-accuracy tradeoff that has been observed experimentally in several tasks (Hale, 1969; Palmer et al., 2005; Reddi and Carpenter, 2000; Wickelgren, 1977). Our model provides quantitative and experimentally testable predictions about the relative change in performance for a given amount of change in response times (and vice versa). We also showed that the reward rate in the simulations has an inverted U-shaped dependence on the magnitude of the control signal, suggesting that such a control signal may be tuned to optimize overall performance in the task (Gold and Shadlen, 2002).
A commonly held idea is that a speed-accuracy tradeoff is achieved by modifications of the decision threshold (e.g., Ratcliff, 1978). Controlling the threshold is plausible from the biological point of view (Lo and Wang, 2006), but seems to require modifications of synaptic efficacies, which is a gradual and relatively slow process. In addition, the actual activity threshold is limited by the dynamical range of physiological neurons. Since the control signal proposed here is implemented in the form of an input projection to the network, it does not require modifications of synaptic weights, and enables a more rapid and flexible reaction to changing task demands.
In conclusion, the present work addressed a key computational stage during multiple-choice decision-making, where interactions of potentially overlapping neural pools lead to formation of a choice. Our findings provide further support for the role of attractor neural dynamics as a general mechanism for accumulation of sensory evidence over time, decision making and storage of a choice in working memory. The model can be extended in the future in several important ways. For instance, our model does not deal explicitly with the read-out of the decision result and generation of eye movement. Lo and Wang (2006), using a discrete network, proposed that burst firing of movement neurons in the SC may be triggered when excitatory synaptic input from ramping cortical neurons exceeds a threshold. Generalizing this concept to a continuous network is worthwhile in the future. In addition, the model could be extended to include a reciprocal loop between a decision circuit and a control area, presumably residing in the prefrontal cortex, to explore the precise mechanism through which a top-down control signal is internally generated and flexibly adjusted based on performance monitoring in multiple-choice decision making processes.
EXPERIMENTAL PROCEDURES
The network model was adapted from Compte et al. (2000) to simulate a local circuit in LIP. It is composed of NE = 2048 excitatory pyramidal neurons and NI = 512 inhibitory interneurons. The network architecture is based on a columnar organization. The pyramidal neurons are directionally tuned and are spatially organized along a ring according to their preferred direction, uniformly covering all angles between 0° and 360°.
Neurons
Both pyramidal cells and interneurons are modeled as leaky integrate-and-fire neurons (e.g. Tuckwell, 1988) and are characterized by a resting potential of VL = −70mV, a firing threshold Vth = −50mV, a reset potential Vreset = −55mV, a membrane capacitance Cm = 0.5nF for pyramidal cells and Cm = 0.2nF for interneurons, a membrane leak conductance gL = 25nS for pyramidal cells and gL = 20nS for interneurons, and a refractory period τref = 2ms for pyramidal cells and τref = 1ms for interneurons. The sub-threshold membrane potential V(t) obeys
| (1) |
where Isyn(t) is the total synaptic current flowing into the cell. Interactions between the model neurons are represented by conductance-based synaptic responses, described by realistic synaptic kinetics.
Synaptic interactions
The network is endowed with recurrent connections between all its neurons. The pyramid-to-pyramid connections are directionally-tuned: iso-directional connections are stronger than cross-directional ones (see Recurrent Connectivity). The connectivity to and from the inhibitory pool is homogeneous and does not depend on the particular neuron been targeted.
Recurrent excitatory postsynaptic currents (EPSCs) are mediated by AMPA and NMDA receptors, while recurrent inhibitory postsynaptic currents (IPSCs) are mediated by GABAA receptors. Neurons also receive external AMPA-mediated excitatory synaptic inputs, representing sensory information processed by other brain areas, as well as background noise due to spontaneous activity outside the local network.
The total synaptic current to an excitatory neuron i is
| (2) |
where the first three terms represent recurrent projections from excitatory (E) and inhibitory (I) neurons (see Recurrent Connectivity), represents external task-related input signals (see Simulation Protocol), and represents background noise (see Background Noise). Similarly, for the inhibitory neurons,
| (3) |
AMPA-, NMDA- and GABA-mediated synaptic currents are modeled by
| (4) |
| (5) |
| (6) |
respectively, where VE = 0mV, VI = −70mV. NMDA currents have a voltage dependence that is controlled by extracellular magnesium concentration (Jahr and Stevens, 1990), [Mg2+] = 1mM. s̄i is a synaptic gating variable. For the recurrent connections, s̄i is given by
| (7) |
where the index j runs over the presynaptic neurons, wij is the connectivity strength between the presynaptic neuron j and the postsynaptic neuron i, and sj depends on the spikes of the presynaptic neuron j (see below). For the external inputs, s̄i is determined independently for each neuron (s̄i = si) according to the spike train that represents the external input to the neuron.
Given a spike train {tk}, for AMPA and GABAA receptor mediated currents, the gating variable s (i.e., the fraction of open channels) is determined by
| (8) |
and for NMDA mediated currents by
| (9) |
with αs = 0.5kHz and τx = 2ms. The decay time constant τs is 2ms for AMPA, 100ms for NMDA, and 10ms for GABAA.
Background noise
All cells receive a background AMPA mediated input, modeled as uncorrelated Poisson spike trains to each neuron at a rate of νBack = 1700Hz per cell, with maximum conductance gBack→E = 2.93nS and gBack→I = 2.25nS to the pyramidal and inhibitory neurons respectively.
Recurrent connectivity
The connectivity strength wij between two pyramidal cells depends on the difference between their preferred directions θi and θj:
| (10) |
with J+ = 1.73 and σω = 12.76°. J− is determined using the normalization condition
| (11) |
The connectivity strength to or from the inhibitory neurons are uniform, and given by
| (12) |
where N is the number of presynaptic neurons.
The maximum recurrent synaptic conductances (in μS) were , , , , , . With these parameter values, NMDAR channels contribute 85.6% to recurrent excitation charge entry at a holding potential of −65mV. Three features are worth noting. First, recurrent excitation is taken to be primarily mediated by NMDARs (Wang, 1999). Second, the network is dominated by recurrent inhibition (Compte et al., 2000). Third, neurons receive a large amount of background noise.
The recurrent synaptic interactions in the model have heterogeneous transmission latencies. The latencies of projections from excitatory neurons to both excitatory and inhibitory neurons were drawn from a Gaussian distribution with a mean value of 1.5ms and SD of 0.5ms (Markram et al., 1997). Similarly, the latencies of all projections originating from inhibitory neurons were drawn from a Gaussian distribution with a mean of 0.3ms and SD of 0.1ms (Bartos et al., 2001).
Simulation protocol
We constructed a simulation protocol to model the multiple-choice motion discrimination task of Churchland et al. (2008) (Fig. 2). The protocol consists of external input signals to the model neurons. The pyramidal neurons receive three external inputs, representing the visual targets, the motion stimulus, and a modulatory control signal, respectively. The total synaptic inputs to pyramidal cell i is accordingly
| (13) |
where , , and are governed by equation (4), with maximal conductances gTar = 11.4 μS, gStim = 4μS and gControl = 7.5 μS respectively. The corresponding synaptic gate variables , and are determined by equation (8), where the presynaptic spikes are modeled as Poisson spike trains with rates , and described in the following.
The target input projects selectively to pyramidal neurons located around the targets. The rate depends on the preferred direction θi of the neuron been targeted and varies with time:
| (14) |
where ntar is the number of targets, is the direction of the kth target, and σtar = 10°. αntar is a coefficient that represents suppression of the target-input to LIP associated with increasing the number of targets, and is equal to 1, 0.85 and 0.75 for 2, 4 and 8 targets, respectively. Finally, the time-dependent element h(t) is described by (cf. Wong et al., 2007)
| (15) |
where t0 = 500ms and t1 = 1300ms are the onset times for the targets and the motion stimulus inputs, respectively. The time course of h(t) aims to model spike-rate adaptation of the input neurons representing the targets following the onset of the targets, as well as suppression of the input representing the targets following the onset of the motion stimulus, to account for a dip in the activity as observed experimentally (Roitman and Shadlen, 2002; Huk and Shadlen, 2005). We used τ1 = 50ms and τ2 = 15ms. The parameters A1 and A2 determine the magnitude of the target-input before the onset of the motion stimulus, and were adjusted to capture experimental firing-rates of LIP neurons (Fig. 5). Performance and response times, however, are robust to changes in A1 and A2 (Supplementary Fig. 3). A3 determines the magnitude of the target-input during the decision process. A3 affects directly the psychometric functions and was adjusted to fit experimental behavioral data. We used A1 = 320, A2 = 256, A3 = 25.
The motion stimulus input was constructed based on tuning properties of MT neurons (Britten et al. 1993; Britten and Newsome, 1998). Specifically, the directional tuning of MT neurons to random-dot stimuli can be approximated by a Gaussian function, with a tuning width which is largely independent of coherence level. In addition, responses are approximately linear as function of coherence, with slopes that are about four times higher for motion in the preferred direction than for the null direction. Finally, most MT neurons are moderately responsive to 0% random-dot stimuli. Accordingly, we modeled the motion stimulus input by
| (16) |
where c’ (0 ≤ c’≤1) denotes the stimulus coherence and θstim is the coherent motion direction. We used r0 = 20Hz, r1 = 20Hz, r2 = 100Hz and σstim = 40°.
We also included in the simulations a time-invariant and non-selective “control” signal that was active from the motion stimulus onset (t = 1500ms) on. Its firing rate νControl varied between simulations (see text).
The inhibitory neurons receive one external input signal during the targets presentation:
| (17) |
where is governed by equation (4), with maximal conductance gTar = 8μS. sFFinh is determined by a presynaptic Poisson spike train with rate νFFinh (t) that depends on time but neither on the neuron been targeted nor on the number of targets:
| (18) |
with t0 and t1 as described for equation (15). The time course this input parallels that of the target-input to the pyramidal neurons, to mimic spike-rate adaptation in the input neurons projecting to the network following the onset of the targets. We used B1 = 128 and B2 = 102.
Supplementary Material
Acknowledgments
This work was supported by NIH grant 2-R01-MH062349 and the Swartz Foundation.
Footnotes
Publisher's Disclaimer: This is a PDF file of an unedited manuscript that has been accepted for publication. As a service to our customers we are providing this early version of the manuscript. The manuscript will undergo copyediting, typesetting, and review of the resulting proof before it is published in its final citable form. Please note that during the production process errors may be discovered which could affect the content, and all legal disclaimers that apply to the journal pertain.
References
- Ashby FG, Perrin NA. Toward a unified theory of similarity and recognition. Psychological Review. 1988;95:124–150. [Google Scholar]
- Bartos M, Vida I, Frotscher M, Geiger JRP, Jonas P. Rapid signaling at inhibitory synapses in a dentate gyrus interneuron network. Journal of Neuroscience. 2001;21:2687–2698. doi: 10.1523/JNEUROSCI.21-08-02687.2001. [DOI] [PMC free article] [PubMed] [Google Scholar]
- Basso MA, Wurtz RH. Modulation of neuronal activity in superior colliculus by changes in target probability. Journal of Neuroscience. 1998;18:7519–7534. doi: 10.1523/JNEUROSCI.18-18-07519.1998. [DOI] [PMC free article] [PubMed] [Google Scholar]
- Beck JM, Ma WJ, Kiani R, Hanks T, Churchland AK, Roitman J, Shadlen MN, Latham PE, Pouget A. Probabilistic population codes for Bayesian decision making. Neuron. 2008 doi: 10.1016/j.neuron.2008.09.021. in press. [DOI] [PMC free article] [PubMed] [Google Scholar]
- Ben-Yishai R, Bar-Or RL, Sompolinsky H. Theory of orientation tuning in visual cortex. Proceedings of the National Academy of Sciences USA. 1995;92:3844–3848. doi: 10.1073/pnas.92.9.3844. [DOI] [PMC free article] [PubMed] [Google Scholar]
- Bogacz R, Brown E, Moehlis J, Holmes P, Cohen JD. The physics of optimal decision making: A formal analysis of models of performance in two-alternative forced choice tasks. Psychological Review. 2006;113:700–765. doi: 10.1037/0033-295X.113.4.700. [DOI] [PubMed] [Google Scholar]
- Bogacz R, Usher M, Zhang J, McClelland JL. Extending a biologically inspired model of choice: multi-alternatives, nonlinearity and value-based multidimensional choice. Philosophical Transactions of the Royal Society B. 2007;362:1655–1670. doi: 10.1098/rstb.2007.2059. [DOI] [PMC free article] [PubMed] [Google Scholar]
- Britten KH, Newsome WT. Tuning bandwidths for near-threshold stimuli in Area MT. Journal of Neurophysiology. 1998;80:762–770. doi: 10.1152/jn.1998.80.2.762. [DOI] [PubMed] [Google Scholar]
- Britten KH, Shadlen MN, Newsome WT, Movshon JA. Responses of neurons in macaque MT to stochastic motion signals. Visual Neuroscience. 1993;10:1157–1169. doi: 10.1017/s0952523800010269. [DOI] [PubMed] [Google Scholar]
- Camperi M, Wang X-J. A model of visuospatial working memory in prefrontal cortex: recurrent network and cellular bistability. Journal of Computational Neuroscience. 1998;5:383–405. doi: 10.1023/a:1008837311948. [DOI] [PubMed] [Google Scholar]
- Carter E, Wang X-J. Cannabinoid-mediated disinhibition and working memory: dynamical interplay of multiple feedback mechanisms in a continuous attractor model of prefrontal cortex. Cerebral Cortex. 2007;17:i16–i26. doi: 10.1093/cercor/bhm103. [DOI] [PubMed] [Google Scholar]
- Chafee MV, Goldman-Rakic PS. Matching patterns of activity in primate prefrontal area 8a and parietal area 7ip neurons during a spatial working memory task. Journal of Neurophysiology. 1998;79:2919–2940. doi: 10.1152/jn.1998.79.6.2919. [DOI] [PubMed] [Google Scholar]
- Churchland AK, Kiani R, Shadlen MN. Decision-making with multiple alternatives. Nature Neuroscience. 2008;11:693–702. doi: 10.1038/nn.2123. [DOI] [PMC free article] [PubMed] [Google Scholar]
- Cisek P. Integrated neural processes for defining potential actions and deciding between them: a computational model. Journal of Neuroscience. 2006;26:9761–9770. doi: 10.1523/JNEUROSCI.5605-05.2006. [DOI] [PMC free article] [PubMed] [Google Scholar]
- Cisek P, Kalaska JF. Neural correlates of reaching decisions in dorsal premotor cortex: specification of multiple direction choices and final selection of action. Neuron. 2005;45:801–814. doi: 10.1016/j.neuron.2005.01.027. [DOI] [PubMed] [Google Scholar]
- Compte A, Brunel N, Goldman-Rakic PS, Wang X-J. Synaptic mechanisms and network dynamics underlying spatial working memory in a cortical network model. Cerebral Cortex. 2000;10:910–923. doi: 10.1093/cercor/10.9.910. [DOI] [PubMed] [Google Scholar]
- Deco G, Rolls ET. Decision-making and Weber’s law: a neurophysiological model. European Journal of Neuroscience. 2006;24:901–916. doi: 10.1111/j.1460-9568.2006.04940.x. [DOI] [PubMed] [Google Scholar]
- Ditterich J. Evidence for time-variant decision making. European Journal of Neuroscience. 2006;24:3628–3641. doi: 10.1111/j.1460-9568.2006.05221.x. [DOI] [PubMed] [Google Scholar]
- Douglas RJ, Martin KAC. Neuronal circuits of the neocortex. Annual Review of Neuroscience. 2007;27:419–451. doi: 10.1146/annurev.neuro.27.070203.144152. [DOI] [PubMed] [Google Scholar]
- Erlhagen W, Schöner G. Dynamic field theory of movement preparation. Psychological Review. 2002;109:545–572. doi: 10.1037/0033-295x.109.3.545. [DOI] [PubMed] [Google Scholar]
- Frank MJ, Claus ED. Anatomy of a decision: Striato-orbitofrontal interactions in reinforcement learning, decision making, and reversal. Psychological Review. 2006;113:300–326. doi: 10.1037/0033-295X.113.2.300. [DOI] [PubMed] [Google Scholar]
- Funahashi S, Bruce CJ, Goldman-Rakic PS. Mnemonic coding of visual space in the monkey’s dorsolateral prefrontal cortex. Journal of Neurophysiology. 1989;61:331–349. doi: 10.1152/jn.1989.61.2.331. [DOI] [PubMed] [Google Scholar]
- Ganguli S, Bisley JW, Roitman JD, Shadlen MN, Goldberg ME, Miller KD. One-dimensional dynamics of attention and decision making in LIP. Neuron. 2008;58:15–25. doi: 10.1016/j.neuron.2008.01.038. [DOI] [PMC free article] [PubMed] [Google Scholar]
- Georgopoulos AP, Kalaska JF, Caminiti R, Massey JT. On the relations between the direction of two-dimensional arm movements and cell discharge in primate motor cortex. Journal of Neuroscience. 1982;2:1527–1537. doi: 10.1523/JNEUROSCI.02-11-01527.1982. [DOI] [PMC free article] [PubMed] [Google Scholar]
- Glimcher PW. The neurobiology of visual-saccadic decision making. Annual Review of Neuroscience. 2003;26:133–179. doi: 10.1146/annurev.neuro.26.010302.081134. [DOI] [PubMed] [Google Scholar]
- Gnadt JW, Andersen RA. Memory related motor planning activity in posterior parietal cortex of macaque. Experimental Brain Research. 1988;70:216–220. doi: 10.1007/BF00271862. [DOI] [PubMed] [Google Scholar]
- Gold JI, Shadlen MN. Banburismus and the brain: Decoding the relationship between sensory stimuli, decisions, and reward. Neuron. 2002;36:299–308. doi: 10.1016/s0896-6273(02)00971-6. [DOI] [PubMed] [Google Scholar]
- Gold JI, Shadlen MN. The neural basis of decision making. Annual Review of Neuroscience. 2007;30:535–574. doi: 10.1146/annurev.neuro.29.051605.113038. [DOI] [PubMed] [Google Scholar]
- Goldman-Rakic PS. Cellular basis of working memory. Neuron. 1995;14:477–485. doi: 10.1016/0896-6273(95)90304-6. [DOI] [PubMed] [Google Scholar]
- Grossberg S, Pilly PK. Temporal dynamics of decision-making during motion perception in the visual cortex. Vision Research. 2008;48:1345–1373. doi: 10.1016/j.visres.2008.02.019. [DOI] [PubMed] [Google Scholar]
- Hale DJ. Speed-error trade-off in a three-choice serial reaction task. Journal of Experimental Psychology. 1969;81:428–435. doi: 10.1080/14640746708400082. [DOI] [PubMed] [Google Scholar]
- Hansel D, Mato G, Meunier C, Neltner L. On numerical simulations of integrate-and-fire neural networks. Neural Computation. 1998;10:467–483. doi: 10.1162/089976698300017845. [DOI] [PubMed] [Google Scholar]
- Heekeren HR, Marrett S, Ungerleider LG. The neural systems that mediate human perceptual decision making. Nature Reviews Neuroscience. 2008;9:467–479. doi: 10.1038/nrn2374. [DOI] [PubMed] [Google Scholar]
- Hick WE. On the rate of gain of information. Quarterly Journal of Experimental Psychology. 1952;4:11–26. [Google Scholar]
- Hol K, Treue S. Different populations of neurons contribute to the detection and discrimination of visual motion. Vision Research. 2001;41:685–689. doi: 10.1016/s0042-6989(00)00314-x. [DOI] [PubMed] [Google Scholar]
- Huk AC, Shadlen MN. Neural activity in macaque parietal cortex reflects temporal integration of visual motion signals during perceptual decision making. Journal of Neuroscience. 2005;25:10420–10436. doi: 10.1523/JNEUROSCI.4684-04.2005. [DOI] [PMC free article] [PubMed] [Google Scholar]
- Jahr CE, Stevens CF. Voltage dependence of NMDA-activated macroscopic conductances predicted by single-channel kinetics. Journal of Neuroscience. 1990;10:3178–3182. doi: 10.1523/JNEUROSCI.10-09-03178.1990. [DOI] [PMC free article] [PubMed] [Google Scholar]
- Jazayeri M, Movshon JA. Precision pooling predicts primate perceptual performance. Nature Neuroscience. 2006;9:690–696. doi: 10.1038/nn0105-12. [DOI] [PubMed] [Google Scholar]
- Kahana MJ, Bennett PJ. Classification and perceived similarity of compound gratings that differ in relative spatial phase. Perception & Psychophysics. 1994;55:642–656. doi: 10.3758/bf03211679. [DOI] [PubMed] [Google Scholar]
- Kim JN, Shadlen MN. Neural correlates of a decision in the dorsolateral prefrontal cortex of the macaque. Nature Neuroscience. 1999;2:176–185. doi: 10.1038/5739. [DOI] [PubMed] [Google Scholar]
- Lo C-C, Wang X-J. Cortico–basal ganglia circuit mechanism for a decision threshold in reaction time tasks. Nature Neuroscience. 2006;9:956–963. doi: 10.1038/nn1722. [DOI] [PubMed] [Google Scholar]
- Luce RD. Response times: Their role in inferring elementary mental organization. Oxford University Press; USA: 1986. [Google Scholar]
- Ma WJ, Beck JM, Latham PE, Pouget A. Bayesian inference with probabilistic population codes. Nature Neuroscience. 2006;9:1432–1438. doi: 10.1038/nn1790. [DOI] [PubMed] [Google Scholar]
- Machens CK, Romo R, Brody CD. Flexible control of mutual inhibition: A neural model of two-interval discrimination. Science. 2005;307:1121–1124. doi: 10.1126/science.1104171. [DOI] [PubMed] [Google Scholar]
- Markram H, Lubke J, Frotscher M, Roth A, Sakmann B. Physiology and anatomy of synaptic connections between thick tufted pyramidal neurones in the developing rat neocortex. The Journal of Physiology. 1997;500:409–440. doi: 10.1113/jphysiol.1997.sp022031. [DOI] [PMC free article] [PubMed] [Google Scholar]
- McMillen T, Holmes P. The dynamics of choice among multiple alternatives. Journal of Mathematical Psychology. 2006;50:30–57. [Google Scholar]
- Niwa M, Ditterich J. Perceptual decisions between multiple directions of visual motion. Journal of Neuroscience. 2008;28:4435–4445. doi: 10.1523/JNEUROSCI.5564-07.2008. [DOI] [PMC free article] [PubMed] [Google Scholar]
- Nosofsky RM. Attention, similarity, and the identification-categorization relationship. Journal of Experimental Psychology: General. 1986;115:39–57. doi: 10.1037//0096-3445.115.1.39. [DOI] [PubMed] [Google Scholar]
- Nosofsky RM. An exemplar-based random walk model of speeded categorization and absolute judgment. In: Marley AAJ, editor. Choice, Decision, and Measurement: Essays in Honor of R. Duncan Luce. New York: Cambridge University Press; 1997. pp. 21–59. [Google Scholar]
- Palmer J, Huk AC, Shadlen MN. The effect of stimulus strength on the speed and accuracy of a perceptual decision. Journal of Vision. 2005;5:373–404. doi: 10.1167/5.5.1. [DOI] [PubMed] [Google Scholar]
- Purushothaman G, Bradley DC. Neural population code for fine perceptual decisions in area MT. Nature Neuroscience. 2005;8:99–106. doi: 10.1038/nn1373. [DOI] [PubMed] [Google Scholar]
- Ratcliff R. A theory of memory retrieval. Psychological Review. 1978;85:59–108. [Google Scholar]
- Reddi BAJ, Carpenter RHS. The influence of urgency on decision time. Nature Neuroscience. 2000;3:827–830. doi: 10.1038/77739. [DOI] [PubMed] [Google Scholar]
- Renart A, Song P, Wang X-J. Robust spatial working memory through homeostatic synaptic scaling in heterogeneous cortical networks. Neuron. 2003;38:473–485. doi: 10.1016/s0896-6273(03)00255-1. [DOI] [PubMed] [Google Scholar]
- Roitman JD, Shadlen MN. Response of neurons in the lateral intraparietal area during a combined visual discrimination reaction time task. Journal of Neuroscience. 2002;22:9475–9489. doi: 10.1523/JNEUROSCI.22-21-09475.2002. [DOI] [PMC free article] [PubMed] [Google Scholar]
- Romo R, Merchant H, Zainos A, Hernandez A. Categorical perception of somesthetic stimuli: Psychophysical measurements correlated with neuronal events in primate medial premotor cortex. Cerebral Cortex. 1997;7:317–326. doi: 10.1093/cercor/7.4.317. [DOI] [PubMed] [Google Scholar]
- Sato T, Schall JD. Pre-excitatory pause in frontal eye field responses. Experimental Brain Research. 2001;139:53–58. doi: 10.1007/s002210100750. [DOI] [PubMed] [Google Scholar]
- Schall JD, Hanes DP. Neural basis of saccade target selection in frontal eye field during visual search. Nature. 1993;366:467–469. doi: 10.1038/366467a0. [DOI] [PubMed] [Google Scholar]
- Shadlen MN, Newsome WT. Neural basis of a perceptual decision in the parietal cortex (area LIP) of the rhesus monkey. Journal of Neurophysiology. 2001;86:1916–1936. doi: 10.1152/jn.2001.86.4.1916. [DOI] [PubMed] [Google Scholar]
- Tegner J, Compte A, Wang X-J. The dynamical stability of reverberatory neural circuits. Biological Cybernetics. 2002;87:471–481. doi: 10.1007/s00422-002-0363-9. [DOI] [PubMed] [Google Scholar]
- Tuckwell HC. Introduction to theoretical neurobiology. Cambridge University Press; 1988. [Google Scholar]
- Tversky A. Features of similarity. Psychological Review. 1977;84:327–352. [Google Scholar]
- Usher M, McClelland JL. The time course of perceptual choice: The leaky, competing accumulator model. Psychological Review. 2001;108:550–592. doi: 10.1037/0033-295x.108.3.550. [DOI] [PubMed] [Google Scholar]
- Usher M, Olami Z, McClelland JL. Hick’s law in a stochastic race model with speed–accuracy tradeoff. Journal of Mathematical Psychology. 2002;46:704–715. [Google Scholar]
- Wang X-J. Synaptic basis of cortical persistent activity: The importance of NMDA receptors to working memory. Journal of Neuroscience. 1999;19:9587–9603. doi: 10.1523/JNEUROSCI.19-21-09587.1999. [DOI] [PMC free article] [PubMed] [Google Scholar]
- Wang X-J. Probabilistic decision making by slow reverberation in cortical circuits. Neuron. 2002;36:955–968. doi: 10.1016/s0896-6273(02)01092-9. [DOI] [PubMed] [Google Scholar]
- Wang X-J. Decision making in recurrent neuronal circuits. Neuron. 2008;60:215–234. doi: 10.1016/j.neuron.2008.09.034. [DOI] [PMC free article] [PubMed] [Google Scholar]
- Wang X-J, Tegner J, Constantinidis C, Goldman-Rakic P. Division of labor among distinct subtypes of inhibitory neurons in a cortical microcircuit of working memory. Proceedings of the National Academy of Sciences. 2004;101:1368–1373. doi: 10.1073/pnas.0305337101. [DOI] [PMC free article] [PubMed] [Google Scholar]
- Wickelgren WA. Speed-accuracy tradeoff and information processing dynamics. Acta Psychologica. 1977;41:67–85. [Google Scholar]
- Wong K-F, Huk AC, Shadlen MN, Wang X-J. Neural circuit dynamics underlying accumulation of time-varying evidence during perceptual decision making. Frontiers in Computational Neuroscience. 2007;1:1–11. doi: 10.3389/neuro.10.006.2007. [DOI] [PMC free article] [PubMed] [Google Scholar]
- Wong K-F, Wang X-J. A recurrent network mechanism of time integration in perceptual decisions. Journal of Neuroscience. 2006;26:1314–1328. doi: 10.1523/JNEUROSCI.3733-05.2006. [DOI] [PMC free article] [PubMed] [Google Scholar]
Associated Data
This section collects any data citations, data availability statements, or supplementary materials included in this article.