

Abstract
Biological visual systems have the remarkable ability to recognize objects despite confounding factors such as object position, size, pose, and lighting. In primates, this ability likely results from neuronal responses at the highest stage of the ventral visual stream [inferior temporal cortex (IT)] that signal object identity while tolerating these factors. However, for even the apparently simplest IT tolerance (“invariance”), tolerance to object position on the retina, little is known about how this feat is achieved. One possibility is that IT position tolerance is innate in that discriminatory power for newly learned objects automatically generalizes across position. Alternatively, visual experience plays a role in developing position tolerance. To test these ideas, we trained adult monkeys in a difficult object discrimination task in which their visual experience with novel objects was restricted to a single retinal position. After training, we recorded the spiking activity of an unbiased population of IT neurons and found that it contained significantly greater selectivity among the newly learned objects at the experienced position compared with a carefully matched, non-experienced position. Interleaved testing with other objects shows that this difference cannot be attributed to a bias in spatial attention or neuronal sampling. We conclude from these results that, at least under some conditions, full transfer of IT neuronal selectivity across retinal position is not automatic. This finding raises the possibility that visual experience plays a role in building neuronal tolerance in the ventral visual stream and the recognition abilities it supports.
Keywords: cortex: extrastriate, inferotemporal cortex, object recognition, macaque, learning and memory
Introduction
The key computational challenge in visual object recognition is that any given object in the external world can cast a nearly infinite number of different images on the retina depending on a variety of factors, including object position, size, pose, lighting, the presence of other objects, etc. Thus, a successful visual representation must tolerate wide variation in object images while remaining sensitive to differences between different objects. This problem is called the “object constancy” or “invariance” problem and, although it remains one of the primary stumbling blocks in the creation of robust artificial vision systems, primate brains solve it effortlessly. Neurons in the highest stage of the primate ventral visual pathway, the inferior temporal cortex (IT) (Van Essen et al., 1992), respond selectively to complex visual features (Desimone et al., 1984; Sheinberg and Logothetis, 1997; Tsunoda et al., 2001), while maintaining their selectivity across confounding factors such as retinal position and size (Tovée et al., 1994; Ito et al., 1995; Logothetis et al., 1995). Because populations of such neurons can support tolerant recognition behavior (Hung et al., 2005), it appears that the invariance problem has largely been solved by the ventral visual pathway. However, little is known about how this solution is achieved.
One possibility is that innate mechanisms allow object selectivity to transfer automatically across retinal positions (Olshausen et al., 1993). An alternative possibility is that tolerance to identity-preserving retinal image transforms is learned from experience with the statistics of the natural visual world, especially during early visual development, and perhaps into adulthood. Consistent with this idea, some theorists have suggested that tolerance to retinal position, arguably the simplest transform that the visual system must tolerate, may depend on visual experience (Foldiak, 1991; Wallis and Baddeley, 1997; Ullman and Soloviev, 1999; Wiskott and Sejnowski, 2002). Although this idea has never been tested in high-level neuronal object representations, several psychophysical efforts have shown that recognition performance from visual experience at one retinal position does not always automatically transfer to other positions (Nazir and O'Regan, 1990; Dill and Fahle, 1997, 1998; Dill and Edelman, 2001; Cox et al., 2005). These studies suggest that, at least under some conditions, position-tolerant object representation is not automatic but may depend on visual experience with objects or object features at multiple retinal positions.
Because no previous study had examined the role of visual experience on IT position tolerance, the goal of this study was not to elucidate how experience might build position tolerance, but to first ask whether newly learned IT neuronal shape selectivity automatically generalizes across retinal position. If we found automatic generalization, this would suggest that experience does not play a role in building IT position tolerance. To test this, we followed the logic of previous human psychophysical studies (Nazir and O'Regan, 1990) in that we provided experience with novel objects at one retinal position. After several weeks of experience with these objects, we performed an extensive series of IT recordings to obtain an unbiased measure of IT neuronal selectivity among those objects at both the experienced position and an eccentricity-matched, non-experienced position. In this key comparison, we found significantly greater selectivity at the experienced position, suggesting that newly learned object selectivity does not automatically transfer to new positions. We used an independent set of interleaved objects to show that this result cannot be explained by attentional bias or neuronal sampling bias. This result suggests that IT shape selectivity created at one retinal position is not automatically propagated equally across the visual field. Thus, the well known position tolerance of shape representations in the adult brain may ultimately depend on visual experience.
Materials and Methods
Animals.
Two adult rhesus monkeys were used in this study (weights at start: monkey M ∼6 kg; monkey P ∼7 kg). After acclimation to the laboratory environment, but before training with the shape sets (Fig. 1a), aseptic surgery was performed to implant a head post and scleral eye coil (Robinson, 1963) in each animal. Surgical procedures, eye monitoring, and recording methods were performed using standard techniques (DiCarlo and Maunsell, 2000), and in accordance with the Massachusetts Institute of Technology Committee on Animal Care.
Figure 1.

Experimental design. a, Schematic illustration of the two main experimental positions on the retina and the two sets of visual objects. Monkeys first learned to discriminate among the four objects in the bias test set (easier than the restricted-experience objects) (see Materials and Methods). Monkeys were then trained to discriminate among the four objects in the restricted-experience set, for which presentation was restricted to a single retinal position (monkey M, +2°, shown here in red; monkey P, −2°). The key experimental question was whether selectivity among these newly learned objects was found at both the trained position (red) and the nontrained position (blue). b, Top, A schematic time sequence of an example trial of discrimination training during the experience phase of the experiment (not drawn to scale). Yellow circle indicates gaze position during a typical trial. The animal initiated a trial by fixating a central point, after which a single object was presented. If the animal attempted to saccade toward the object, it was removed from the display. The animal was allowed to report the identity of the object by directly saccading to one of the four lighted response targets at the corners of the monitor (yellow arrow), and correct reports were immediately rewarded. The mapping between object identity and the correct response corner was never changed (see Materials and Methods). Bottom, A schematic time sequence of an example trial during the probe phase of the experiment in which neuronal responses were recorded (not drawn to scale). The monkey initiated a trial by fixating a central point and was then only required to maintain that gaze position while 5–10 stimuli were presented at 200 ms intervals. On each trial, these stimuli were objects drawn randomly from both the restricted-experience object set and the bias test object set (see Materials and Methods for details).
Visual stimuli.
Isolated objects were presented during training and testing (see below) on a cathode ray tube monitor (43.2 × 30.5 cm; 75 Hz frame rate; 2048 × 1280 pixels) placed 48 cm from the animal so that it subtended ∼48° azimuth and 35° elevation. A total of eight white shapes were constructed for the experiment (two sets of four), always presented on a gray background (27 Cd/m2). The “restricted-experience” object set consisted of four filled-in full-luminance white (57 Cd/m2) shapes having contours that were defined by a nonuniform rational B-spline (Fig. 1a). These four shapes were constructed such that each shape was formed by the conjunction of one of two possible left sides, and one of two possible right sides, with the full set of four shapes defined by the 2 × 2 cross of those features (i.e., Left1 + Right1, Left1 + Right2, Left2 + Right1, and Left2 + Right2). This design was intended to thwart any attempt to discriminate among the shapes using spatially local features (same logic as that used by Baker et al., 2002). Importantly, each shape was vertically symmetric so that it was equally discriminable when presented above and below the center of gaze (the two main experimental retinal positions) (see below). Thus, these objects provided our key experimental control: a comparison of responses to the exact same objects at two retinal positions (one highly trained, one untrained) (Fig. 1a) (see below).
To test for any potential spatial attention bias or receptive field (RF) sampling bias, we also used a “bias test” object set that consisted of four filled-in full-luminance white (57 Cd/m2) geometric shapes (circle, cross, star, and triangle) (Fig. 1a). These objects were not intended to serve as a shape control for the restricted-experience objects (indeed, these shapes are easier to discriminate), because the main control in our experiment is an identical object set at an eccentricity-matched retinal position (restricted-experience objects) (see above). Instead, these bias test objects were: 1) used to search for visually responsive neurons so that our neuronal data would be completely unbiased with respect to the restricted-experience objects, and 2) were used as a sensitive assay for any possible bias in spatial attention or coincidental receptive field bias in our sampled neuronal population. All eight shapes (four restricted-experience objects and four bias test objects) were scaled such that they fit within a 2° circle.
Behavioral tasks.
All behavioral training and testing was done using standard operant conditioning (juice reward) with the head stable relative to the viewing monitor (head post fixation) and with high-accuracy, real-time eye tracking (eye coil) (Robinson, 1963; DiCarlo and Maunsell, 2000). A “discrimination task” was used to train the animals to discriminate among the four objects in each of the two object sets during the “experience phase” of the experiment (Fig. 1b). One object was presented on each trial, and the animal reported the object's identity using an eye movement (saccade) to one of four lighted response positions in the four corners of the monitor (the mapping between object identity and the correct response position never changed) (same task used by DiCarlo and Maunsell, 2000, 2003). Each behavioral trial proceeded as follows. The monkey initiated a trial by fixating a central point (a 0.25° width square) within a ±0.25–0.5° square window. After 100–300 ms, a single object was presented for 100 ms at a predetermined retinal position (see below). When objects were presented away from the center of gaze (e.g., 2° above or below the center of gaze), both animals sometimes saccaded toward the object center (as described by DiCarlo and Maunsell, 2003). However, because we monitored the animal's eye position in real time, we always removed the object from the display before that saccade ended (for details, see DiCarlo and Maunsell, 2003). The animal was allowed to continue the trial and report the object's identity by immediately saccading to the correct response corner (Fig. 1b). After the object presentation, saccades to positions other than the center of the (removed) object, or to one of the response corners, resulted in the trial being aborted immediately (and counted as incorrect). Correct reports were always immediately rewarded with a brief high-pitched tone and a few drops of juice; a non-aversive low-pitched tone was immediately played after incomplete trials or incorrect responses.
During the experience phase, trials were run in blocks of restricted-experience objects only, or bias test objects only. restricted-experience objects were always presented only at the restricted (“trained”) position (2° above the center of gaze for monkey M, 2° below center of gaze for monkey P). We focused on position changes across elevation rather than azimuth because of the known azimuthal bias of IT neurons (Op de Beeck and Vogels, 2000). For bias test objects, each object appeared randomly, equally often at each of the three positions (2° above center of gaze, 2° below center of gaze, and at the center of gaze). Monkeys first learned to perform the task with the bias test objects presented at a range of positions (with approximately equal experience with these objects at the two key experimental positions). They subsequently learned the task with the restricted-experience objects at the trained position.
A “fixation task” was used during the collection of all neuronal data during the probe phase of the experiment (Fig. 1b, bottom). On each behavioral trial, monkeys were required to fixate a small central point (0.25°, colored blue) while 5–10 objects drawn from both the bias test set and the restricted-experience set were presented in pseudorandom order and random positions. That is, all conditions were fully interleaved (stimulus-by-stimulus). The restricted-experience objects could appear at the trained position, the center of gaze, and the non-trained position, and the bias test objects could also randomly appear at these same three positions, as well as at other positions within the central 10° of the visual field. Furthermore, the stimulus conditions were counterbalanced such that each of the main experimental conditions occurred equally often in each serial position of the sequence presented on each trial. Each object was presented for 100 ms followed by an interstimulus interval of 100 ms (Fig. 1b). This rate of five objects per second is roughly comparable with the timing of spontaneously generated saccades during recognition tasks (DiCarlo and Maunsell, 2000), and well within the time frame that allows accurate object recognition (Potter, 1976).
After the collection of all neuronal data (below), additional behavioral testing was performed on monkey M. The monkey performed an active discrimination task similar to the discrimination training task (above), with several modifications. (1) The restricted-experience objects were presented equally often at both the trained and non-trained position, and these trials were not rewarded. (2) To monitor the distribution of spatial attention (behaviorally assessed here) to the trained and non-trained position, these restricted-experience object trials were randomly interleaved among trials using the bias test objects at both the trained position and the non-trained position (correct trials were rewarded). (3) To make the task more demanding and avoid ceiling effects, the bias test objects were presented at reduced contrast (10%; titrated by pre-piloting runs targeting ∼75% correct performance level). Interleaved bias test object trials outnumbered the unrewarded restricted-experience object trials four to one.
Neuronal recording.
Single-unit recordings were made using standard methods (Zoccolan et al., 2005). Briefly, on each recording day, a single-metal, extracellular microelectrode was advanced through a 26 gauge guide tube into IT cortex. Using both structural magnetic resonance images and gray-white physiological transitions, electrode penetrations were focused on the anterior part of IT (Horsely-Clark coordinates: 12.5–19.5 mm anterior, 16–24 mm lateral), on the ventral superior temporal sulcus and the ventral surface of the inferior temporal gyrus, at or lateral to the anterior middle temporal sulcus. To carefully guard against possible neuronal selection bias, monkeys performed the discrimination task (above) with only objects from the bias test object set presented randomly and equally often at positions 2° above the center of gaze, 2° below the center of gaze, and at the center of gaze, while we advanced the electrode and isolated active neurons. All isolated neurons that were even weakly responsive to visual stimuli (any of the bias test objects, in any position) during this task (t test, p < 0.05, uncorrected) were further studied with the main battery of position tolerance tests using the fixation task and both sets of objects (probe phase) (Fig. 1a). Between 10 and 30 repetitions of each object in each tested position were presented while recording from each IT neuron (5–10 stimuli were presented on each behavioral trial in the probe phase). Over ∼90 recording sessions, we recorded from 216 well isolated anterior IT neurons in the two monkeys (151 cells in monkey M and 65 in monkey P).
Data analysis.
For all of the neuronal analysis described in this study (except Fig. 6), we computed spike counts over a standard time window of 100–200 ms poststimulus onset for each presentation of each stimulus condition (DiCarlo and Maunsell, 2000, 2003). The start of this time window is based on the well known latency of IT neurons (Baylis and Rolls, 1987), and the end time is well below the reaction times of monkeys performing object discrimination tasks (the median reaction time in the object discrimination task in this study was 289 ms from stimulus onset; monkey M, 286 ms; monkey P, 294 ms), and is thus consistent with an integration window that could, in principle, be used by downstream neurons to extract object information (DiCarlo and Maunsell, 2000; Hung et al., 2005). To include the response data for all four objects in an unbiased index of selectivity for each neuron, we computed the F ratio on the spike counts [the total variance between groups (objects) divided by the total variance within groups] (Snedecor and Cochran, 1967) (Fig. 2a). Spike counts were first variance stabilized [square root assuming Poisson spiking statistics (Snedecor and Cochran, 1967), but results were nearly identical without such stabilization]. We also computed the “best”-“worst” selectivity (response difference among two objects) using split-half data to assign the label best and worst to two of the four objects (described further in Results). The statistical selectivity (p value) of each neuron among each set of four objects at each position was assessed using one-way ANOVA (with object identity as the factor) and standard d-prime (described in supplemental Fig. S1, available at www.jneurosci.org as supplemental material).
Figure 6.

Time course of selectivity for the restricted-experience objects at the two key experimental positions. The responses of all neurons showing strong selectivity among the restricted-experience objects at either position are included (p < 0.05, n = 11). The x-axis is time since stimulus onset; the y-axis is mean selectivity (over all of the neurons) in which best-worst selectivity was computed in an unbiased manner as described in Figure 5b and Results, but here using a 50 ms sliding window (10 ms steps). Quantitative assessment of the separation of the two curves is captured in Figure 5b.
Figure 2.
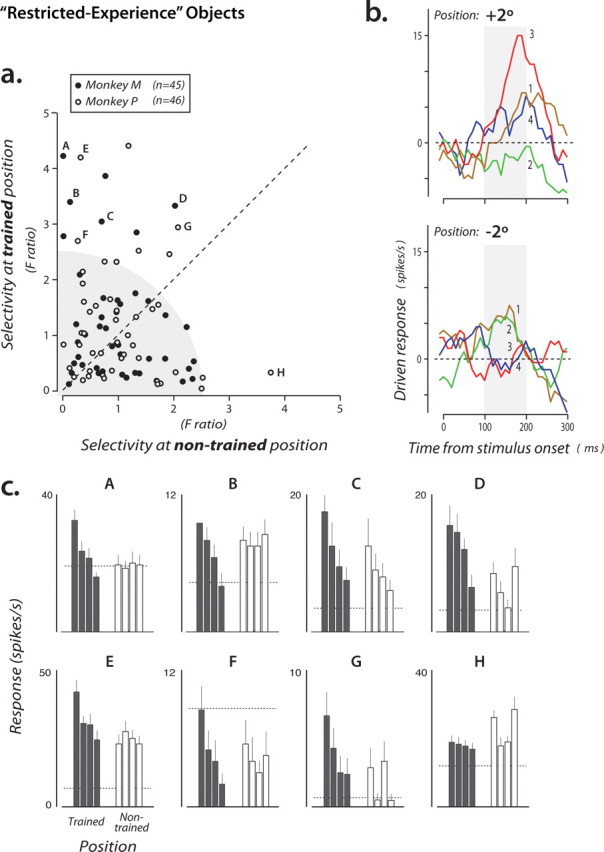
Selectivity of the entire population of IT neurons among the restricted-experience objects. a, Each point shows the selectivity of a single IT neuron measured at both the trained position (ordinate) and the nontrained position (abscissa). Selectivity was computed using a standard index that takes into account all of the response data for these objects collected at each position (F ratio) (see Materials and Methods). The gray region highlights the fact that many IT neurons had little or no selectivity among these objects (see Results). b, Driven responses of an IT neuron (indicated by letter “A” in a) that showed selectivity at the trained position (+2° for this monkey), but little selectivity at the nontrained position (−2°). Each line shows the average poststimulus spiking response to each object (presented at time 0 for 100 ms duration) (Fig. 1b) (a 100 ms sliding boxcar is applied to the binned spike counts). Object identity is indicated by color (and the numbers refer to the object identity numbers shown in Fig. 1a). Gray boxes indicate the standard time window used for all analyses (see Materials and Methods). c, Data from eight example neurons (indicated by letters in a). Each plot shows the mean response of one neuron to each of the four objects presented in each position (filled bars, trained position; open bars, nontrained position). Dashed line is mean firing rate in the 100 ms window on each trial just before stimuli were presented. For clarity, in each plot, object identity is rank-ordered according to the response in the trained position (different neurons generally prefer different objects) (data not shown here), and the same object identity order is used for the nontrained position.
To assess the information that would, in principle, be available to downstream neurons, we used standard methods to construct Fisher linear discriminant classifiers on IT population responses to perform a four-way discrimination task analogous to the task performed by the monkeys (Duda et al., 2001). In particular, for each set of four objects and each retinal position, we constructed four binary classifiers (e.g., “triangle” vs “no triangle”), and the overall report of object identity was taken to be that of the classifier with the strongest response (four-way classifier). For this analysis, we focused on the population of neurons that were selective to at least a p < 0.1 (ANOVA) level, and for which there were at least 20 trials collected (21 neurons; monkey M, n = 13; monkey P, n = 8). The responses of these neurons during the period from 100 to 200 ms were assembled into response vectors that served as labeled training data for the classifiers. To assess performance, a leave-one-out cross-validation procedure was used, wherein a four-way classifier was trained using all of the data except one trial, and then tested on that one trial; this process was then iterated through the data set such that each trial served as the “test” trial in turn. Because the neuronal data were collected serially, one neuron at a time, there was no special correspondence between any given trial from one neuron and any given trial from another. To avoid the classifiers learning spurious correlations between the responses of individual neurons, before constructing population training vectors, we randomly shuffled the training trial order for each neuron 20 times. Thus, on one shuffle, trial 1 from neuron 1 might be paired with trial 14 from neuron 2, and trial 6 from neuron 3, etc. In all cases, the trial that was withheld for cross-validation did not participate in this shuffling, maintaining the integrity of the cross-validation scheme.
Results
We investigated the effect of visual experience on position tolerance of IT neurons by training two monkeys in a novel-object identification task, using real-time eye tracking to restrict visual experience with those objects to a single retinal position. Specifically, during the experience phase of the experiment, each monkey was trained to identify each of four novel visual objects (the restricted-experience objects) (Fig. 1a) by making an eye movement to one of the four corners of the display screen (a four-choice task) (Fig. 1b). Monkey M only saw each object 2° above the center of gaze, whereas monkey P only saw each object 2° below the center of gaze; attempts to saccade to the object always resulted in it being removed from the display before the saccade landed (see Materials and Methods). In an effort to start from a relative “blank slate,” the four objects were chosen such that it was unlikely that the animals would have had previous experience seeing or discriminating similar objects in the past. In addition, the objects were constructed such that the animals could not solve the task by focusing on any one local feature (similar to the study by Baker et al., 2002) (see Materials and Methods). Each monkey received 30–60 training sessions to achieve 80–90% correct performance (chance = 25%) with these objects (roughly 20,000–30,000 retinal exposures of each object). To test for possible neuronal sampling bias and spatial attention bias (see below), both monkeys were also trained on a second set of four bias test objects that were shown equally often at 2° above, 2° below, and at the center of gaze (Fig. 1a). These objects were chosen to have greater within-object-set shape discriminability so that neurons would be more likely to respond to one or more of them and thus provide a sensitive assay of any neuronal sampling bias or spatial attention bias.
After the experience phase, animals entered the probe phase of the experiment during which the position tolerance properties of each monkey's IT neuronal population were assessed via single-unit microelectrode recording (see Materials and Methods). To control for the well known differences in retinal sampling density, we aimed to compare neuronal selectivity at the trained retinal position (e.g., 2° above center of gaze) with an eccentricity-matched nontrained position (e.g., 2° below center of gaze; nontrained position (Fig. 1). To ensure an unbiased neuronal population sample, we searched for active IT neurons while the animal identified objects [i.e., performed the discrimination task (Fig. 1b)] from the bias test object set (n = 216 neurons) (see Materials and Methods). All isolated neurons that were even weakly visually responsive to at least one of these bias test objects at any position (p < 0.05, t test, uncorrected; n = 91) were subjected to further testing with both the restricted-experience object set and the bias test object set at both of the key retinal positions and the center of gaze, and were included in the results presented here. During this neuronal testing, we sought to limit potential spatial attention effects in the responses (Reynolds et al., 2000; Maunsell and Cook, 2002) and to minimize the possibility that visual exposure to the objects during testing might work against the position-biased experience we provided in the experience phase (above). To do this, the monkey was not instructed to perform the active recognition task but, instead, it was simply required to fixate a dot in the center of the screen while randomly interleaved objects from both the restricted-experience and bias test sets were presented at a rapid rate (5 objects per second, 100 ms duration each) at randomly interleaved positions (2° above and below the center of gaze, and at the center of gaze) (Fig. 1b, fixation task) (see Materials and Methods). All of the neuronal data presented in this study were collected during this task. Later, we revisit this design to consider the question of spatial attention in detail.
Our primary goal was to examine the IT population for evidence of selectivity among the restricted-experience objects and to compare any such selectivity at the two key experimental positions (+2° and −2°) (see Materials and Methods). To start, we computed a well established index of neuronal selectivity for each neuron (F ratio) that takes into account all of the data collected from the neuron (the F ratio is the underlying measure used for ANOVA statistics; it measures the amount of difference in response to the four objects and is zero if all four objects give the same response) (see Materials and Methods). We then plotted the selectivity of each IT neuron among the restricted-experience objects at the trained position and at the nontrained position (Fig. 2a). This plot revealed that most IT neurons showed little selectivity among these four difficult-to-discriminate, restricted-experience objects (Fig. 2a, neurons in lower left) (75% of the neurons were not individually statistically selective among these objects at either position at p < 0.1, ANOVA). This small number of restricted object-selective neurons is not surprising because the population sample we obtained was completely unbiased with respect to these four restricted-experience objects (above) (see Materials and Methods). That is, because (1) it is unlikely that a large set of IT neurons will encode this particular set of four objects (i.e., leaving representational capacity for other objects) and (2) the restricted experience objects were never presented while searching/screening for responsive neurons (i.e., no selection bias), it is expected that the population sample would contain only a minority of neurons with statistically significant selectivity among these four similar objects (Fig. 1a). Nevertheless, Figure 2a suggests that, among the IT neurons that do have discriminatory power among these objects, more power is available at the trained position (compared with the eccentricity-matched, nontrained position). That is, the most selective neurons tend to lie above the diagonal of Figure 2a, rather than along the diagonal. Figure 2b,c shows the responses of eight such neurons to the four restricted-experience objects.
To quantify this difference in selectivity across retinal positions, we first asked: How many neurons are (individually) statistically selective among the four restricted-experience objects at each position? To answer this, we applied an ANOVA (object identity as the main factor) to the responses obtained at the two key experimental positions (+2° and −2°). This revealed that, although only a small fraction of the IT population in each monkey was selective among the restricted-experience objects, each monkey's IT contained a higher fraction of neurons that were selective among the restricted-experience objects at the trained position (relative to the eccentricity-matched nontrained position). This was found even though one monkey experienced these objects at the upper retinal position and the other monkey experienced them at the lower retinal position (Fig. 3). Figures 3a and 4a show that the difference in selectivity at the two positions did not strongly depend on the p value used to define “selective” neurons by the ANOVA. Here, the ANOVA p value is simply a measure of selectivity that takes into account all of the data and the response variance of each neuron. But this difference in selectivity was also found using a simple d-prime measure of selectivity (best vs worst) (see supplemental Fig. S1, available at www.jneurosci.org as supplemental material). Overall, a significantly (p < 0.0147, χ2 test) greater proportion of selective neurons was observed at the trained position, relative to the eccentricity-matched nontrained position (Fig. 4a).
Figure 3.

a–b, IT selectivity among the restricted-experience objects (a) and bias test objects (b) for each monkey. a, Red points indicate the fraction of IT neurons selective among the restricted-experience objects at the trained position (counterbalanced across the two monkeys as shown). Blue points show selectivity within the same object set at the eccentricity-matched, nontrained position. Selectivity was determined by ANOVA (see Materials and Methods), and a range of significance levels (p values) used for deeming a neuron to be selective is indicated. Note that in all cases, both monkeys showed a tendency for more selectivity at the trained position (red), relative to the nontrained position (blue). b, Same conventions as in a for the bias test objects (Fig. 1a) presented at the same two retinal positions (filled green squares indicate the position that was trained with the restricted-experience objects). Please note that, because the bias test objects were chosen to have greater within-object set shape differences than the restricted-experience object set (see Materials and Methods), it is unsafe to compare the absolute fraction of neurons showing shape selectivity among the two object sets.
Figure 4.

a–d, IT selectivity and behavioral performance within object sets after training. a, Fraction of IT neurons with responses that were selective among the restricted-experience objects when those objects were tested at the trained retinal position (black bars) and at the nontrained, equally eccentric position (white bars). Data from both monkeys have been combined (Fig. 2). As in Figure 2, selectivity was determined by ANOVA, and the x-axis shows a range of significance levels (p values) used for deeming a neuron to be selective. *p < 0.05, χ2 test; significant difference at the trained and nontrained positions. Portions of the bars overlaid in gray indicate the fraction of neurons that were selective at both the trained and nontrained positions. b, Left, Performance of the population of selective IT neurons (p < 0.1, ANOVA) assessed by linear classification (see Materials and Methods), shown separately for each monkey. Chance is 25% (four possible objects). **p < 0.01, test of independent proportions; significant performance difference at the trained and nontrained positions. Right, behavioral performance for one monkey at discriminating among the restricted-experience objects at the trained (black) and nontrained (white) retinal positions (with interleaved low-contrast trials from the bias test object set) (see Materials and Methods). Whereas absolute behavioral performance (b, d, right) is decreased from levels achieved during training because several trial types are interleaved, a strong asymmetry is observed between the trained and nontrained positions for the restricted-experience objects, but not the interleaved bias test objects. **p < 0.01, test of independent proportions; significant difference. c, d, Same conventions as in a, b for the bias test objects, which show no asymmetry between the trained and untrained retinal positions [please note that no direct comparison is implied between the absolute selectivity/performance levels for the restricted-experience (a, b) and bias test objects (c, d)].
Although the above analysis shows that there are more IT neurons selective among the restricted-experience objects at the trained position (relative to the nontrained position), it does not give a clear sense of the absolute magnitude of that selectivity difference. To analyze this, we computed the difference between the response to the best object (the object that evoked the largest response) and the response to the worst object (the object that evoked the smallest response). To avoid any bias in this measurement, each neuron's best and worst objects were determined based on one-half of the data obtained from that neuron (pooled over position), and its best-worst response difference was computed using the other half of the data (even/odd split of the total number of presentations of each object; this measure is unbiased in that it will be zero for nonselective neurons). We found (Fig. 5b) that as we focused on neurons that were more and more selective among the restricted-experience objects, regardless of position (by ANOVA), the mean best-worst difference for these difficult-to-discriminate objects increased to ∼5 spikes/s at the trained position but was near zero for the nontrained position (consistent with our main finding) (Figs. 3a, 4a). That is, although the neuronal sampling and the analysis were completely unbiased with respect to the two positions, clear selectivity was found at the well experienced position and little selectivity was found at the eccentricity-matched position. [Interestingly, these same neurons showed only mild selectivity at the center of gaze (Fig. 5b).] Closer examination of the time course of selectivity revealed that this difference in selectivity at the two positions did not take time to develop, but was present right at the time that IT neurons start to respond (∼100 ms latency) (Fig. 6) (see also Discussion).
Figure 5.

Mean responsivity and selectivity (best-worst) of the IT population. a, Left, Mean response to all four objects in the restricted-experience object set at the two main experimental positions and at the center of gaze (Fig. 3, mapping of these positions to absolute visual field position). Results are shown for all neurons and for a subset of highly selective neurons (selective among the restricted-experience objects at p < 0.05 at either position; ANOVA). Right, Same analysis applied to the same neurons, but now for the responses to the bias test objects presented at the same three positions (see Materials and Methods). b, Left, Selectivity among the restricted-experience objects (response to best object minus response to worst object) at each position [red shows trained position; blue shows equally eccentric, nontrained position (Fig. 3)]. The plot shows results as a function of the ANOVA p value used for inclusion as selective among the restricted-experience objects (neurons that reach this level of selectivity at either position are included). This plot is completely unbiased with respect to the two main experimental positions, and the magnitude of selectivity (best-worst) is also unbiased (see Results). Dashed line shows the same best-worst analysis applied to the same neurons, but now using the responses of the neurons to the same objects presented at the center of gaze (gray is SEM). Right, Selectivity using the same best-worst analysis applied to the same neurons, but now using the responses of the neurons to the bias test objects at the two key positions and center of gaze (see Materials and Methods). This plot shows that selectivity among the bias test objects is very similar in the two key retinal positions, but direct comparison of the magnitude of selectivity with the restricted-experience selectivity (left plot) is unsafe. Error bars indicate SEM.
Could the observed difference in selectivity among the restricted-experience objects at the two positions be the result of a coincidental neuronal sampling bias (e.g., if there were, by chance, more neurons with receptive fields centered at the trained position) or a bias in spatial attention, developed during the training that persisted (for many weeks) during the passive-viewing fixation task? We designed our experiment to minimize the chance of either possibility by (1) using unbiased sampling of neurons (only the bias test objects were presented while we advanced the electrode looking for isolated cells), and (2) performing all neuronal testing while the animal was simply required to fixate as objects and positions were randomly tested at a rapid rate (5/s) (see Materials and Methods). In addition to these above precautions, we also designed our experiment so that it contained a sensitive assay to test for these possibilities. Specifically, all neuronal data were collected along with randomly interleaved bias test objects (fully interleaved within each behavioral trial) (see Materials and Methods). By design, these objects were selected before the experiment began to be easier to discriminate than the restricted-experience objects (Fig. 1), so that IT neurons were likely to be selective within the object set and thus provide a sensitive assay for any bias. We also ensured that these bias test objects were experienced equally at the two key positions (see Materials and Methods), to guard against the possibility of any experience-induced selectivity bias among these objects (the main question of our study). This experimental design ensures that if any bias in RF sampling or spatial attention is present (even though our design makes that unlikely), then that bias will also appear in the responses to the bias test objects. In the analyses that follow, we show that no such bias was found among the bias test objects and, thus, neither of the above possibilities can explain the observed selectivity difference among the restricted-experience objects at the two positions.
First, we examined the responsivity at each position (mean response to all four objects in each set), and we found that the bias test objects drove the IT neurons approximately equally well at both of the key experimental positions (+2°, −2°) (Fig. 5a). Also, we found a tendency for objects presented at the center of the fovea (0°) to produce a slightly stronger response, as expected from previous IT work (Fig. 5a) (Op de Beeck and Vogels, 2000; DiCarlo and Maunsell, 2003). Both of these results are inconsistent with a RF sampling bias or an attentional bias toward (or away from) the trained retinal position. Second, we repeated the best-worst analysis (above) for the bias test objects, and we found virtually identical selectivity at both the trained and nontrained positions (Fig. 5b). Third, again using ANOVA as a summary measure of selectivity, we found that the difference in the number of selective neurons at the two retinal positions found for the restricted-experience object set was not observed for the bias test object set (p = 0.441, χ2 test) (Fig. 4c). Consistent with this observation, a significant interaction was found between retinal position (trained vs nontrained) and object set (restricted-experience versus bias test; p < 0.001, multi-way χ2 analysis). In summary, all three of these analyses show that our main observation, a lack of position generalization of IT selectivity among the restricted-experience objects, cannot be explained by visual field biases in the recorded neuronal population (RF sampling) or by a bias in spatial attention (see also Discussion).
Having established above that single-unit IT selectivity does not automatically transfer equally across the visual field, we turned to population readout measures that leverage many neurons in a population and thus provide an even more sensitive assay of selectivity across position (as well as translating single-unit measures into units of “performance”). To test whether more information about the restricted-experience objects was available for readout in the IT population at the trained position, we constructed linear discriminant classifiers (Duda et al., 2001) to predict object identity on the basis of population neuronal responses (n = 21 neurons) (see Materials and Methods). In both animals, the classifiers were significantly more accurate in predicting object identity at the trained position compared with the nontrained position (monkey M, p < 0.0001; monkey P, p < 0.0001; one-tailed two-sample test of independent proportions) (Fig. 4b). This result is not surprising given the single-unit selectivity measures (Figs. 2, 3a, 4a); it confirms the availability of more discriminative information about the restricted-experience objects at the position in which they were trained, relative to a matched position in which they were not. Also consistent with the single-unit measures is that the same linear discriminant analysis showed no significant performance difference at the two positions for the bias test objects (monkey M, p = 0.284; monkey P, p = 0.384) (Fig. 4d), again ruling out a bias in spatial attention or neuronal sampling.
It is known that many IT neurons show changes in responsivity across changes in object position but often continue to show the same pattern of selectivity (rank order) among a set of objects (i.e., their selectivity has position tolerance) (Tovée et al., 1994; Ito et al., 1995; Logothetis et al., 1995; DiCarlo and Maunsell, 2003). Our results above suggest that position tolerance depends at least somewhat on visual experience because, after restricted training at one position, the magnitude of selectivity was larger at that position than the equally eccentric, nontrained position. However, given that some weak selectivity was still observed at the nontrained position (Fig. 2), we asked whether the rank-order pattern of selectivity at the two positions was similar. Among the neurons that showed strong selectivity among the restricted-experience objects (ANOVA p < 0.05, regardless of position), we found that the mean rank-order correlation (Spearman) was only 0.10 and not significantly greater than zero (p = 0.42 by t test; monkey M, 0.12; monkey P, 0.08), suggesting little object preference similarity across position (for comparison, the mean Spearman correlation over position among the bias test objects was 0.64, p < 10−16). We caution that the low values among the restricted-experience objects should not be interpreted as neurons with very different patterns of selectivity at the two positions but are driven primarily by the fact than many neurons were not selective at the nontrained position (Figs. 2–4), which pushes the correlation toward zero. In a similar vein, we found that linear classifiers constructed using only neuronal responses to the restricted-experience objects at the trained position showed roughly chance performance among those objects presented at the nontrained position (monkey M, 24.4%; monkey P, 27.5%; chance is 25%) (compare Fig. 4b). For comparison, the same analysis among the bias test objects yielded good generalization performance across position: essentially the same performance at the nontrained position as at the trained position (monkey M, 35% correct; monkey P, 63% correct) (compare Fig. 4d), consistent with a previous study (Hung et al., 2005).
Finally, we wondered whether there were behavioral correlates of the difference in IT neuronal selectivity across position among the restricted-experience objects. In our main experimental design, the animal subjects were never required to discriminate among these objects at retinal positions other than the trained position [although they did experience them a great deal at both key experimental positions during neuronal testing (passive fixation task) (Fig. 1b) (see Materials and Methods)]. However, after recording was complete, we conducted further experiments to explore this behavioral issue. In particular, monkey M performed a modified version of the object identification task in which the restricted-experience objects were presented at both the trained and nontrained positions (randomly interleaved, trial-by-trial). To ensure that any observed performance difference could not be attributed to a bias in spatial attention (e.g., toward the trained position), we also randomly interleaved trials with objects from the bias test set presented at reduced contrast (to increase their difficulty and avoid ceiling effects). We found that behavioral performance with the restricted-experience objects was significantly better at the trained position compared with the nontrained position (p = 0.0017, one-tailed two-sample test of independent proportions) (Fig. 3c), whereas performance with the bias test object set was not significantly different at the two positions (p = 0.482, one-tailed two-sample test of independent proportions) (Fig. 3f). Consistent with the neuronal data, this behavioral pattern shows that, although the animal has the capability to perform position–general object discrimination for at least some object classes (bias test objects), it had a substantial failure to position-generalize its recognition of the restricted-experience objects (but see Discussion). Furthermore, like the neuronal data above, the behavioral asymmetry across position with the restricted-experience objects cannot simply be explained by a shift in spatial attention (because it was not seen among the trial-by-trial interleaved bias test objects).
Discussion
The adult IT neuronal representation has selectivity for visual objects that tolerates changes in object position (Tovée et al., 1994; Ito et al., 1995; Logothetis et al., 1995; Hung et al., 2005), a property known as position tolerance (or relative invariance). This property likely underlies position-tolerant object recognition (Biederman and Cooper, 1991), and it is now at the forefront of the object vision community (Kravitz et al., 2008). The results presented here argue that position tolerance is modified by visual experience. Specifically, by precisely controlling the retinal position of objects, we show that visual experience results in IT neuronal selectivity that is strongly biased toward the experienced position. This reshaped selectivity was not automatically propagated just 4° from the well experienced position. This suggests that the computational machinery of the ventral visual stream is not constructed in a manner that automatically produces position tolerance in IT, even across relatively small changes in retinal position. Instead, the creation and/or maintenance of IT position tolerance might require experience (although not necessarily with the exact same objects) (see below).
How large is the experience-induced IT effect reported here? Although we found that only a minority of IT neurons were selective among the restricted-experience objects, this is not surprising in the context of existing IT plasticity studies (Logothetis and Pauls, 1995; Kobatake et al., 1998; Baker et al., 2002; Sigala and Logothetis, 2002; Freedman et al., 2006; Mruczek and Sheinberg, 2007) and the prevailing idea that IT represents a world of objects besides those tested in the laboratory. Although the effect size might be considered modest in terms of absolute firing rates (∼5 spikes/s difference in selectivity at the two positions) (Fig. 5b), this is comparable with that reported in the best controlled study of experience-induced shape selectivity changes in IT (Baker et al., 2002), and with the effect of spatial attention in the ventral stream (∼25% of visual stimulus modulation) (Maunsell and Cook, 2002). Although experience can produce functional magnetic resonance imaging (fMRI)-detectable changes in the ventral stream (Gauthier et al., 1999; Grill-Spector et al., 2000; Kourtzi et al., 2005; Op de Beeck et al., 2006) [see Op de Beeck et al. (2008) for discussion of the potentially complex relationship to single-unit studies], to our knowledge, no fMRI study has yet examined the experience manipulation used here. In sum, although we do not yet know whether the experience-driven change in IT position tolerance reported here explains the associated perceptual effects (see below), it is nontrivial by a number of measures.
Because we could not record from the same neurons before and after training, our data cannot determine how individual IT neuronal response profiles changed over the course of training to result in the position-specific selectivity we observed. For instance, selectivity at the trained position might be built entirely de novo in cells exhibiting little initial selectivity for these objects; alternatively, preexisting selectivity for related objects might be gradually shaped and amplified. It is also logically possible (although unlikely) that shape selectivity was initially present at both positions before training but was somehow weakened at the untrained position.
Consistent with the observed failure to generalize across position within the IT neuronal population, we found a corresponding failure to generalize behaviorally (Fig. 4b). Because the bias test objects showed that monkeys are able to perform position-tolerant object identification (Fig. 4d) (see also DiCarlo and Maunsell, 2003), we speculate that this behavioral failure to position-generalize (Fig. 4b) is caused by the monkey's reliance on a non-position-tolerant visual neuronal representation (e.g., IT) (Fig. 4a,b). However, we cannot rule out the possibility that a nonsampled IT population (or another visual area representation) is sufficient to support position generalization, but that the monkey may have just failed to generalize the “concept” of the task.
Importantly, we used another set of objects (bias test objects) to show that training with the restricted-experience objects did not induce a persistent shift in spatial attention (see Results). Could other, more complex, attention-based accounts explain our results? Our data (Fig. 6) show that even during rapid, fully interleaved testing, the difference in selectivity observed at the two positions is present when IT neurons first respond (∼100 ms) (Baylis and Rolls, 1987; Vogels and Orban, 1994; DiCarlo and Maunsell, 2003, 2005). This effectively immediate difference argues against rapidly shifting spatial attention-based accounts of our results, which would require some other brain area to “prerecognize” the restricted-experience objects (effectively performing some of the computations undertaken by IT, but faster than IT), initiate an obligatory shift of covert attention to the trained position, and immediately shift attention back to a neutral state, all within 200 ms (and in the context of a fixation task, in which such attention shifts would serve no behavioral purpose). Another possibility is that our training procedure induced a persistent, “bottom-up” attentional bias that is both object-specific and position-specific. However, such attention has, to our knowledge, not been previously reported, and is functionally equivalent to saying that the position tolerance of the ventral stream has been altered (i.e., our main claim). In sum, our data show that the position profile of IT object selectivity (i.e., position tolerance) is modified by visual experience and that modification persists even during a simple fixation task and across long periods of time (months of recording). Thus, we argue that the most parsimonious mechanistic explanation of all our results is a change in synaptic connectivity or weighting along the ventral stream (see below).
Our results are consistent with human psychophysical experiments in which the learning of complex object discrimination at one retinal position does not fully transfer to equally eccentric, nontrained positions (Nazir and O'Regan, 1990; Dill and Fahle, 1997; Dill and Edelman, 2001). Similar to those studies, the effect described here was found within an object set that was initially challenging to discriminate so that it likely required the learning of new feature conjunctions (Baker et al., 2002). Thus, our work does not reveal whether experience-induced changes in neuronal position tolerance would be seen after position-restricted training with simpler, easy-to-discriminate objects sets which, by definition, can be discriminated using features with which subjects have a great deal of previous experience. Also, given that we provided significantly more experience (∼20,000 exposures of each object) than was provided in the psychophysical studies, it remains to be seen whether changes in IT neuronal tolerance also occur with less experience (see below). Finally, although psychophysical studies have suggested that pose tolerance is influenced by visual experience (Logothetis and Pauls, 1995; Logothetis et al., 1995; Wallis and Bülthoff, 2001), it remains to be seen whether our finding extends into other types of tolerance [see Logothetis and Pauls (1995) for hints that it might].
Our results add to a growing body of evidence that adult visual representations remain at least somewhat malleable by experience (Nazir and O'Regan, 1990; Kobatake et al., 1998; Gauthier et al., 1999; Grill-Spector et al., 2000; Dill and Edelman, 2001; Baker et al., 2002; Fahle and Poggio, 2002; Sigala et al., 2002; Kourtzi et al., 2005; Dan and Poo, 2006; Freedman et al., 2006; Op de Beeck et al., 2006; Mruczek and Sheinberg, 2007) and show that this malleability extends to the core tolerance (invariance) properties of the ventral visual pathway (Kourtzi and DiCarlo, 2006; DiCarlo and Cox, 2007). The difference in selectivity was just over 4° within the fovea, which, given the prevailing notion that IT neurons have very large receptive fields, might argue that changes must have occurred at earlier visual stages. However, IT neurons can have receptive field sizes of only 1–2° (Op de Beeck and Vogels, 2000; DiCarlo and Maunsell, 2003). Moreover, our study design is closely related to studies of “perceptual learning,” which have shown little or no changes in early visual areas V1 and V2 (Ghose et al., 2002; but see Crist et al., 2001; Schoups et al., 2001) but moderate changes in intermediate visual area V4 (Yang and Maunsell, 2004), which provides input to IT. In sum, the existing data could reflect increasing potential for plasticity in higher visual areas or the expression of accumulated changes across a series of similarly plastic areas.
The plasticity observed here could reflect ongoing “fine-tuning” of visual representations, rather than being fundamental to the development of position-tolerant object representation. Thus, going forward, we must try to understand whether similar, perhaps even stronger effects are seen in developing animals. Similarly, the visual experience provided here is unlike that naturally encountered in that we briefly exposed each object at just one retinal position. During natural experience, objects tend to remain present for relatively long time intervals (seconds or more), whereas object motion and self-motion (especially saccadic eye movements) provide experience with the same object at different retinal positions over much shorter time intervals (tens of milliseconds). Interestingly, recent studies have found that manipulation of this natural temporal contiguity of object experience predictably alters human position (Cox et al., 2005), human pose tolerance (Wallis and Bülthoff, 2001), and monkey IT position tolerance (Li and DiCarlo, 2008). Thus, we speculate that neuronal tolerance all along the ventral stream is built by natural spatiotemporal experience with the visual world (especially objects). Even such learned tolerance will generalize somewhat to similar objects and nearby retinal positions (especially when that learning occurs at early visual levels in which encoded “features” are shared by many objects) such that experience with all objects at all positions is not required (Ullman and Soloviev, 1999; Serre et al., 2007). Indeed, it would be a mistake to take our results to imply that position-tolerant recognition of “novel” objects cannot be accomplished without visual experience of those specific objects at all positions. On the contrary, adult human discrimination of everyday objects is remarkably position-tolerant, even if those exact objects have never been previously encountered (e.g., a new phone vs a new laptop computer) (Biederman and Cooper, 1991).
In summary, the available data paint the following picture of position tolerance (Kravitz et al., 2008): in adult monkeys, neurons at the top of the ventral visual stream (IT) are selective among visual objects and maintain that selectivity across changes in retinal position within the neuron's receptive field (Tovée et al., 1994; Ito et al., 1995; Logothetis et al., 1995; DiCarlo and Maunsell, 2003). Those fields vary dramatically in size (Op de Beeck and Vogels, 2000; DiCarlo and Maunsell, 2003; Zoccolan et al., 2007) and are not fully position-invariant (roughly consistent with visual priming studies) (Biederman and Bar, 1998; Bar and Biederman, 1999). However, the rapidly evoked population response of only hundreds of such neurons can easily support position-tolerant categorization and identification of such objects (Hung et al., 2005), and the key property is that rank-order object selectivity is reasonably maintained in each neuron (e.g., DiCarlo and Cox, 2007). Studies using rapid visual categorization (Potter, 1976; Thorpe et al., 1996), single-neuron recording (Quiroga et al., 2005), and fMRI (Ishai et al., 1999; Grill-Spector et al., 2001) suggest a similarly powerful, rapidly evoked population representation in human occipitotemporal cortex (albeit very difficult to compare directly with the monkey). Our results here do not question the existence of that highly position-tolerant population representation but, rather, bear on the central question of how it was constructed by the visual system in the first place. Models of the computational mechanisms underlying position-tolerant representation vary widely in their stance on this issue: some do not require experience (Olshausen et al., 1993), others depend on visual experience (Foldiak, 1991; Wallis and Baddeley, 1997; Wiskott and Sejnowski, 2002), and others are agnostic but open to the idea (Riesenhuber and Poggio, 1999; Ullman and Bart, 2004; Serre et al., 2007). Distinguishing among these alternatives is central not only because it would tell us something deep about the way the brain works, but because a more complete understanding of these learning principles might allow us to put them to use in building powerful artificial visual systems.
Footnotes
This work was supported by the National Institutes of Health (Grant NIH-R01-EY014970 to J.J.D.). Additional support was provided by The Pew Charitable Trusts and The McKnight Endowment for Neuroscience. D.D.C. was supported by a National Defence Science and Engineering Graduate Fellowship. We thank N. Kanwisher, J. Maunsell, and P. Sinha for early comments on this work, N. Li and N. Majaj for comments on this manuscript, and J. Deutsch, P. Mayo, M. Fogerson, and R. Marini for technical support.
References
- Baker CI, Behrmann M, Olson CR. Impact of learning on representation of parts and wholes in monkey inferotemporal cortex. Nat Neurosci. 2002;5:1210–1216. doi: 10.1038/nn960. [DOI] [PubMed] [Google Scholar]
- Bar M, Biederman I. Localizing the cortical region mediating visual awareness of object identity. Proc Natl Acad Sci U S A. 1999;96:1790–1793. doi: 10.1073/pnas.96.4.1790. [DOI] [PMC free article] [PubMed] [Google Scholar]
- Baylis GC, Rolls ET. Responses of neurons in the inferior temporal cortex in short term and serial recognition memory tasks. Exp Brain Res. 1987;65:614–622. doi: 10.1007/BF00235984. [DOI] [PubMed] [Google Scholar]
- Biederman I, Bar M. Subliminal visual priming. Psychol Sci. 1998;9:464–469. [Google Scholar]
- Biederman I, Cooper EE. Evidence for complete translational and reflectional invariance in visual object priming. Perception. 1991;20:585–593. doi: 10.1068/p200585. [DOI] [PubMed] [Google Scholar]
- Cox DD, Meier P, Oertelt N, DiCarlo JJ. ‘Breaking’ position-invariant object recognition. Nat Neurosci. 2005;8:1145–1147. doi: 10.1038/nn1519. [DOI] [PubMed] [Google Scholar]
- Crist RE, Li W, Gilbert CD. Learning to see: experience and attention in primary visual cortex. Nat Neurosci. 2001;4:519–525. doi: 10.1038/87470. [DOI] [PubMed] [Google Scholar]
- Dan Y, Poo MM. Spike timing-dependent plasticity: from synapse to perception. Physiol Rev. 2006;86:1033–1048. doi: 10.1152/physrev.00030.2005. [DOI] [PubMed] [Google Scholar]
- Desimone R, Albright TD, Gross CG, Bruce C. Stimulus-selective properties of inferior temporal neurons in the macaque. J Neurosci. 1984;4:2051–2062. doi: 10.1523/JNEUROSCI.04-08-02051.1984. [DOI] [PMC free article] [PubMed] [Google Scholar]
- DiCarlo JJ, Cox DD. Untangling invariant object recognition. Trends Cogn Sci. 2007;11:333–341. doi: 10.1016/j.tics.2007.06.010. [DOI] [PubMed] [Google Scholar]
- DiCarlo JJ, Maunsell JHR. Form representation in monkey inferotemporal cortex is virtually unaltered by free viewing. Nat Neurosci. 2000;3:814–821. doi: 10.1038/77722. [DOI] [PubMed] [Google Scholar]
- DiCarlo JJ, Maunsell JHR. Anterior inferotemporal neurons of monkeys engaged in object recognition can be highly sensitive to object retinal position. J Neurophysiol. 2003;89:3264–3278. doi: 10.1152/jn.00358.2002. [DOI] [PubMed] [Google Scholar]
- DiCarlo JJ, Maunsell JH. Using neuronal latency to determine sensory-motor processing pathways in reaction time tasks. J Neurophysiol. 2005;93:2974–2986. doi: 10.1152/jn.00508.2004. [DOI] [PubMed] [Google Scholar]
- Dill M, Edelman S. Imperfect invariance to object translation in the discrimination of complex shapes. Perception. 2001;30:707–724. doi: 10.1068/p2953. [DOI] [PubMed] [Google Scholar]
- Dill M, Fahle M. The role of visual field position in pattern-discrimination learning. Proc R Soc Lond B Biol Sci. 1997;264:1031–1036. doi: 10.1098/rspb.1997.0142. [DOI] [PMC free article] [PubMed] [Google Scholar]
- Dill M, Fahle M. Limited translation invariance of human pattern recognition. Percept Psychophys. 1998;60:65–81. doi: 10.3758/bf03211918. [DOI] [PubMed] [Google Scholar]
- Duda RO, Hart PE, Stork DG. Pattern classification. Ed 2. New York: Wiley; 2001. [Google Scholar]
- Fahle M, Poggio T. Perceptual learning. Cambridge, MA: MIT; 2002. [Google Scholar]
- Foldiak P. Learning invariance from transformation sequences. Neural Comput. 1991;3:194–200. doi: 10.1162/neco.1991.3.2.194. [DOI] [PubMed] [Google Scholar]
- Freedman DJ, Riesenhuber M, Poggio T, Miller EK. Experience-dependent sharpening of visual shape selectivity in inferior temporal cortex. Cereb Cortex. 2006;16:1631–1644. doi: 10.1093/cercor/bhj100. [DOI] [PubMed] [Google Scholar]
- Gauthier I, Tarr MJ, Anderson AW, Skudlarski P, Gore JC. Activation of the middle fusiform ‘face area’ increases with expertise in recognizing novel objects. Nat Neurosci. 1999;2:568–573. doi: 10.1038/9224. [DOI] [PubMed] [Google Scholar]
- Ghose GM, Yang T, Maunsell JH. Physiological correlates of perceptual learning in monkey V1 and V2. J Neurophysiol. 2002;87:1867–1888. doi: 10.1152/jn.00690.2001. [DOI] [PubMed] [Google Scholar]
- Grill-Spector K, Kushnir T, Hendler T, Malach R. The dynamics of object-selective activation correlate with recognition performance in humans. Nat Neurosci. 2000;3:837–843. doi: 10.1038/77754. [DOI] [PubMed] [Google Scholar]
- Grill-Spector K, Kourtzi Z, Kanwisher N. The lateral occipital complex and its role in object recognition. Vision Res. 2001;41:1409–1422. doi: 10.1016/s0042-6989(01)00073-6. [DOI] [PubMed] [Google Scholar]
- Hung CP, Kreiman G, Poggio T, DiCarlo JJ. Fast readout of object identity from macaque inferior temporal cortex. Science. 2005;310:863–866. doi: 10.1126/science.1117593. [DOI] [PubMed] [Google Scholar]
- Ishai A, Ungerleider LG, Martin A, Schouten JL, Haxby JV. Distributed representation of objects in the human ventral visual pathway. Proc Natl Acad Sci U S A. 1999;96:9379–9384. doi: 10.1073/pnas.96.16.9379. [DOI] [PMC free article] [PubMed] [Google Scholar]
- Ito M, Tamura H, Fujita I, Tanaka K. Size and position invariance of neuronal responses in monkey inferotemporal cortex. J Neurophysiol. 1995;73:218–226. doi: 10.1152/jn.1995.73.1.218. [DOI] [PubMed] [Google Scholar]
- Kobatake E, Wang G, Tanaka K. Effects of shape-discrimination training on the selectivity of inferotemporal cells in adult monkeys. J Neurophysiol. 1998;80:324–330. doi: 10.1152/jn.1998.80.1.324. [DOI] [PubMed] [Google Scholar]
- Kourtzi Z, DiCarlo JJ. Learning and neural plasticity in visual object recognition. Curr Opin Neurobiol. 2006;16:152–158. doi: 10.1016/j.conb.2006.03.012. [DOI] [PubMed] [Google Scholar]
- Kourtzi Z, Betts LR, Sarkheil P, Welchman AE. Distributed neural plasticity for shape learning in the human visual cortex. PLoS Biol. 2005;3:e204. doi: 10.1371/journal.pbio.0030204. [DOI] [PMC free article] [PubMed] [Google Scholar]
- Kravitz DJ, Vinson LD, Baker CI. How position dependent is visual object recognition? Trends Cogn Sci. 2008;12:114–122. doi: 10.1016/j.tics.2007.12.006. [DOI] [PubMed] [Google Scholar]
- Li N, DiCarlo JJ. Unsupervised natural experience rapidly alters invariant object representation in visual cortex. Science. 2008;321:1502–1507. doi: 10.1126/science.1160028. [DOI] [PMC free article] [PubMed] [Google Scholar]
- Logothetis NK, Pauls JP. Psychophysical and physiological evidence for viewer-centered object representation in the primate. Cereb Cortex. 1995;5:270–288. doi: 10.1093/cercor/5.3.270. [DOI] [PubMed] [Google Scholar]
- Logothetis NK, Pauls J, Poggio T. Shape representation in the inferior temporal cortex of monkeys. Curr Biol. 1995;5:552–563. doi: 10.1016/s0960-9822(95)00108-4. [DOI] [PubMed] [Google Scholar]
- Maunsell JH, Cook EP. The role of attention in visual processing. Philos Trans R Soc Lond B Biol Sci. 2002;357:1063–1072. doi: 10.1098/rstb.2002.1107. [DOI] [PMC free article] [PubMed] [Google Scholar]
- Mruczek RE, Sheinberg DL. Context familiarity enhances target processing by inferior temporal cortex neurons. J Neurosci. 2007;27:8533–8545. doi: 10.1523/JNEUROSCI.2106-07.2007. [DOI] [PMC free article] [PubMed] [Google Scholar]
- Nazir TA, O'Regan JK. Some results on translation invariance in the human visual system. Spat Vis. 1990;5:81–100. doi: 10.1163/156856890x00011. [DOI] [PubMed] [Google Scholar]
- Olshausen BA, Anderson CH, Van Essen DC. A neurobiological model of visual attention and invariant pattern recognition based on dynamic routing of information. J Neurosci. 1993;13:4700–4719. doi: 10.1523/JNEUROSCI.13-11-04700.1993. [DOI] [PMC free article] [PubMed] [Google Scholar]
- Op de Beeck HP, Vogels R. Spatial sensitivity of macaque inferior temporal neurons. J Comp Neurol. 2000;426:505–518. doi: 10.1002/1096-9861(20001030)426:4<505::aid-cne1>3.0.co;2-m. [DOI] [PubMed] [Google Scholar]
- Op de Beeck HP, Baker CI, DiCarlo JJ, Kanwisher NG. Discrimination training alters object representations in human extrastriate cortex. J Neurosci. 2006;26:13025–13036. doi: 10.1523/JNEUROSCI.2481-06.2006. [DOI] [PMC free article] [PubMed] [Google Scholar]
- Op de Beeck HP, Deutsch JA, Vanduffel W, Kanwisher NG, DiCarlo JJ. A stable topography of selectivity for unfamiliar shape classes in monkey inferior temporal cortex. Cereb Cortex. 2008;18:1676–1694. doi: 10.1093/cercor/bhm196. [DOI] [PMC free article] [PubMed] [Google Scholar]
- Potter MC. Short-term conceptual memory for pictures. J Exp Psychol Hum Learn. 1976;2:509–522. [PubMed] [Google Scholar]
- Quiroga RQ, Reddy L, Kreiman G, Koch C, Fried I. Invariant visual representation by single neurons in the human brain. Nature. 2005;435:1102–1107. doi: 10.1038/nature03687. [DOI] [PubMed] [Google Scholar]
- Reynolds JH, Pasternak T, Desimone R. Attention increases sensitivity of V4 neurons. Neuron. 2000;26:703–714. doi: 10.1016/s0896-6273(00)81206-4. [DOI] [PubMed] [Google Scholar]
- Riesenhuber M, Poggio T. Hierarchical models of object recognition in cortex. Nat Neurosci. 1999;2:1019–1025. doi: 10.1038/14819. [DOI] [PubMed] [Google Scholar]
- Robinson DA. A method of measuring eye movement using a scleral search coil in a magnetic field. IEEE Trans Biomed Eng. 1963;10:131–145. doi: 10.1109/tbmel.1963.4322822. [DOI] [PubMed] [Google Scholar]
- Schoups A, Vogels R, Qian N, Orban G. Practising orientation identification improves orientation coding in V1 neurons. Nature. 2001;412:549–553. doi: 10.1038/35087601. [DOI] [PubMed] [Google Scholar]
- Serre T, Wolf L, Bileschi S, Riesenhuber M, Poggio T. Robust object recognition with cortex-like mechanisms. IEEE Trans Pattern Anal Mach Intell. 2007;29:411–426. doi: 10.1109/TPAMI.2007.56. [DOI] [PubMed] [Google Scholar]
- Sheinberg DL, Logothetis NK. The role of temporal cortical areas in perceptual organization. Proc Natl Acad Sci U S A. 1997;94:3408–3413. doi: 10.1073/pnas.94.7.3408. [DOI] [PMC free article] [PubMed] [Google Scholar]
- Sigala N, Logothetis NK. Visual categorization shapes feature selectivity in the primate temporal cortex. Nature. 2002;415:318–320. doi: 10.1038/415318a. [DOI] [PubMed] [Google Scholar]
- Sigala N, Gabbiani F, Logothetis NK. Visual categorization and object representation in monkeys and humans. J Cogn Neurosci. 2002;14:187–198. doi: 10.1162/089892902317236830. [DOI] [PubMed] [Google Scholar]
- Snedecor GW, Cochran WD. Statistical methods. Ames, IA: Iowa UP; 1967. [Google Scholar]
- Thorpe S, Fize D, Marlot C. Speed of processing in the human visual system. Nature. 1996;381:520–522. doi: 10.1038/381520a0. [DOI] [PubMed] [Google Scholar]
- Tovée MJ, Rolls ET, Azzopardi P. Translation invariance in the responses to faces of single neurons in the temporal visual cortical areas of the alert macaque. J Neurophysiol. 1994;72:1049–1060. doi: 10.1152/jn.1994.72.3.1049. [DOI] [PubMed] [Google Scholar]
- Tsunoda K, Yamane Y, Nishizaki M, Tanifuji M. Complex objects are represented in macaque inferotemporal cortex by the combination of feature columns. Nat Neurosci. 2001;4:832–838. doi: 10.1038/90547. [DOI] [PubMed] [Google Scholar]
- Ullman S, Bart E. Recognition invariance obtained by extended and invariant features. Neural Netw. 2004;17:833–848. doi: 10.1016/j.neunet.2004.01.006. [DOI] [PubMed] [Google Scholar]
- Ullman S, Soloviev S. Computation of pattern invariance in brain-like structures. Neural Netw. 1999;12:1021–1036. doi: 10.1016/s0893-6080(99)00048-9. [DOI] [PubMed] [Google Scholar]
- Van Essen DC, Anderson CH, Felleman DJ. Information processing in the primate visual system: an integrated systems perspective. Science. 1992;255:419–423. doi: 10.1126/science.1734518. [DOI] [PubMed] [Google Scholar]
- Vogels R, Orban GA. Activity of inferior temporal neurons during orientation discrimination with successively presented gratings. J Neurophysiol. 1994;71:1428–1451. doi: 10.1152/jn.1994.71.4.1428. [DOI] [PubMed] [Google Scholar]
- Wallis G, Baddeley R. Optimal, unsupervised learning in invariant object recognition. Neural Comput. 1997;9:883–894. doi: 10.1162/neco.1997.9.4.883. [DOI] [PubMed] [Google Scholar]
- Wallis G, Bülthoff HH. Effects of temporal association on recognition memory. Proc Natl Acad Sci USA. 2001;98:4800–4804. doi: 10.1073/pnas.071028598. [DOI] [PMC free article] [PubMed] [Google Scholar]
- Wiskott L, Sejnowski TJ. Slow feature analysis: unsupervised learning of invariances. Neural Comput. 2002;14:715–770. doi: 10.1162/089976602317318938. [DOI] [PubMed] [Google Scholar]
- Yang T, Maunsell JH. The effect of perceptual learning on neuronal responses in monkey visual area V4. J Neurosci. 2004;24:1617–1626. doi: 10.1523/JNEUROSCI.4442-03.2004. [DOI] [PMC free article] [PubMed] [Google Scholar]
- Zoccolan D, Cox DD, DiCarlo JJ. Multiple object response normalization in monkey inferotemporal cortex. J Neurosci. 2005;25:8150–8164. doi: 10.1523/JNEUROSCI.2058-05.2005. [DOI] [PMC free article] [PubMed] [Google Scholar]
- Zoccolan D, Kouh M, Poggio T, DiCarlo JJ. Trade-off between object selectivity and tolerance in monkey inferotemporal cortex. J Neurosci. 2007;27:12292–12307. doi: 10.1523/JNEUROSCI.1897-07.2007. [DOI] [PMC free article] [PubMed] [Google Scholar]