

Abstract
Genome-wide linkage analysis was carried out for systolic and diastolic blood pressures in the Hypertension Genetic Epidemiology Network. We investigated the role of gene-age interactions using a recently developed variance components method that incorporates age variation in genetic effects. Substantially improved linkage evidence, in terms of both the number of linkage peaks and their significance levels, was observed. Twenty-six linkage peaks were identified with maximum LOD scores ranging between 3.0 and 4.6, fifteen of which were cross-validated by the literature. The chromosomal region 1p36 that showed the highest lod score in our study was found being supported by evidences from three literature. The new method also led to vastly improved validation across ethnic groups. Ten out of the fifteen supported linkage peaks were cross validated between two different ethnic groups, and two peaks on chromosomal region 1q31 and 16p11 were validated in three ethnic groups. In conclusion, this investigation demonstrates that genetic effects on blood pressure vary by age. The improved genetic linkage results presented here should help in identifying the specific genetic variants that explain the observed results.
Keywords: blood pressure, genetics, hypertension, linkage, gene-age interactions, QTL effect
Introduction
Hypertension, a significant risk factor for many cardiovascular, cerebrovascular, and renal diseases, affects about one quarter of adults in industrialized countries.1,2 Blood pressure has long been known to be a complex trait influenced by both genetic and environmental factors.3,4 Over the last decade, a number of genome-wide linkage scans for blood pressure or hypertension have been conducted.5,6 Among chromosomal regions found to be linked to blood pressure or hypertension, very few were validated across studies or ethnic groups. This lack of consistency may be due to different trait definitions employed in the studies, e.g., hypertension status versus blood pressure level. Genetic heterogeneity among populations may explain in part the inconsistent signals found across ethnic groups. Different clustering of interacting covariates within each of the population groups may hamper cross validation across studies. A large number of genes are potentially involved in blood pressure regulation and the effects of these genes may be modulated by age. Interactions among genes and environmental factors, including age-dependent genetic effects, are routinely ignored, making the individual gene effects even more difficult to detect. Since age is a complex biological construct, it may serve as a surrogate for a variety of interacting covariates. If so, incorporation of gene-age interactions may not only enhance gene discovery, it may also render findings from across studies more comparable to each other. Here we report results of genome-wide linkage analysis of blood pressure using this novel methodology7 and data from the Hypertension Genetic Epidemiology Network (HyperGEN) Study.8
Methods
Subjects
The HyperGEN study is one of the four multicenter networks participating the National Heart, Lung and Blood Institute (NHLBI) Family Blood Pressure Program (FBPP).9 The study populations and design have been described previously in detail.8 Briefly, Non-Hispanic Caucasian and Non-Hispanic African American families, each containing at least two siblings with mild to severe hypertension were recruited. Severe hypertension was defined as systolic blood pressure (SBP) ≥160 mm Hg or diastolic blood pressure (DBP) ≥100 mm Hg, or the use of two or more classes of antihypertensive medications. Mild hypertension was defined as 140 mm Hg ≤SBP<160 mm Hg or 90 mm Hg ≤DBP<100 mm Hg, or the use of only one class of antihypertensive medication. Random samples of age-matched subjects (188 Caucasians and 202 African Americans) from the same source populations were recruited and genotyped to estimate allele frequencies of microsatellite markers for each ethnic group. Parents and unmedicated adult offspring of the hypertensive siblings were also recruited. Subjects were excluded for hypertension onset age≥60 years, hypertension secondary to primary kidney disease or type I diabetes. Study protocols and the process for obtaining informed consent were approved by the Institutional Review Committees at the field centers.
The total sample size of HyperGEN subjects with available blood pressure phenotypes and genome-wide microsatellite genotype data was 3,289, of which 1,683 were Caucasians from 431 families, 1,606 were African Americans from 525 families. Among the 3,289 subjects, 2,247 were siblings and 1,042 were offspring. Linkage analyses were conducted separately in Caucasians and African Americans.
Phenotypes and covariate adjustments
In this study we focused on systolic and diastolic sitting blood pressures (SBP and DBP). Blood pressures were measured using the Dinamap device (model 1846 SX/P, Critikon, Tampa, FL). At the beginning of the study, central training and certification was provided to all study personnel. Average SBP and DBP based on the second and third measurements from a series of blood pressure measurements were used as quantitative traits. Before any linkage analyses, the phenotypes were adjusted within ethnicity and sex groups by regressing on age, age2, age3, and field center. Stepwise regression was used for the covariate adjustments: terms with p values smaller than 0.05 were retained in forward selection and those with p values larger than 0.05 were removed from the model in backward elimination. The residuals were standardized to a mean of zero and a variance of one. Skewness and kurtosis were checked as normality indicators. We removed one outlier for each of the SBP and DBP linkage analyses.
Genotyping and quality control
In all, 366 microsatellite markers, with average spacing of 9 cM, were genotyped by the National Heart, Lung, and Blood Institute Mammalian Genotyping Service (Marshfield, WI). The gender-averaged genetic distances (in cM) were retrieved from the Marshfield human genetic linkage map. For more details on gel preparation, polymerase chain reaction and genetic map, see [Weber and Broman, 2001].10 GRR11 and ASPEX12 were used to check for and correct pedigree errors, as well as sample mix-ups between subjects. PedCheck13 and MapMaker/SIBS14 were used to remove Mendelian inconsistencies within families, after the pedigrees were corrected. Ethnicity-specific allele frequencies were calculated based on separate random samples recruited in the HyperGEN study. Total missing rate of the genotype marker data is 7.7%, which includes those not originally genotyped and those deleted due to quality problems.
Statistical Analysis
We applied the generalized variance components model that allows both QTL and polygenic components varying as Gaussian functions of age.7 The exact functional forms were inspired by prior studies in cross-sectional15 as well as longitudinal16 data which demonstrated non-monotonic age trends in genetic effects. Details of the methods can be found in supplemental materials. We computed multi-point IBDs at each marker location with Genehunter17 software and conducted likelihood ratio tests using the QTLtrends package.7
Results
Mean and standard deviations for SBP, DBP and age of the 3,289 subjects included in this study are shown in Table 1, separated by sex, generation and ethnic groups. According to the design of the study, all siblings were hypertensive, and most were treated with antihypertensive medications, while offspring were unmedicated.
Table 1.
Sample sizes and statistics of blood pressure and age.
| Population | N* | HT† (%) |
Severe HT (%) |
MED‡ (%) |
SBP (mm Hg) |
DBP (mm Hg) |
Age | ||||
|---|---|---|---|---|---|---|---|---|---|---|---|
| Mean | SD | Mean | SD | Mean | SD | ||||||
| Caucasians | |||||||||||
| Hypertensive sibling |
Male | 494 | 100 | 49.2 | 91.7 | 129.5 | 19.9 | 73.3 | 11.0 | 60.7 | 9.1 |
| Female | 546 | 100 | 41.9 | 90.8 | 129.5 | 20.8 | 66.9 | 10.5 | 60.7 | 9.7 | |
| Offspring | Male | 322 | 9.3 | 2.2 | 2.5 | 117. 9 | 13.2 | 71.6 | 8.9 | 37.5 | 8.2 |
| Female | 321 | 4.4 | 0.6 | 2.5 | 108.8 | 13.3 | 66.5 | 8.4 | 39.3 | 7.5 | |
|
African Americans |
|||||||||||
| Hypertensive sibling |
Male | 376 | 100 | 48.9 | 85.1 | 136.1 | 22.3 | 80.5 | 12.5 | 51.5 | 10.3 |
| Female | 831 | 100 | 46.1 | 88.0 | 133.6 | 23.0 | 74.2 | 11.1 | 50.8 | 11.0 | |
| Offspring | Male | 157 | 13.4 | 1.3 | 1.9 | 121.4 | 13.3 | 71.3 | 9.4 | 31.2 | 8.2 |
| Female | 242 | 12.0 | 4.1 | 4.5 | 116.0 | 16.4 | 69.4 | 10.6 | 31.8 | 8.5 | |
N: sample size
HT: hypertension status
MED: status of anti-hypertensive medication use.
We first evaluated the gene-age interaction in the polygenetic component, which showed much stronger age trends in SBP than those in DBP. The p values are smaller than 10−12 for SBP in both African American and Caucasian samples, 0.00091 and 0.0046 for DBP in African Americans and Caucasians, respectively. Under the polygenic model, SBP was estimated to have a maximum heritability of 0.68 at age 59 in African Americans and a maximum heritability of 0.69 at age 74 in Caucasians. On the other hand, using the traditional variance components method based on constant heritability assumption, we obtained an average heritability of 0.29 for African Americans and 0.24 for Caucasians. Details are presented in Table 2.
Table 2.
Age trend tests in polygenic component.
| Population | Peak Heritability (S.E.) |
Age at Peak Heritability (S.E.) |
Peak Spread Parameter (S.E.) |
Average Heritability (S.E.) |
p value |
|---|---|---|---|---|---|
| Caucasians | |||||
| SBP | 0.69 (0.02) | 74.4 (1.0) | 25.0 (0.9) | 0.24 (0.04) | <10−12 |
| DBP | 0.36 (0.03) | 60.1 (2.3) | 26.8 (2.7) | 0.26 (0.04) | 0.0046 |
|
African Americans |
|||||
| SBP | 0.68 (0.02) | 58.5 (0.9) | 21.5 (0.8) | 0.29 (0.04) | <10−12 |
| DBP | 0.46 (0.03) | 45.9 (1.5) | 21.5 (2.1) | 0.39 (0.04) | 0.00091 |
Multipoint variance components linkage analyses with and without age variation in QTL effects (gene-age interactions) were conducted. There were twenty-six linkage peaks identified with logarithm of odds (LOD) scores larger than 3 in either African Americans or Caucasians for SBP or DBP. Sixteen of the twenty-six peaks are for SBP in African Americans. The LOD score plot is shown in Figure 1. The other linkage scan plots are presented as part of supplementary material (Figures S1 - S3, see http://hyper.ahajournals.org). To make our linkage results comparable with those from traditional variance components approaches, all LOD scores were converted to a reference test statistic with half-half mixture of point mass at zero and one degree of freedom Chi-square, i.e., using the LOD score scale that traditional variance components approaches employ. Those linkage peaks with maximum LOD scores larger than 3 using gene-age interactions are presented in Table 3, LOD scores obtained under traditional methods are included as well. Markers adjacent to the linkage peaks with LOD scores larger than 3 are also listed in Table 3. In summary, we found twenty-three linkage peaks for SBP, out of which thirteen peaks were validated by results from previous genome-wide linkage scans (see the Discussion section). For DBP, we found four chromosome regions, one of which links to SBP as well, and three of them were replicated by the literature. Here, the replication refers to the reported blood pressure/hypertension linkage results that are listed as top signals in those studies and in the vicinity of our regions.
Figure 1.
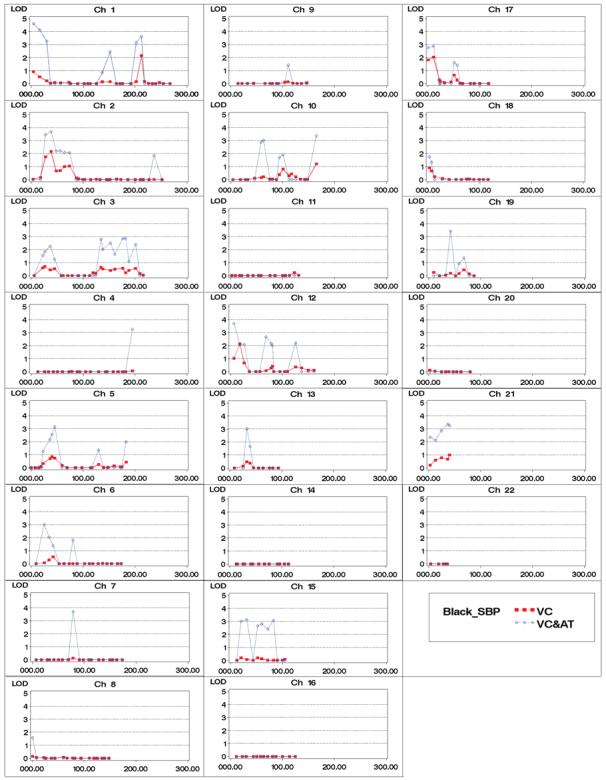
SBP genome-wide linkage results for African Americans. VC: traditional variance component approach, VC&AT: variance component with age trends.
Table 3.
Linkage peaks with maximum LOD scores larger than 3, and markers under the peaks with LOD scores larger than 3.
| Peak Region |
Marker | Pos* (cM) |
LOD w/o interaction AA†/ca‡ |
LOD w/ interaction AA/CA |
Cross-validation |
|---|---|---|---|---|---|
| 1p36 | D1S468 D1S1612 D1S1597 |
4.22 16.22 29.93 |
0.9/0.0 0.5/0.0 0.2/0.0 |
4.6/1.8 4.1/1.3 3.3/0.9 |
LOD=3.9 centered at TNFRSF1B gene in Anglo-Celtic Caucasians with hypertension status trait 22; LOD=3.5 at D1S2672 in French Canadians with hypertension status trait 23; LOD=2.8 at D1S468 in Australians with hypertension status trait 24 |
| 1q31 | D1S518 D1S1660 |
202.19 212.44 |
0.1/0.0 2.1/0.0 |
3.2/0.0 3.6/0.0 |
LOD=2.8 at 192 cM in Caucasians with hypertension status trait25; LOD=2.34 at 203 cM in Mexican Americans with mean arterial BP trait26 |
| 2p24-p25 | D2S1400 D2S1360 |
27.6 38.33 |
1.8/0.0 2.2/0.0 |
3.5/1.0 3.7/0.9 |
LOD=3.02 at 27 cM in Talana population with hypertension status trait30 |
| 3p14 | D3S4542 D3S2329 |
89.91 91.18 |
0.0/0.7 0.0/0.9 |
0.0/3.1 0.0/3.3 |
p value=0.0001 at 88.6-117.8 cM in Caucasians using meta analysis31 |
| 4q21 | D4S2361 | 93.48 | 0.0/1.3 | 0.0/3.5 | Z score=3.2 at 95-132 cM in Caucasians with SBP trait28 |
| 4q35 | D4S408 | 195.06 | 0.1/0.0 | 3.3/0.0 | |
| 5p13 | D5S1470 | 45.34 | 0.7/0.0 | 3.2/1.1 | LOD=2.03 at 53 cM in Caucasians with pulse pressure trait32 |
| 6p23 | D6S2434 | 25.08 | 0.1/0.0 | 3.0/0.0 | |
| 7p21 | D7S513 | 17.74 | 0.0/1.7 | 0.0/3.2 | |
| 7q11 | D7S3046 | 78.65 | 0.1/0.1 | 3.7/3.6 | LOD=2.42 at 71 cM in Caucasians with pulse pressure trait32 |
| 8p21-p22 | D8S1145§ D8S136§ |
37.04 43.96 |
0.0/1.2 0.0/1.9 |
2.4/3.1 0.0/3.0 |
LOD=1.8 at the same marker in Dutch families with DBP trait33 p value=0.0002 at 42.9 cM in Taiwanese families with SBP trait34 |
| 9q12 | D9S301§ | 66.32 | 0.0/1.7 | 2.3/3.3 | |
| 9q21 | D9S1122 D9S922 |
75.88 80.31 |
0.0/0.8 0.0/1.1 |
0.0/3.1 0.0/3.3 |
|
| 10p11 | D10S1208 | 63.3 | 0.2/0.0 | 3.0/0.0 | |
| 10q26 | D10S1248 | 165.27 | 1.2/0.0 | 3.4/0.0 | |
| 12p12-p13 | D12S373§ D12S372 |
36.06 6.42 |
0.0/0.5 1.0/0.0 |
3.3∥/1.6 3.7/0.0 |
LOD=3.44 at 40 cM in Chinese population with hypertension status trait35 |
| 13q13-q14 | D13S1493 D13S894 D13S325 D13S788 |
25.8 32.9 38.96 45.55 |
0.2/0.6 0.5/0.7 0.4/0.9 0.0/1.9 |
0.0/3.2 3.0/4.2 1.7/3.8 0.0/4.5 |
|
| 13q33 | D13S779 | 82.93 | 0.0/1.0 | 0.0/3.5 | |
| 14q24 | D14S588 | 75.61 | 0.0/0.7 | 0.0/3.0 | |
| 14q31 | D14S606 D14S617 |
91.62 105.53 |
0.0/0.3 0.0/0.7 |
0.0/3.3 0.0/3.5 |
LOD=2 at 100 cM in Chinese and Japanese Americans with hypertension trait36; LOD=3.0 at 106 cM in combined European American and African American sample with pulse pressure trait37 |
| 15q13-q14 | D15S165 ACTA |
20.24 31.46 |
0.2/1.0 0.1/1.1 |
3.0/1.9 3.1/1.7 |
|
| 15q22-q25 | D15S1507 D15S655 |
60.17 82.84 |
0.1/1.5 0.0/0.3 |
2.8/3.5 3.1/0.7 |
p value=0.0033 at 97 cM in Caucasians with SBP trait38 |
| 16p11 | D16S753 | 57.79 | 0.0/0.8 | 0.0/3.5 | LOD=2.73 at 52 cM in Mexican Americans with trait as longitudinal change in SBP26; LOD=2.74 at 64 cM in Chinese population with SBP trait27; Z score=3.2 at 40-62 cM in Caucasians with SBP trait28 |
| 19p13 | D19S714 | 42.28 | 0.2/0.0 | 3.4/0.8 | LOD=2.14 at 48.5 cM in African Americans with SBP trait39; LOD=2.39 at 47 cM in Nigerians with SBP trait40 |
| 21q22 | D21S1440 D21S2055 |
36.77 40.49 |
0.7/0.2 1.0/0.0 |
3.4/1.6 3.2/0.0 |
LOD=2.82 at the same marker in Mexican Americans with SBP trait41 |
| 22q12 | D22S689§ | 28.57 | 0.0/0.0 | 3.3∥/0.0 | LOD=2.07 at 32.4 cM in Finlander with hypertension status trait42 |
Positions are based on the Marshfield map
AA: African Americans
CA: Caucasians
LOD scores of this marker are for DBP phenotype, others are for SBP
maximum likelihood estimate converges at the boundary of parameter space.
Discussion
One complication of the blood pressure phenotype is that it is influenced by age in complex ways. As individuals grow from birth, many physiological and biological changes take place, increasing risk for hypertension as a result of accumulating changes with age. Thus age represents a complex surrogate for a host of underlying phenomena even though its measurement is simple and accurate. Unfortunately, most investigators treat age as a nuisance parameter and simply attempt to “remove” the effect of age through statistical adjustment for the effects on mean and variance. Such ad hoc approaches do not adjust away the age variation in the covariance structure (which includes the genetic effects). Age trends were demonstrated in both the genetic heritability and familial environmental components for systolic blood pressure in cross-sectional15 as well as in longitudinal16 family data. These studies clearly established the existence of age variation in genetic effects, i.e., the covariance between family members. In addition, they demonstrated that such gene-age interactions are not monotonic in age.
In previous genome-wide linkage analysis of hypertensive siblings conducted by the HyperGEN Study, Rao et al18 reported that chromosome 2 may harbor hypertension susceptibility genes in African Americans. The multipoint linkage analysis yielded a LOD score of 2.08 at 64 cM from the p-telomere on chromosome 2. Though the evidence on chromosome 2 was not supported well in Caucasians, the African American sample consistently showed up in all analyses by severity of hypertension and stratified by the age at diagnosis. When the hypertensive sibs and their offspring data were pooled, another LOD score peak emerged at 38 cM with a peak LOD score of 2.2. The LOD score at 64 cM was, however, reduced to 1.0 after pooling the younger offspring, suggesting that genes regulating blood pressure may have different effect sizes at different life stages and traditional linkage analysis likely suffered from certain limitations. In particular, despite biological evidence to the contrary, 19, 20 all linkage analyses assumed constant effect of the QTL across all ages. With the age trend modeled in the QTL component, the LOD scores increased to 3.7 and 2.1 at 38 cM and 64 cM, respectively. In addition, QTL variance peaked at age 41 when estimated at 38 cM, and at age 73 when estimated at 64 cM, This is concordant with our observation that hypertensive sibling data supported linkage at 64 cM and new linkage evidence emerged at 38 cM when pooled with the offspring data. Though the original linkage peak appeared as a single QTL and spanned a wide region on chromosome 2p, our analysis involving gene-age interactions actually suggested two different peaks at 38 cM and 64 cM. This region contains many potential hypertension and heart disease related genes. For example, apolipoprotein B (apoB) is the primary surface component of low density lipoproteins particles and is associated with an increased risk of coronary heart disease.21 PRKCE is a member of protein kinase C (PKC) family of serine- and threonine-specific protein kinases that is involved in several different cellular functions, such as neuron channel activation, apoptosis, cardioprotection from ischemia, heat shock response, as well as insulin exocytosis. The cardiac sodium/calcium exchanger 1 (SLC8A1) is a bidirectional calcium transporter that contributes to the electrical activity of the heart. The largest gene in the region is anaplastic lymphoma kinase (ALK) which shows sequence similarity to the insulin receptor subfamily of kinases.
It is interesting to note that the chromosomal region 1p36, which has the highest LOD score of 4.6 in our study, is supported by the largest number of studies in the literature.22-24 Linkage and association analysis of candidate gene TNFRSF1B in this region, which was implicated in insulin resistance and metabolic syndrome disorders, was studied.22 Obesity-associated hypertension23 and essential hypertension24 were suggested to be linked to this region. In addition, many other linkage results ended up cross-validating several hypertension or blood pressure QTLs reported in the literature in different ethnic populations. Ten of the twenty-six linkage peaks were cross validated in two different ethnic groups and two additional peaks were cross validated in three ethnic groups. The linkage peak found in African Americans at marker D1S518 on chromosome 1 was replicated in both Caucasians25 and Mexican Americans.26 Some interesting candidate genes reside in this region as well. REN plays an important role in renin-angiotensin-aldosterone system (RAAS) pathway that regulates blood pressure and fluid balance. ADORA1 codes an adenosine receptor with a suggested role in kidney function and ethanol intoxication in animal studies. The linkage peak found at D16S753 in Caucasians was cross-validated in Mexican Americans,26 Chinese,27 and Caucasians.28 SCNN1B that codes one subunit of the epithelial sodium channel and SLC5A2 that involves absorptive mechanism for D-glucose in kidney are all promising candidate genes in this region.
Within the HyperGEN study, using traditional variance components methods failed to find linkage results consistent across Caucasians and African Americans. Cross-validation improved when gene-age interaction was incorporated. For example, two chromosome regions (7q11 and 13q13-14) yielded LOD scores larger than 3 in both ethnic groups. Consistent evidence across populations may provide added comfort that it is likely to be a true positive. It suggests the existence of genes in those regions related to blood pressure regulation that are common for all ethnic groups.
One limitation of this linkage analysis is that most of the hypertensive siblings were treated with anti-hypertensive medications (although the offspring were not). The treatments must have confounded the measured blood pressure which could potentially mask linkage evidence. Therefore, it is possible that the results reported here may still be underestimated. Since the data were analyzed by standard as well as the new variance components linkage methods using the same phenotypes, the limitations due to medication effects should apply to both approaches. Another limitation is that we modeled age trends using Gaussian functions in this study. If the true trends severely deviate from the Gaussian functional form, the current approach may yet again underestimate the linkage signals. While it is possible that some of the linkage peaks identified may represent false positive errors, gene-age interactions are physiologically plausible and supported by evidence from genetic epidemiology studies.15, 16 For a complex trait such as blood pressure, hundreds (http://cmbi.bjmu.edu.cn/genome/candidates/snps.html) if not thousands of genes may be involved in the underlying regulation pathways, with the effect size of each being so small that false negative error is a serious concern, especially at the beginning stage of hypertension gene discovery.
Perspectives
While there have been quite a few studies devoted to dissecting the genetic effects on hypertension, it is widely recognized that the findings from any study in general poorly cross-validated those from other studies. Cross-validation across multiple studies is notoriously lacking in the literature which tends to be attributed to heterogeneity of one sort or another. We find it interesting that Table 3 demonstrates much better cross-validation even across ethnicity within our own study when the gene-age interaction was added. It is possible that different studies in the literature may represent different constellations of important interactions and ignoring such interactions may lead to inconsistent findings. We speculate that age may be acting as a surrogate for a host of unmeasured attributes and incorporation of gene-age interactions may overcome part of the inconsistencies. After allowing genetic effects to vary by age, evidence for linkage has increased substantially when compared to traditional linkage methods. The stronger linkage peaks help prioritize areas for further follow up. In addition, these models may help estimate the ages at which subjects should be studied to maximize the expression of the genetic effect and increase the power of association studies for various phenotypes. This type of reasoning seems validated by a recent association study29 that took age into account.
Supplementary Material
Acknowledgments
We thank the participants of the HyperGEN Study; a list of the HyperGEN Participating Institutions follows: University of Utah (Network Coordinating Center, Field Center, and Molecular Genetics Lab); University of Alabama at Birmingham (Field Center); Boston University (Field Center); University of Minnesota (Field Center and Biochemistry Lab); University of North Carolina (Field Center); Washington University (Data Coordinating Center); Weil Cornell Medical College (Echo Reading Center); National Heart, Lung, & Blood Institute.
Sources of Funding
This study was supported partly by a grant from the National Institute of General Medical Sciences, GM 28719, and the HyperGEN Network is funded by cooperative agreements (U10) with NHLBI: HL54471, HL54472, HL54473, HL54495, HL54496, HL54497, HL54509, HL54515.
Footnotes
Disclosures
None.
References
- 1.JNC The Sixth Report of the Joint National Committee on Prevention, Detection, Evaluation, and Treatment of High Blood Pressure. Arch Intern Med. 1997;157:2413–2446. doi: 10.1001/archinte.157.21.2413. (1991–94) [DOI] [PubMed] [Google Scholar]
- 2.Guidelines Subcommittee World Health Organization–International Society of Hypertension Guidelines for the Management of Hypertension. J Hypertens. 1999;17:151–183. (1999) [PubMed] [Google Scholar]
- 3.Lifton RP. Molecular genetics of human blood pressure variation. Science. 1996;272:676–680. doi: 10.1126/science.272.5262.676. [DOI] [PubMed] [Google Scholar]
- 4.Hamet P, Pausova Z, Adarichev V, Adaricheva K, Tremblay J. Hypertension: genes and environment. J Hypertens. 1998;16:397–418. doi: 10.1097/00004872-199816040-00001. [DOI] [PubMed] [Google Scholar]
- 5.Garcia EA, Newhouse S, Caulfield MJ, Munroe PB. Genes and hypertension. Curr Pharm Des. 2003;9:1679–1689. doi: 10.2174/1381612033454513. [DOI] [PubMed] [Google Scholar]
- 6.Samani NJ. Genome scans for hypertension and blood pressure regulation. Am J Hypertens. 2003;16:167–171. doi: 10.1016/s0895-7061(02)03244-2. [DOI] [PubMed] [Google Scholar]
- 7.Shi G, Rao DC. Ignoring temporal trends in genetic effects substantially reduces power of quantitative trait linkage analysis. Genet Epidemiol. 2008;32:61–72. doi: 10.1002/gepi.20263. [DOI] [PubMed] [Google Scholar]
- 8.Williams RR, Rao DC, Ellison RC, Arnett DK, Heiss G, Oberman A, Eckfeldt JH, Leppert MF, Province MA, Mockrin SC, Hunt SC. Methodology and recruitment in the HyperGEN Network. Ann Epidemiol. 2000;10:389–400. doi: 10.1016/s1047-2797(00)00063-6. [DOI] [PubMed] [Google Scholar]
- 9.The FBPP Investigators Multi-centre genetic study of hypertension: The Family Blood Pressure Program. Hypertension. 2002;39:3–9. doi: 10.1161/hy1201.100415. [DOI] [PubMed] [Google Scholar]
- 10.Weber JL, Broman KW. Genotyping for human whole-genome scans: past, present, and future. Adv Genet. 2001;42:77–96. doi: 10.1016/s0065-2660(01)42016-5. [DOI] [PubMed] [Google Scholar]
- 11.Abecasis GR, Cherny SS, Cookson WOC, Cardon LR. GRR: graphical representation of relationship errors. Bioinformatics. 2001;17:742–743. doi: 10.1093/bioinformatics/17.8.742. [DOI] [PubMed] [Google Scholar]
- 12.Hinds D, Risch N. The ASPEX package: affected sib-pair exclusion mapping. 1999 v1.88, [ ftp://lahmed.stanford.edu/pub/aspex/doc/usage.html]
- 13.O'Connell J, Weeks DE. Pedcheck: a program for identification of genotype incompatibilities in linkage analysis. Am J Hum Genet. 1998;63:259–266. doi: 10.1086/301904. [DOI] [PMC free article] [PubMed] [Google Scholar]
- 14.Kruglyak L, Lander ES. Complete multipoint sib-pair analysis of qualitative and quantitative traits. Am J Hum Genet. 1995;57:439–454. [PMC free article] [PubMed] [Google Scholar]
- 15.Province MA, Rao DC. A new model for the resolution of cultural and biological inheritance in the presence of temporal trends: Application to systolic blood pressure. Genet Epidemiol. 1985;2:363–374. doi: 10.1002/gepi.1370020405. [DOI] [PubMed] [Google Scholar]
- 16.Province MA, Tishler P, Rao DC. Repeated-measures model for the investigation of temporal trends using longitudinal family studies: Application to systolic blood pressure. Genet Epidemiol. 1989;6:333–347. doi: 10.1002/gepi.1370060204. [DOI] [PubMed] [Google Scholar]
- 17.Kruglyak L, Daly MJ, Reeve-Daly MP, Lander ES. Parametric and nonparametric linkage analysis: a unified multipoint approach. Am J Hum Genet. 1996;58:1347–1363. [PMC free article] [PubMed] [Google Scholar]
- 18.Rao DC, Province MA, Leppert MF, Oberman A, Heiss G, Ellison RC, Arnett DK, Eckfeldt JH, Schwander K, Mockrin SC, Hunt SC. A genome-wide affected sibpair linkage analysis of hypertension: the HyperGEN network. Am J Hypertens. 2003;16:148–150. doi: 10.1016/s0895-7061(02)03247-8. [DOI] [PubMed] [Google Scholar]
- 19.Cheverud JM, Rutledge JJ, Atchley WR. Quantitative genetics of development: Genetic correlations among age-specific trait values and the evolution of ontogeny. Evolution. 1983;37:895–905. doi: 10.1111/j.1558-5646.1983.tb05619.x. [DOI] [PubMed] [Google Scholar]
- 20.Vaughn TT, Pletscher LS, Peripato A, King-Ellison K, Adams E, Erikson C, Cheverud JM. Mapping quantitative trait loci for murine growth: a closer look at genetic architecture. Genet Res. 1999;74:313–322. doi: 10.1017/s0016672399004103. [DOI] [PubMed] [Google Scholar]
- 21.Feitosa MF, Borecki IB, Rankinen T, Rice T, Després J, Chagnon YC, Gagnon J, Leon AS, Skinner JS, Bouchard C, Province MA, Rao DC. Evidence of QTLs on chromosomes 1q42 and 8q24 for LDL-cholesterol and apoB levels in the HERITAGE Family Study. J Lipid Res. 2005;46:281–286. doi: 10.1194/jlr.M400252-JLR200. [DOI] [PubMed] [Google Scholar]
- 22.Glenn CL, Wang WYS, Benjafield AV, Morris BJ. Linkage and association of tumor necrosis factor receptor 2 locus with hypertension, hypercholesterolemia and plasma shed receptor. Hum Mol Genet. 2000;9:1943–1949. doi: 10.1093/hmg/9.13.1943. [DOI] [PubMed] [Google Scholar]
- 23.Pausova Z, Gaudet D, Gossard F, Bernard M, Kaldunski ML, Jomphe M, Tremblay J, Hudson TJ, Bouchard G, Kotchen TA, Cowley AW, Hamet P. Genome-wide scan for linkage to obesity-associated hypertension in French Canadians. Hypertension. 2005;46:1280–1285. doi: 10.1161/01.HYP.0000188049.23233.fb. [DOI] [PubMed] [Google Scholar]
- 24.Benjafield AV, Wang WYS, Speirs HJL, Morris BJ. Genome-wide scan for hypertension in Sydney sibships: the GENIHUSS study. Am J Hypertens. 2005;18:828–832. doi: 10.1016/j.amjhyper.2004.12.010. [DOI] [PubMed] [Google Scholar]
- 25.Hunt SC, Ellison RC, Atwood LD, Pankow JS, Province MA, Leppert MF. Genome scans for blood pressure and hypertension: The National Heart, Lung, and Blood Institute Family Heart Study. Hypertension. 2002;40:1–6. doi: 10.1161/01.hyp.0000022660.28915.b1. [DOI] [PubMed] [Google Scholar]
- 26.Rutherford S, Cai G, Lopez-Alvarenga JC, Kent JW, Jr., Voruganti VS, Proffitt JM, Curran JE, Johnson MP, Dyer TD, Jowett JB, Bastarrachea RA, Atwood LD, Göring HH, MacCluer JW, Moses EK, Blangero J, Comuzzie AG, Cole SA. A chromosome 11q quantitative-trait locus influences change of blood-pressure measurements over time in Mexican Americans of the San Antonio Family Heart Study. Am J Hum Genet. 2007;81:744–755. doi: 10.1086/521151. [DOI] [PMC free article] [PubMed] [Google Scholar]
- 27.Xu X, Rogus JJ, Terwedow HA, Yang J, Wang Z, Chen C, Niu T, Wang B, Xu H, Weiss S, Schork NJ, Fang Z. An extreme-sib-pair genome scan for genes regulating blood pressure. Am J Hum Genet. 1999;64:1694–1701. doi: 10.1086/302405. [DOI] [PMC free article] [PubMed] [Google Scholar]
- 28.Harrap SB, Wong ZY, Stebbing M, Lamantia A, Bahlo M. Blood pressure QTLs identified by genome-wide linkage analysis and dependence on associated phenotypes. Physiol Genomics. 2002;8:99–105. doi: 10.1152/physiolgenomics.00069.2001. [DOI] [PubMed] [Google Scholar]
- 29.Lasky-Su J, Lyon HN, Emilsson V, Heid IM, Molony C, Raby BA, Lazarus R, Klanderman B, Soto-Quiros ME, Avila L, Silverman EK, Thorleifsson G, Thorsteinsdottir U, Kronenberg F, Vollmert C, Illig T, Fox CS, Levy D, Laird N, Ding X, McQueen MB, Butler J, Ardlie K, Papoutsakis C, Dedoussis G, O'Donnell CJ, Wichmann HE, Celedon JC, Schadt E, Hirschhorn J, Weiss ST, Stefansson K, Lange C. On the replication of genetic associations: timing can be everything! Am J Hum Genet. 2008;82:849–858. doi: 10.1016/j.ajhg.2008.01.018. [DOI] [PMC free article] [PubMed] [Google Scholar]
- 30.Angius A, Petretto E, Maestrale GB, Forabosco P, Casu G, Piras D, Fanciulli M, Falchi M, Melis PM, Palermo M, Pirastu M. A new essential hypertension susceptibility locus on chromosome 2p24-p25, detected by genomewide search. Am J Hum Genet. 2002;71:893–905. doi: 10.1086/342929. [DOI] [PMC free article] [PubMed] [Google Scholar]
- 31.Koivukoski L, Fisher SA, Kanninen T, Lewis CM, von Wowern F, Hunt S, Kardia SL, Levy D, Perola M, Rankinen T, Rao DC, Rice T, Thiel BA, Melander O. Meta-analysis of genome-wide scans for hypertension and blood pressure in Caucasians shows evidence of susceptibility regions on chromosomes 2 and 3. Hum Mol Genet. 2004;13:2325–2332. doi: 10.1093/hmg/ddh237. [DOI] [PubMed] [Google Scholar]
- 32.DeStefano AL, Larson MG, Mitchell GF, Benjamin EJ, Vasan RS, Li J, Corey D, Levy D. Genome-wide scan for pulse pressure in the National Heart, Lung and Blood Institute's Framingham Heart Study. Hypertension. 2004;44:152–155. doi: 10.1161/01.HYP.0000135248.62303.81. [DOI] [PubMed] [Google Scholar]
- 33.Allayee H, de Bruin TW, Michelle DK, Cheng LS, Ipp E, Cantor RM, Krass KL, Keulen ET, Aouizerat BE, Lusis AJ, Rotter JI. Genome scan for blood pressure in Dutch dyslipidemic families reveals linkage to a locus on chromosome 4p. Hypertension. 2001;38:773–778. doi: 10.1161/hy1001.092617. [DOI] [PubMed] [Google Scholar]
- 34.Wu DA, Bu X, Warden CH, Shen DD, Jeng CY, Sheu WH, Fuh MM, Katsuya T, Dzau VJ, Reaven GM, Lusis AJ, Rotter JI, Chen YD. Quantitative trait locus mapping of human blood pressure to a genetic region at or near the lipoprotein lipase gene locus on chromosome 8p22. J Clin Invest. 1996;97:2111–2118. doi: 10.1172/JCI118648. [DOI] [PMC free article] [PubMed] [Google Scholar]
- 35.Gong M, Zhang H, Schulz H, Lee YA, Sun K, Bahring S, Luft FC, Nurnberg P, Reis A, Rohde K, Ganten D, Hui R, Hubner N. Genome-wide linkage reveals a locus for human essential (primary) hypertension on chromosome 12p. Hum Mol Genet. 2003;12:1273–1277. doi: 10.1093/hmg/ddg135. [DOI] [PubMed] [Google Scholar]
- 36.Ranade K, Hinds D, Hsiung CA, Chuang LM, Chang MS, Chen YT, Pesich R, Hebert J, Chen YI, Dzau V, Olshen R, Curb D, Botstein D, Cox DR, Risch N. A genome scan for hypertension susceptibility loci in populations of Chinese and Japanese origins. Am J Hypertens. 2003;16:158–162. doi: 10.1016/s0895-7061(02)03245-4. [DOI] [PubMed] [Google Scholar]
- 37.Chang Y-PC, Liu X, Kim JDO, Ikeda MA, Layton MR, Weder AB, Cooper RS, Kardia SLR, Rao DC, Hunt SC, Luke A, Boerwinkle E, Chakravarti A. Multiple genes for essential-hypertension susceptibility on chromosome 1q. Am J Hum Genet. 2007;80:253–264. doi: 10.1086/510918. [DOI] [PMC free article] [PubMed] [Google Scholar]
- 38.Krushkal J, Ferrell R, Mockrin SC, Turner ST, Sing CF, Boerwinkle E. Genome-wide linkage analyses of systolic blood pressure using highly discordant siblings. Circulation. 1999;99:1407–1410. doi: 10.1161/01.cir.99.11.1407. [DOI] [PubMed] [Google Scholar]
- 39.Rice T, Rankinen T, Chagnon YC, Province MA, Perusse L, Leon AS, Skinner JS, Wilmore JH, Bouchard C, Rao DC. Genomewide linkage scan of resting blood pressure: HERITAGE Family Study. Hypertension. 2002;39:1037–1043. doi: 10.1161/01.hyp.0000018911.46067.6e. [DOI] [PubMed] [Google Scholar]
- 40.Cooper RS, Luke A, Zhu X, Kan D, Adeyemo A, Rotimi C, Bouzekri N, Ward R, Rorimi C. Genome scan among Nigerians linking blood pressure to chromosomes 2, 3, and 19. Hypertension. 2002;40:629–633. doi: 10.1161/01.hyp.0000035708.02789.39. [DOI] [PubMed] [Google Scholar]
- 41.Atwood LD, Samollow PB, Hixson JE, Stern MP, MacCluer JW. Genome-wide linkage analysis of blood pressure in Mexican Americans. Genet Epidemiol. 2001;20:373–382. doi: 10.1002/gepi.7. [DOI] [PubMed] [Google Scholar]
- 42.Perola M, Kainulainen K, Pajukanta P, Terwilliger JD, Hiekkalinna T, Ellonen P, Kaprio J, Koskenvuo M, Kontula K, Peltonen L. Genome-wide scan of predisposing loci for increased diastolic blood pressure in Finnish siblings. J Hypertens. 2000;18:1579–1585. doi: 10.1097/00004872-200018110-00008. [DOI] [PubMed] [Google Scholar]
Associated Data
This section collects any data citations, data availability statements, or supplementary materials included in this article.